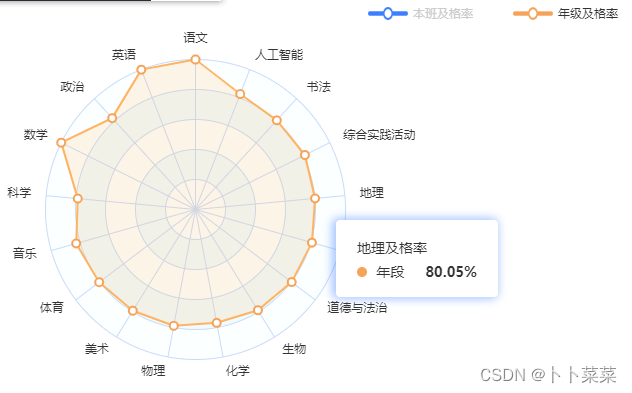
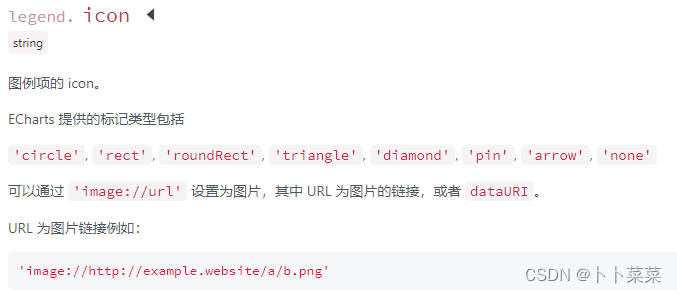
一、图例自定义
实现效果:
//首先引入
import orangeIcon from '../../../../assets/images/class_statistical/icon1.png';
//使用
legend: {
show: true,
data: [{
name: '本班及格率',
icon: 'image://' + blueIcon + ''
},
{
name: '年级及格率',
icon: 'image://' + orangeIcon + ''
}],
x: 'right',
y: 'top',
itemWidth: 40,
itemHeight: 13,
itemGap: 40,//间距
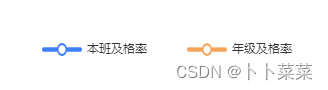
}虽然上面实现了图例自定义,但是仔细看会发现图例与文字不在一条水平线上,利用富文本配置,对height进行调整,实现图例图片与文字对齐。
实现效果:

                            legend: {
                                selectedMode: false,
                                show: true,
                                data: [{
                                    name: '本班及格率',
                                    icon: 'image://' + blueIcon,
                                },
                                {
                                    name: '年级及格率',
                                    icon: 'image://' + orangeIcon
                                }],
                                selected: {
                                    '本班及格率': true,
                                    '年级及格率': true
                                },
                                x: 'right',
                                y: 'top',
                                itemWidth: 40,
                                itemHeight: 13,
                                itemGap: 40,//间距
                                formatter:['{a|{name}}'].join('\n'),//实现图例与文字对齐
                                textStyle:{//实现图例与文字对齐
                                    height:9,
                                    rich:{
                                        a:{
                                        verticalAlign:'bottom'
                                        }
                                    }
                                }
                            },
二、tooltip悬浮框显示内容
官方文档中默认显示该维度的所有数据
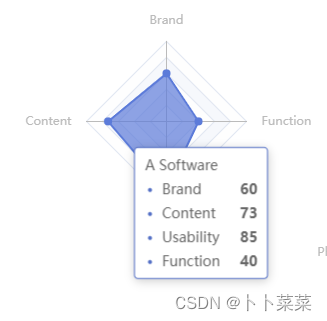
而遇到的需求是显示鼠标悬浮该轴的数据对比
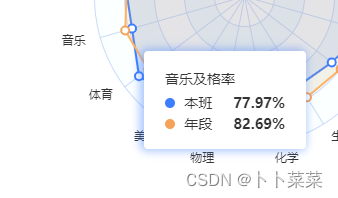
实现:
                        passChart.setOption({//各科及格率对比分析
                            tooltip: {
                                trigger: 'axis',
                                axisPointer: {
                                    type: 'shadow'
                                },
                                show: true,
                                showContent: true,
                                backgroundColor: "#fff",
                                extraCssText: 'box-shadow:-2px 0px 9px 2px rgba(61,126,255,0.45)',
                                textStyle: {
                                    color: "#333333" //设置文字颜色
                                },
                                formatter: (params) => {//自定义绘制tooltip
                                    let str = ''
                                    str = ` <div class="ehover" style="width:120px;background: #FFFFFF;font-family: Microsoft YaHei;">
                                            <h3 style="height:14px;font-size:14px;font-weight:400;line-height:14px;color:#333333;">`+ this.singleSubName[this.isDot] + '及格率' + `</h3>
                                            <ul style="margin:0;paddding:0;list-style:none;color: #333333;font-size: 14px;">
                                                <li style="display:flex;justify-content: space-between;margin-top:6px;height: 15px;">
                                                    <p><span style="width:10px;height:10px;border-radius:10px;background: #3d7eff;margin-top: 6px;display: inline-block;margin-right: 5px;"></span> 本班</p><p style="font-weight:700">`+ this.classPass + '%' + `</p>
                                                </li>
                                                <li style="display:flex;justify-content: space-between;margin-top:6px;height: 15px;">
                                                    <p><span style="width:10px;height:10px;border-radius:10px;background: #F4A359;margin-top: 6px;display: inline-block;margin-right: 5px;"></span> 年段</p><p style="font-weight:700">`+ this.gradePass + '%' + `</p>
                                                </li>
                                            </ul>
                                        </div>`
                                    return this.singleSubName[this.isDot] ? str : ''//解决未在拐点悬浮undefine问题
                                }
                            },
                            legend: {
                                show: true,
                                data: [{
                                    name: '本班及格率',
                                    icon: 'image://' + blueIcon + ''
                                },
                                {
                                    name: '年级及格率',
                                    icon: 'image://' + orangeIcon + ''
                                }],
                                x: 'right',
                                y: 'top',
                                itemWidth: 40,
                                itemHeight: 13,
                                itemGap: 40,//间距
                            },
                            radar: [
                                {
                                    shape: 'circle',
                                    splitNumber: 5,
                                    indicator: this.subScoreMax,
                                    radius: 150,
                                    shape: 'circle',
                                    axisName: {
                                        color: '#333333'
                                    },
                                    axisLine: {//圆分隔线
                                        lineStyle: {
                                            color: '#C8DBF8'
                                        }
                                    },
                                    splitLine: {//列分隔线
                                        lineStyle: {
                                            color: '#C8DBF8'
                                        }
                                    },
                                    splitArea: {//背景圈颜色
                                        show: true,
                                        areaStyle: {
                                            color: ['rgb(252,255,255)', 'rgb(240,251,255)']
                                        }
                                    }
                                },
                            ],
                            series: [
                                {
                                    type: 'radar',
                                    tooltip: {
                                        trigger: 'item',
                                        axisPointer: {
                                            type: 'shadow'
                                        },
                                        show: true,
                                        showContent: true,
                                        backgroundColor: "#fff",
                                        padding: 20,  //内边距
                                        extraCssText: 'box-shadow:-2px 0px 9px 2px rgba(61,126,255,0.45)',
                                        textStyle: {
                                            color: "#333333" //设置文字颜色
                                        },
                                    },
                                    data: [
                                        {
                                            value: ,//数据
                                            name: '本班及格率',
                                            subjectName: this.subScoreMax,
                                            lineStyle: { color: '#3d7eff' },
                                            itemStyle: {
                                                color: '#FFFFFF', borderColor: '#3d7eff', borderWidth: 2, //实现空心圆点
                                            },
                                            areaStyle: {//区域颜色覆盖
                                                color: '#3d7eff',
                                                width: 1,
                                                opacity: 0.15
                                            },
                                        },
                                        {
                                            value: ,//数据
                                            name: '年级及格率',
                                            lineStyle: { color: '#f4a359' },
                                            itemStyle: {
                                                color: '#FFFFFF', borderColor: '#f4a359', borderWidth: 2 //实现空心圆点
                                            },
                                            areaStyle: {//区域颜色覆盖
                                                color: '#f4a359',
                                                width: 1,
                                                opacity: 0.15

                                            }
                                        }
                                    ]
                                },
                            ]
                        })
                        passChart.on('mouseover', (params) => {//写成箭头函数,获取到vue实例对象上的数据
                            this.isDot = params.event.target.__dimIdx;//获取鼠标停留拐点的数据
                            this.classPass = this.subListClone[this.isDot].passing_rate[0]//雷达图拐点本班及格率
                            this.gradePass = this.subListClone[this.isDot].passing_rate[1]//雷达图拐点年段及格率
                        })
虽然实现了tooltip自定义,但是此时还有一个小缺陷:图例点击隐藏系列数据时,tooltip却不能动态展示:
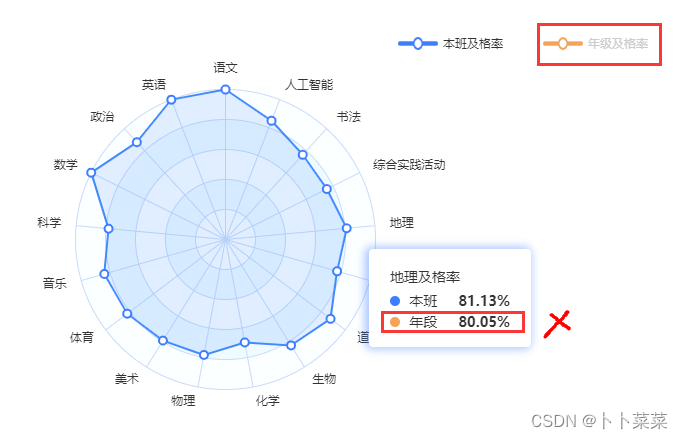
解决方法有二:
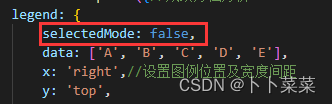
- 将图例的点击事件关闭(最简单粗暴)
- 通过绑定legendselectchanged事件获取图例的selected值(true和false),并根据此值控制tooltip样式。
实现代码:
classLegend: { click: true },//data中存放图例点击的值
gradeLegend: { click: true },//data中存放图例点击的值


passChart.on("legendselectchanged", (params) => {//获知图例点击时的true和false
        this.$set(this.classLegend, 'click', params.selected.本班及格率)
        this.$set(this.gradeLegend, 'click', params.selected.年级及格率)
})


 tooltip: {
           trigger: 'axis',
           axisPointer: {
           type: 'shadow'
            },
            show: true,
            showContent: true,
            backgroundColor: "#fff",
            extraCssText: 'box-shadow:-2px 0px 9px 2px rgba(61,126,255,0.45)',
            textStyle: {
                        color: "#333333" //设置文字颜色
                        },
            formatter: (params) => {
                         let str = ''
                         if (this.classLegend.click) {//tooltip展示该维度所有数据
                                        str = ` <div class="ehover" style="width:120px;background: #FFFFFF;font-family: Microsoft YaHei;">
                                            <h3 style="height:14px;font-size:14px;font-weight:400;line-height:14px;color:#333333;">`+ this.singleSubName[this.isDot] + '及格率' + `</h3>
                                            <ul style="margin:0;padding:0;list-style:none;color: #333333;font-size: 14px;">
                                                <li style="display:flex;justify-content: space-between;margin-top:6px;height: 15px;">
                                                    <p><span style="width:10px;height:10px;border-radius:10px;background: #3d7eff;margin-top: 6px;display: inline-block;margin-right: 5px;"></span> 本班</p><p style="font-weight:700">`+ this.classPass + '%' + `</p>
                                                </li>
                                                <li style="display:flex;justify-content: space-between;margin-top:6px;height: 15px;">
                                                    <p><span style="width:10px;height:10px;border-radius:10px;background: #F4A359;margin-top: 6px;display: inline-block;margin-right: 5px;"></span> 年段</p><p style="font-weight:700">`+ this.gradePass + '%' + `</p>
                                                </li>
                                            </ul>
                                        </div>`
                                        return this.singleSubName[this.isDot] ? str : ''//解决未在拐点悬浮undefine问题
                                    } else if (this.gradeLegend.click) {//legend点击tooltip仅展示年级及格率
                                        str = ` <div class="ehover" style="width:120px;background: #FFFFFF;font-family: Microsoft YaHei;">
                                            <h3 style="height:14px;font-size:14px;font-weight:400;line-height:14px;color:#333333;">`+ this.singleSubName[this.isDot] + '及格率' + `</h3>
                                            <ul style="margin:0;padding:0;list-style:none;color: #333333;font-size: 14px;">
                                                <li style="display:flex;justify-content: space-between;margin-top:6px;height: 15px;">
                                                    <p><span style="width:10px;height:10px;border-radius:10px;background: #F4A359;margin-top: 6px;display: inline-block;margin-right: 5px;"></span> 年段</p><p style="font-weight:700">`+ this.gradePass + '%' + `</p>
                                                </li>
                                            </ul>
                                        </div>`
                                        return this.singleSubName[this.isDot] ? str : ''//解决未在拐点悬浮undefine问题
                                    } else if(this.classLegend.click) {//legend点击tooltip仅展示年级及格率
                                        str = ` <div class="ehover" style="width:120px;background: #FFFFFF;font-family: Microsoft YaHei;">
                                            <h3 style="height:14px;font-size:14px;font-weight:400;line-height:14px;color:#333333;">`+ this.singleSubName[this.isDot] + '及格率' + `</h3>
                                            <ul style="margin:0;padding:0;list-style:none;color: #333333;font-size: 14px;">
                                                <li style="display:flex;justify-content: space-between;margin-top:6px;height: 15px;">
                                                    <p><span style="width:10px;height:10px;border-radius:10px;background: #3d7eff;margin-top: 6px;display: inline-block;margin-right: 5px;"></span> 本班</p><p style="font-weight:700">`+ this.classPass + '%' + `</p>
                                                </li>
                                            </ul>
                                        </div>`
                                        return this.singleSubName[this.isDot] ? str : ''//解决未在拐点悬浮undefine问题
                                    }
                                }
                            },
注意事项:
- 给classLegend等赋值不能直接赋值:this.classLegend.click=params.selected.本班及格率,要利用this.$set,直接赋值不是响应式的,在tooltip中获取不到click值随图例点击而变化。
- 绑定legendselectchanged事件要写成箭头函数,获取this,拿到data里面的this.classLegend。
实现效果: