基于蚁群算法的三维路径规划算法
蚁群算法(Ant Colony Optimization, ACO)是一种模拟自然界中蚂蚁寻找食物路径的启发式优化算法。在后面的MATLAB代码中,蚁群算法被应用于三维空间的路径规划问题。下面是这个实现的概述:
初始化环境:
清除命令窗口和所有变量,为运算提供一个干净的环境。
数据与参数初始化:
从“HeightData”中加载地形数据,这些数据代表三维空间的高度信息。
设置网格参数以及起点和终点的坐标。
初始化蚁群算法的参数,如种群(蚂蚁)数量和信息素初始矩阵。
初始路径搜索:
根据当前的信息素矩阵寻找路径。蚂蚁根据信息素的浓度选择路径。
计算各路径的适应度,这通常与路径的长度或其他成本指标有关。
选择适应度最好的路径作为当前最佳路径。
信息素更新:
蚂蚁在走过的路径上释放信息素,信息素的量与路径的适应度成反比。
同时,为模拟信息素的挥发,所有路径上的信息素都会减少一个固定的百分比。
迭代优化:
对于多次迭代,蚂蚁会基于更新后的信息素矩阵重新搜索路径。
在每次迭代后,都会更新最佳路径和相关的信息素。
结果展示:
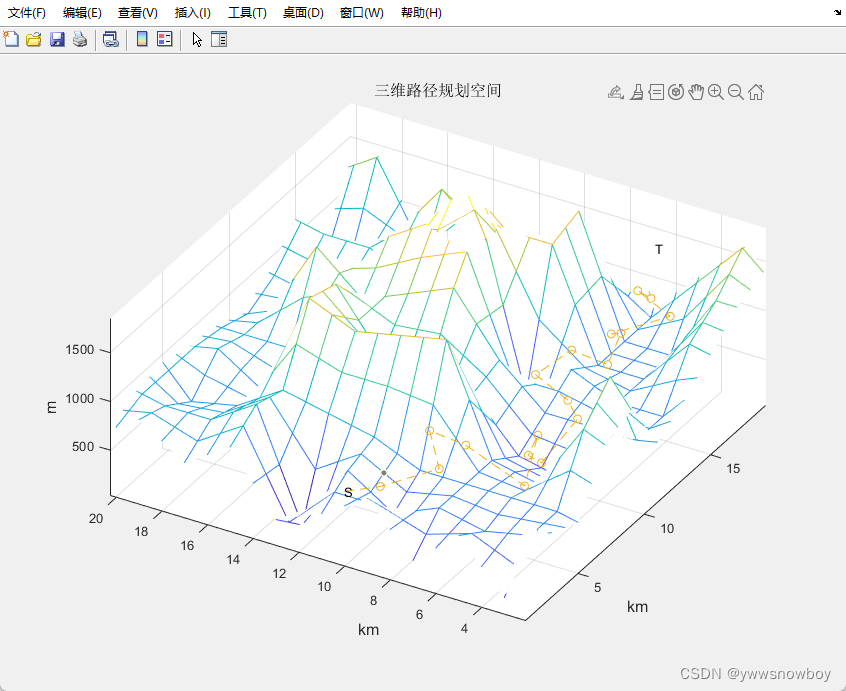
使用三维图形显示地形数据和最佳路径。
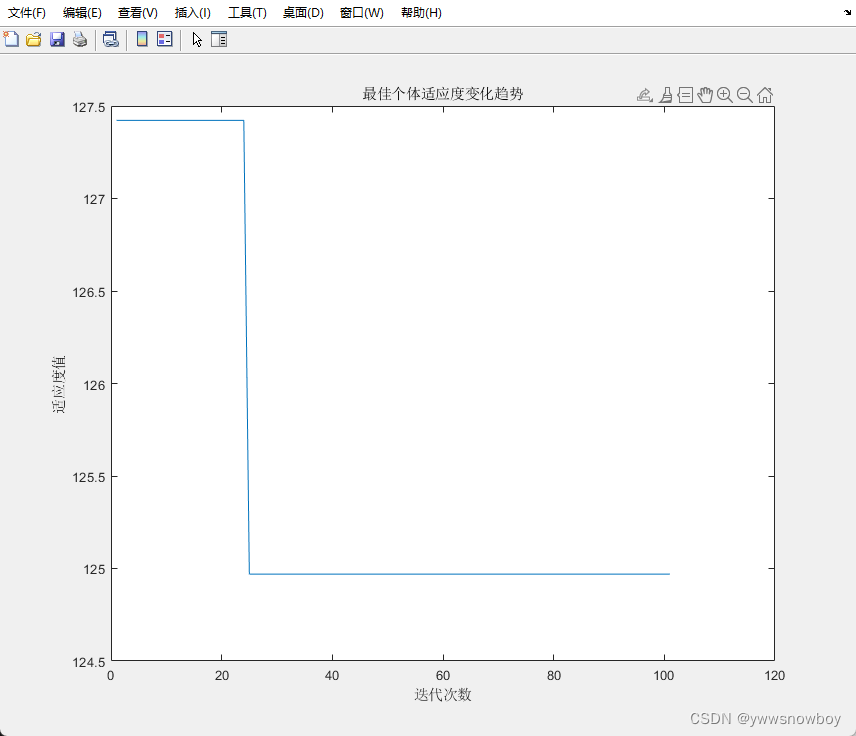
另外,还绘制了一个图显示最佳适应度随迭代次数的变化趋势,从而可以观察算法的收敛情况。
在此实现中,蚁群算法被成功应用于三维空间的路径规划问题。通过多次迭代,蚂蚁逐渐找到了一个优化的路径。
该代码的伪代码如下:
PSEUDOCODE: Ant Colony Algorithm for 3D Path Planning
	CLEAR environment.
	LOAD terrain data "HeightData".
	   SET grid, start & end points, and algorithm parameters.
	   INITIALIZE pheromone matrix.
	INITIAL PATH SEARCH:
	   Search path using pheromone matrix.
	   Calculate fitness for paths.
	   Identify best path and update BestFitness.
	PHEROMONE UPDATE:
	   FOR each point in best path:
	      UPDATE pheromone value.
	ITERATIVE SEARCH for optimal path (Repeat 100 times):
	   Search new paths using pheromone.
	   Update best path if better one found.
	   Update pheromone values based on best path.
	PLOT best path on 3D terrain.
	DISPLAY fitness evolution across iterations.
END
main.m函数代码如下:
%% 蚁群算法三维路径规划演示
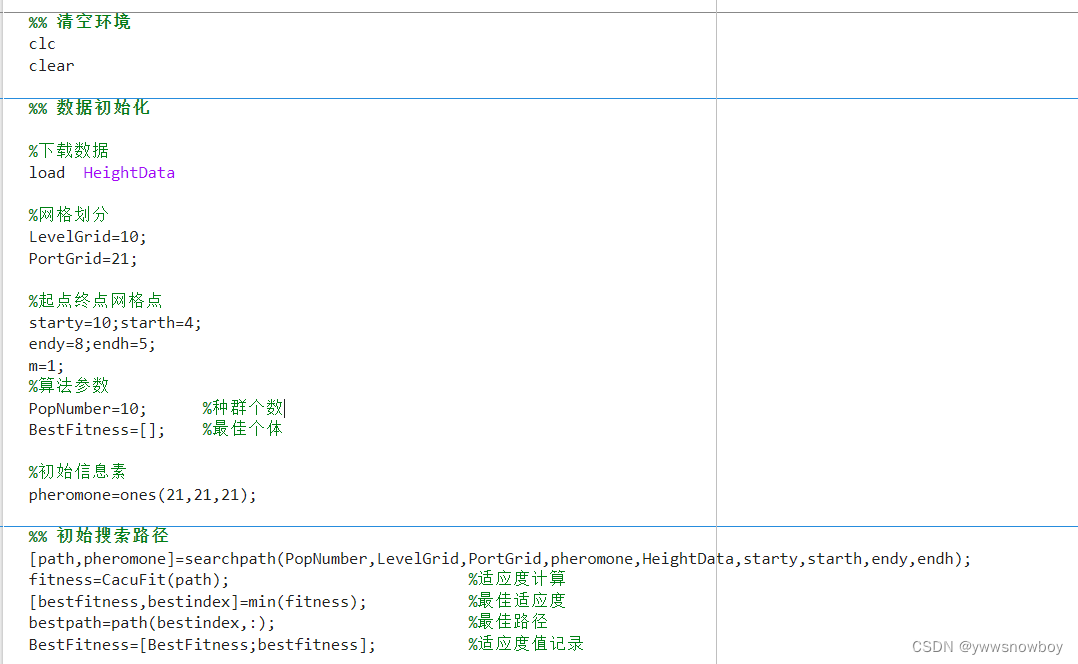
%% 清空环境
clc; % 清除命令行窗口
clear; % 清除所有变量
%% 数据初始化
% 加载地形数据
load HeightData;
% 网格划分参数
LevelGrid=10; % 纵向网格数量
PortGrid=21; % 横向网格数量
% 定义起点和终点的网格坐标
starty=10; starth=4;
endy=8; endh=5;
m=1;
% 蚁群算法参数定义
PopNumber=10; % 种群数量或蚂蚁数量
BestFitness=[]; % 存储每代的最佳适应度值
% 初始化信息素矩阵
pheromone=ones(21,21,21);
%% 初始搜索路径
% 根据当前信息素矩阵寻找路径
[path,pheromone] = searchpath(PopNumber, LevelGrid, PortGrid, pheromone, HeightData, starty, starth, endy, endh);
fitness = CacuFit(path); % 计算路径适应度
[bestfitness,bestindex] = min(fitness); % 获取最佳适应度及其索引
bestpath = path(bestindex,:); % 获取最佳路径
BestFitness = [BestFitness; bestfitness]; % 记录最佳适应度
%% 信息素更新
rou = 0.2; % 信息素挥发系数
cfit = 100 / bestfitness;
% 只更新最佳路径上的信息素值
for i = 2:PortGrid-1
pheromone(i, bestpath(i*2-1), bestpath(i*2)) = ...
(1-rou) * pheromone(i, bestpath(i*2-1), bestpath(i*2)) + rou * cfit;
end
%% 循环寻找最优路径
for kk = 1:100
% 基于当前信息素矩阵寻找路径
[path,pheromone] = searchpath(PopNumber, LevelGrid, PortGrid, ...
pheromone, HeightData, starty, starth, endy, endh);
% 计算并更新适应度值
fitness = CacuFit(path);
[newbestfitness,newbestindex] = min(fitness);
if newbestfitness < bestfitness
bestfitness = newbestfitness;
bestpath = path(newbestindex,:);
end
BestFitness = [BestFitness; bestfitness];
% 更新信息素值
cfit = 100 / bestfitness;
for i = 2:PortGrid-1
pheromone(i, bestpath(i*2-1), bestpath(i*2)) = (1-rou) * ...
pheromone(i, bestpath(i*2-1), bestpath(i*2)) + rou * cfit;
end
end
%% 绘制最佳路径
for i = 1:21
a(i,1) = bestpath(i*2-1);
a(i,2) = bestpath(i*2);
end
figure(1);
x = 1:21; y = 1:21;
[x1,y1] = meshgrid(x,y);
mesh(x1, y1, HeightData);
axis([1,21,1,21,0,2000]);
hold on;
k = 1:21;
% 绘制起点和终点
plot3(k(1), a(1,1), a(1,2)*200, '--o','LineWidth',2,'MarkerEdgeColor','k','MarkerFaceColor','g','MarkerSize',10);
plot3(k(21), a(21,1), a(21,2)*200, '--o','LineWidth',2,'MarkerEdgeColor','k','MarkerFaceColor','g','MarkerSize',10);
text(k(1), a(1,1), a(1,2)*200, 'S');
text(k(21), a(21,1), a(21,2)*200, 'T');
xlabel('km', 'fontsize', 12);
ylabel('km', 'fontsize', 12);
zlabel('m', 'fontsize', 12);
title('三维路径规划空间', 'fontsize', 12);
hold on;
plot3(k, a(:,1), a(:,2)*200, '--o');
%% 绘制适应度变化图
figure(2);
plot(BestFitness);
title('最佳个体适应度变化趋势');
xlabel('迭代次数');
ylabel('适应度值');
代码图:
运行结果: