如何从平面图或蓝图为 ROS 创建地图
在本教程中,我将向您展示如何从平面图或蓝图为 RViz(ROS 的 3D 可视化程序)创建地图。为 RViz 创建地图是使机器人能够在环境中自主导航的重要步骤。
我们经常使用机器人的激光雷达来构建地图。这很好,但如果您根据手头已有的平面图或蓝图创建地图,通常可以构建出更好、更准确的地图。
-
您需要做的第一件事是获取平面图或蓝图。确保它是 .png 格式。
-
将图像保存到最终要加载地图的目录。
-
安装地图服务器
sudo apt-get install ros-melodic-map-server
使用 Paint.net 等程序根据需要编辑图像文件。
- 使用 OpenCV 将图像转换为二进制格式。这是它的代码。我将程序命名为 convert_to_binary.py。
import cv2 # Import OpenCV

# read the image file
img = cv2.imread('mii_floor_plan_4.png')

ret, bw_img = cv2.threshold(img, 220, 255, cv2.THRESH_BINARY)

# converting to its binary form
bw = cv2.threshold(img, 240, 255, cv2.THRESH_BINARY)

# Display and save image
cv2.imshow("Binary", bw_img)
cv2.imwrite("mii_floor_plan_4_binary.png", bw_img)
cv2.waitKey(0)
cv2.destroyAllWindows()
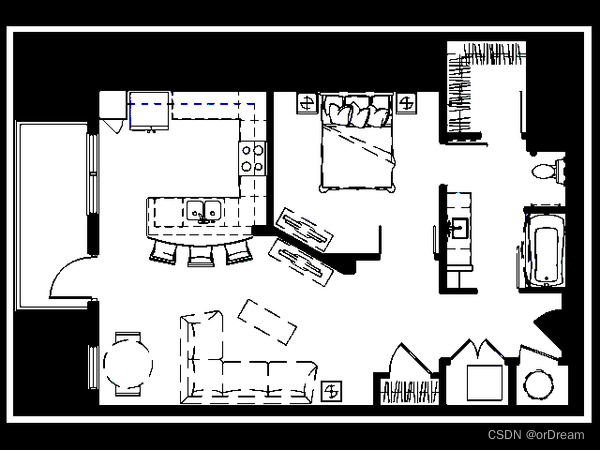
我的图像名称是 mii_floor_plan_4_binary.png。这是图像。
现在,让我们创建 .pgm 和 .yaml 地图文件。 ROS 需要这两种文件格式才能在 RViz 上显示地图。将下面的代码 MakeROSMap.py 写在与 .png 图像文件相同的目录中。
import numpy as np
import cv2
import math
import os.path

#
#  This is a start for the map program
#
prompt = '> '

print("What is the name of your floor plan you want to convert to a ROS map:")
file_name = input(prompt)
print("You will need to choose the x coordinates horizontal with respect to each other")
print("Double Click the first x point to scale")
#
# Read in the image
#
image = cv2.imread(file_name)
#
# Some variables
#
ix,iy = -1,-1
x1 = [0,0,0,0]
y1 = [0,0,0,0]
font = cv2.FONT_HERSHEY_SIMPLEX
#
# mouse callback function
# This allows me to point and
# it prompts me from the command line
#
def draw_point(event,x,y,flags,param):
  global ix,iy,x1,y1n,sx,sy
  if event == cv2.EVENT_LBUTTONDBLCLK:
    ix,iy = x,y
    print(ix,iy)
#
# Draws the point with lines around it so you can see it
#
    image[iy,ix]=(0,0,255)
    cv2.line(image,(ix+2,iy),(ix+10,iy),(0,0,255),1)
    cv2.line(image,(ix-2,iy),(ix-10,iy),(0,0,255),1)
    cv2.line(image,(ix,iy+2),(ix,iy+10),(0,0,255),1)
    cv2.line(image,(ix,iy-2),(ix,iy-10),(0,0,255),1)
#
# This is for the 4 mouse clicks and the x and y lengths
#
    if x1[0] == 0:
      x1[0]=ix
      y1[0]=iy
      print('Double click a second x point')
    elif (x1[0] != 0 and x1[1] == 0):
      x1[1]=ix
      y1[1]=iy
      prompt = '> '
      print("What is the x distance in meters between the 2 points?")
      deltax = float(input(prompt))
      dx = math.sqrt((x1[1]-x1[0])**2 + (y1[1]-y1[0])**2)*.05
      sx = deltax / dx
      print("You will need to choose the y coordinates vertical with respect to each other")
      print('Double Click a y point')
    elif (x1[1] != 0 and x1[2] == 0):
      x1[2]=ix
      y1[2]=iy
      print('Double click a second y point')
    else:
      prompt = '> '
      print("What is the y distance in meters between the 2 points?")
      deltay = float(input(prompt))
      x1[3]=ix
      y1[3]=iy
      dy = math.sqrt((x1[3]-x1[2])**2 + (y1[3]-y1[2])**2)*.05
      sy = deltay/dy
      print(sx, sy)
      res = cv2.resize(image, None, fx=sx, fy=sy, interpolation = cv2.INTER_CUBIC)
      # Convert to grey
      res = cv2.cvtColor(res, cv2.COLOR_BGR2GRAY)
      cv2.imwrite("KEC_BuildingCorrected.pgm", res );
      cv2.imshow("Image2", res)
      #for i in range(0,res.shape[1],20):
        #for j in range(0,res.shape[0],20):
          #res[j][i][0] = 0
          #res[j][i][1] = 0
          #res[j][i][2] = 0
      #cv2.imwrite("KEC_BuildingCorrectedDots.pgm",res)
        # Show the image in a new window
        #  Open a file
      prompt = '> '
      print("What is the name of the new map?")
      mapName = input(prompt)

      prompt = '> '
      print("Where is the desired location of the map and yaml file?")
      print("NOTE: if this program is not run on the TurtleBot, Please input the file location of where the map should be saved on TurtleBot. The file will be saved at that location on this computer. Please then tranfer the files to TurtleBot.")
      mapLocation = input(prompt)
      completeFileNameMap = os.path.join(mapLocation, mapName +".pgm")
      completeFileNameYaml = os.path.join(mapLocation, mapName +".yaml")
      yaml = open(completeFileNameYaml, "w")
      cv2.imwrite(completeFileNameMap, res );
        #
        # Write some information into the file
        #
      yaml.write("image: " + mapLocation + "/" + mapName + ".pgm\n")
      yaml.write("resolution: 0.050000\n")
      yaml.write("origin: [" + str(-1) + "," +  str(-1) + ", 0.000000]\n")
      yaml.write("negate: 0\noccupied_thresh: 0.65\nfree_thresh: 0.196")
      yaml.close()
      exit()

cv2.namedWindow('image', cv2.WINDOW_NORMAL)
cv2.setMouseCallback('image',draw_point)
#
#  Waiting for a Esc hit to quit and close everything
#
while(1):
  cv2.imshow('image',image)
  k = cv2.waitKey(20) & 0xFF
  if k == 27:
    break
  elif k == ord('a'):
    print('Done')
cv2.destroyAllWindows()
我的两个输出文件是 floorplan4.pgm 和 floorplan4.yaml。
打开 yaml 文件(floorplan4.yaml)并将 pgm 图像的完整路径放入图像标签中。
image: /home/focalfossa/catkin_ws/maps/floorplan4.pgm
resolution: 0.050000
origin: [-1,-1, 0.000000]
negate: 0
occupied_thresh: 0.65
free_thresh: 0.196
要找出完整路径,您可以转到 Linux 中的文件资源管理器并右键单击图像。然后转到属性。
保存文件并关闭它。
现在载入地图。在新的终端窗口中,键入:
rosrun map_server map_server floorplan4.yaml
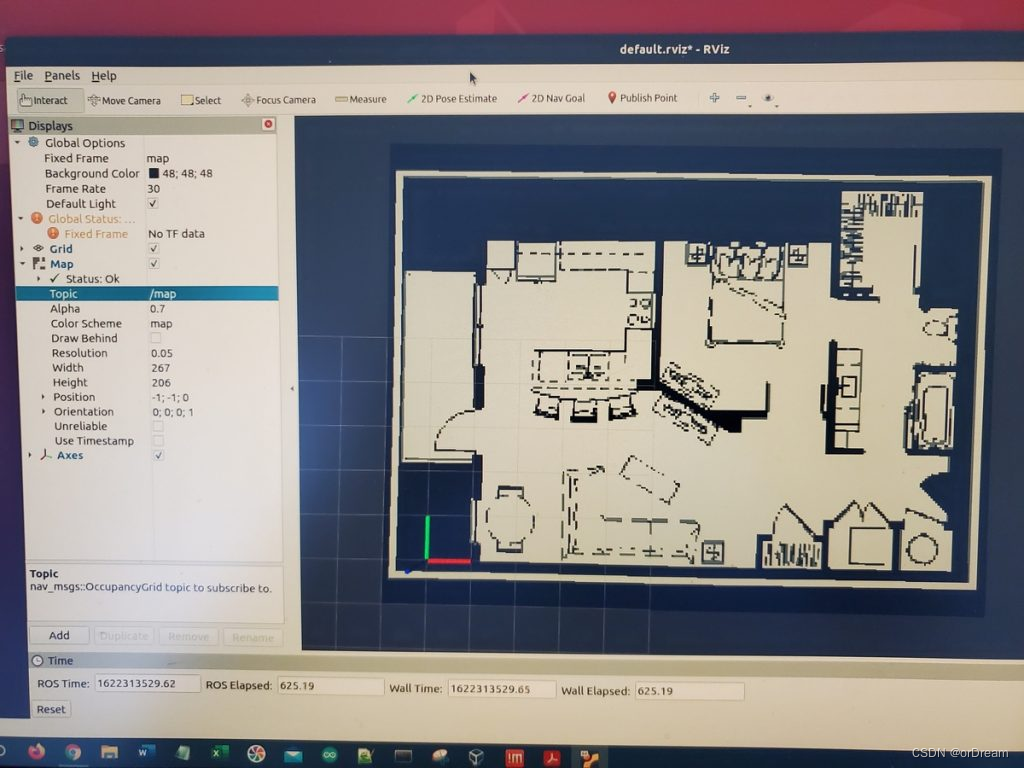
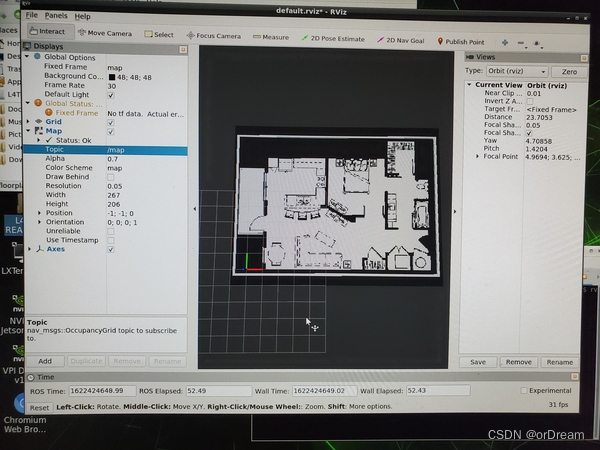
打开 rviz
点击左下角的添加,添加地图显示。
在地图部分的主题下,选择 /map。
您应该会在屏幕上看到保存的地图。
reference
@misc{BibEntry2023Jun,
title = {
{How to Create a Map for ROS From a Floor Plan or Blueprint {\textendash} Automatic Addison — xn–siqwnon76wa479ac7k3qhmv8fryvb ROS xn–5bry2jjet02a {\textendash} Automatic Addison}},
year = {2023},
month = jun,
note = {[Online; accessed 5. Jun. 2023]},
url = {https://automaticaddison.com/how-to-create-a-map-for-ros-from-a-floor-plan-or-blueprint}
}