文章目录
一、安装Docker
注意:我这里使用之前写好脚本进行安装Docker,如果已经有Docker请省略此步骤,安装Docker是为了方便部署ElasticSearch服务,如果已经有数据库前两步骤都可以省略。
tar zxf docker20.10.14Install.tar.gz
cd docker20.10.14Install
bash install.sh
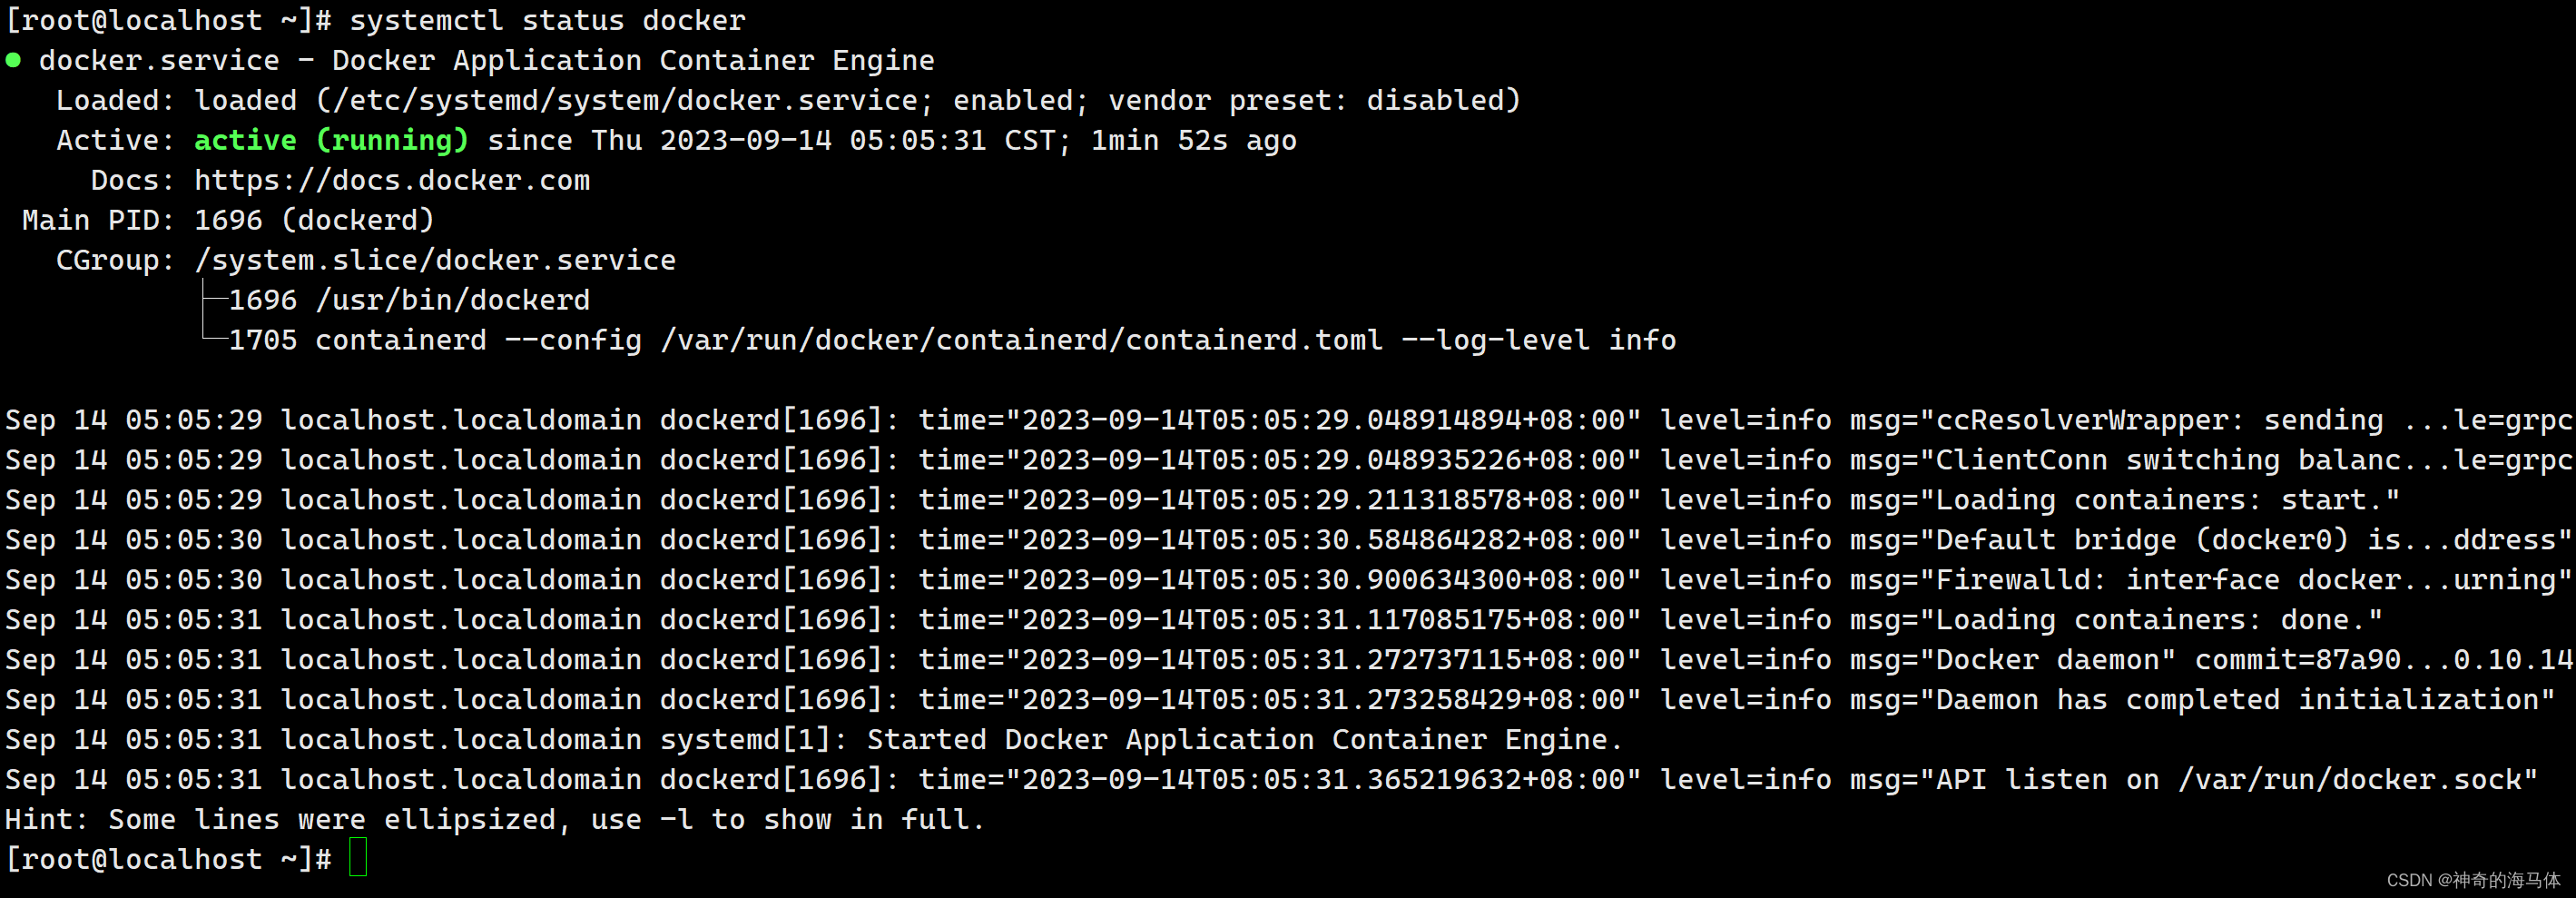
查看Docker状态如下图表示没问题:
systemctl status docker
二、安装ElasticSearch(Docker容器方式)
1、前提准备:
docker pull docker.elastic.co/elasticsearch/elasticsearch:7.17.6
mkdir /home/software/elasticsearch/{

    data,plugins,config,logs} -p
chmod -R 777 /home/software/elasticsearch
echo "vm.max_map_count=262144" >> /etc/sysctl.conf

systemctl stop firewalld
systemctl disable firewalld
iptables -F
2、创建配置文件
cat > /home/software/elasticsearch/config/elasticsearch.yml << EOF
cluster.name: "docker-cluster"
network.host: 0.0.0.0
EOF
3、运行容器:
docker run -itd --name elasticsearch  -p 9200:9200 -p 9300:9300 \
    -v /home/software/elasticsearch/data:/usr/share/elasticsearch/data \
    -v /home/software/elasticsearch/plugins:/usr/share/elasticsearch/plugins \
    -v /home/software/elasticsearch/config/elasticsearch.yml:/usr/share/elasticsearch/config/elasticsearch.yml \
    -v /home/software/elasticsearch/logs:/usr/share/elasticsearch/logs \
    -v /etc/localtime:/etc/localtime  -e ES_JAVA_OPTS="-Xms512m -Xmx512m" \
    -v /etc/sysctl.conf:/etc/sysctl.conf  -e "node.name=es1" \
    -e "discovery.seed_hosts=es1" -e "cluster.initial_master_nodes=es1" \
    -e "http.host=0.0.0.0" --privileged --restart=always \
    docker.elastic.co/elasticsearch/elasticsearch:7.17.6
设置vm.max_map_count 防止启动失败
docker exec -it elasticsearch sysctl -w vm.max_map_count=262144
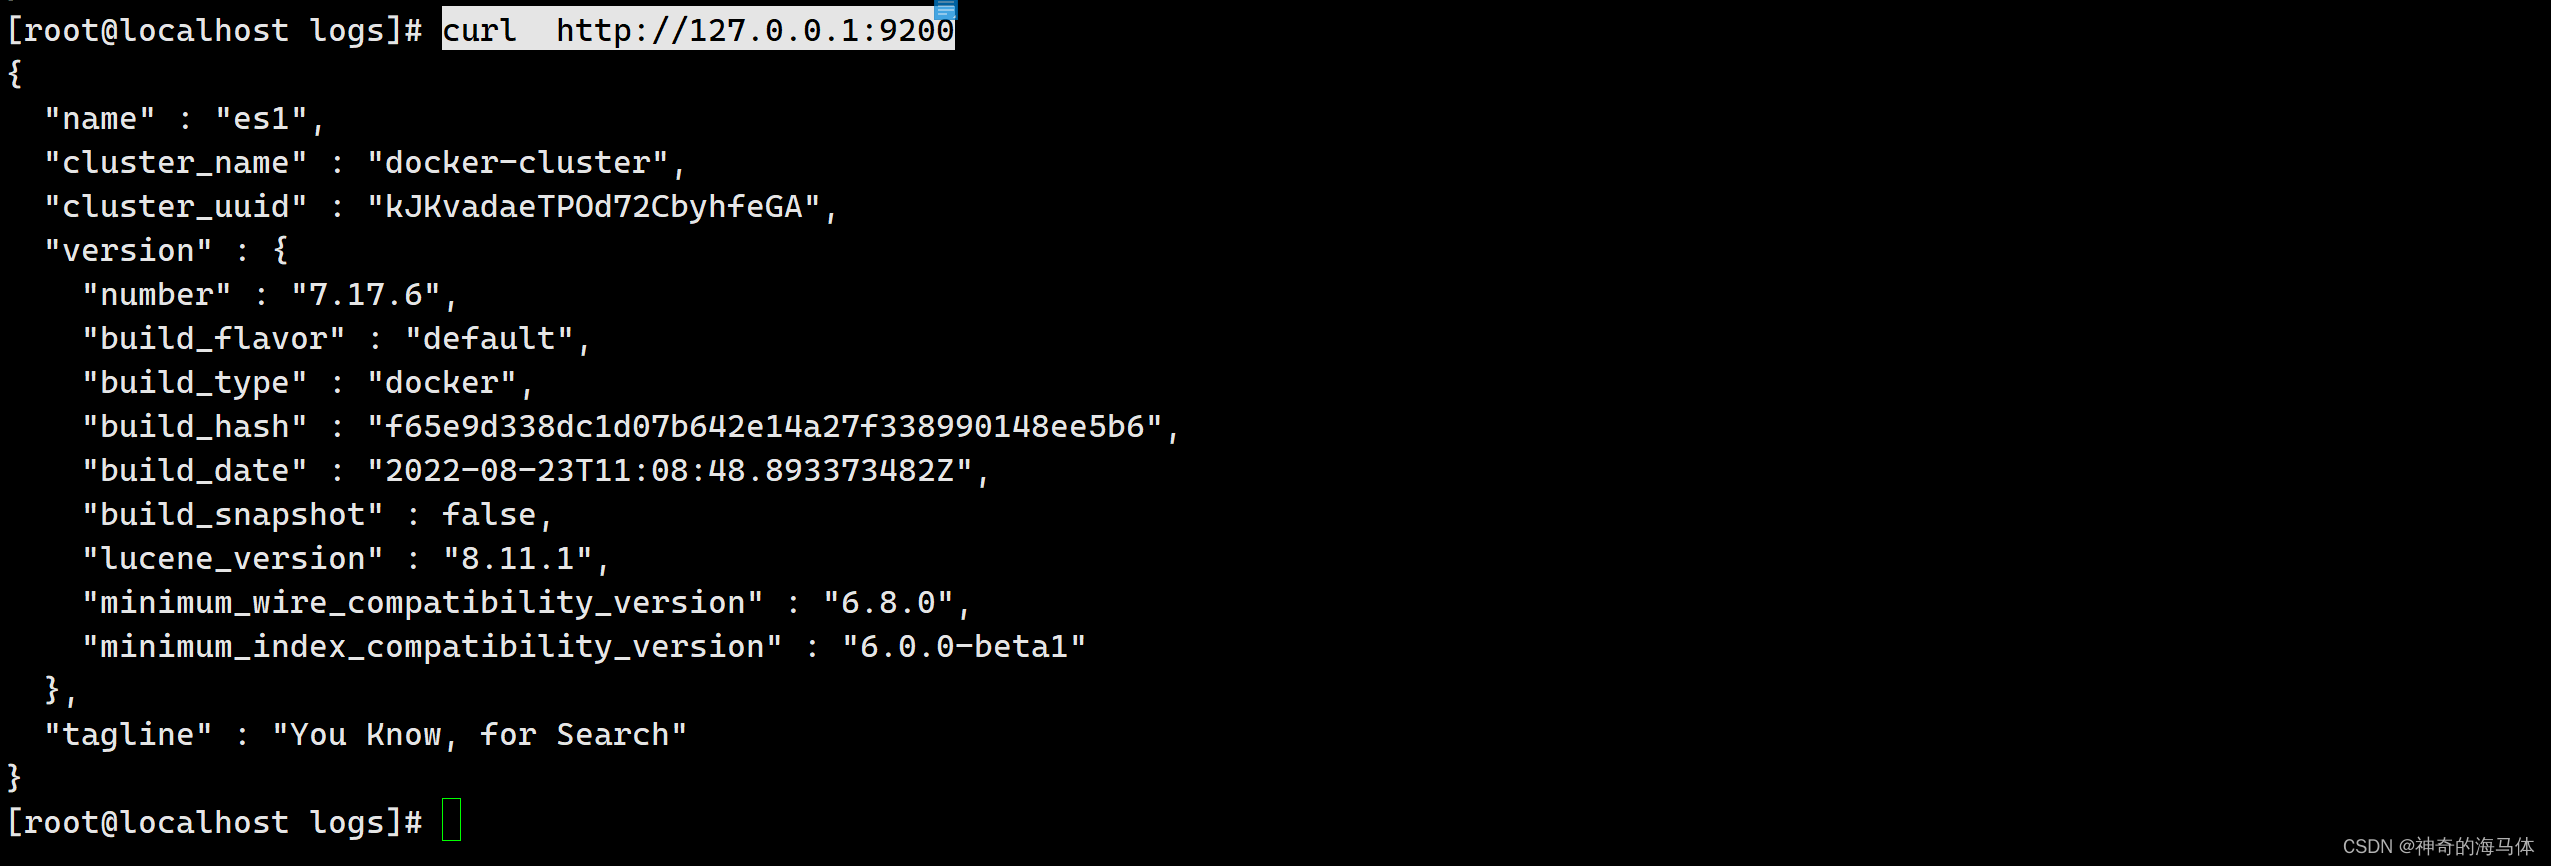
4、验证ElasticSearch服务是否正常
此步骤需要耐心等待ES启动才可以请求到,大约等待1分钟,具体根据服务器性能所决定
curl http://127.0.0.1:9200
如下图:返回ElasticSearch状态信息,表示无误。
三、安装Prometheus
1、时间和时区同步
timedatectl set-timezone Asia/Shanghai
yum -y install ntpdate
/usr/sbin/ntpdate -u ntp1.aliyun.com
配置计划任务定时同步时间
echo "0 5 * * * /usr/sbin/ntpdate -u ntp1.aliyun.com >/dev/null &" >> /var/spool/cron/root
crontab -l
2、安装Prometheus
wget https://github.com/prometheus/prometheus/releases/download/v2.42.0/prometheus-2.42.0.linux-amd64.tar.gz

tar zxf prometheus-2.42.0.linux-amd64.tar.gz
mv prometheus-2.42.0.linux-amd64 /usr/local/prometheus
3、配置systemd管理
cat > /usr/lib/systemd/system/prometheus.service << EOF
[Unit]

[Service]
ExecStart=/usr/local/prometheus/prometheus --config.file=/usr/local/prometheus/prometheus.yml
ExecReload=/bin/kill -HUP \$MAINPID

[Install]
WantedBy=multi-user.target
Alias=dbus-org.fedoraproject.FirewallD1.service
EOF
4、启动并设置开机自启
systemctl enable prometheus --now
systemctl status prometheus
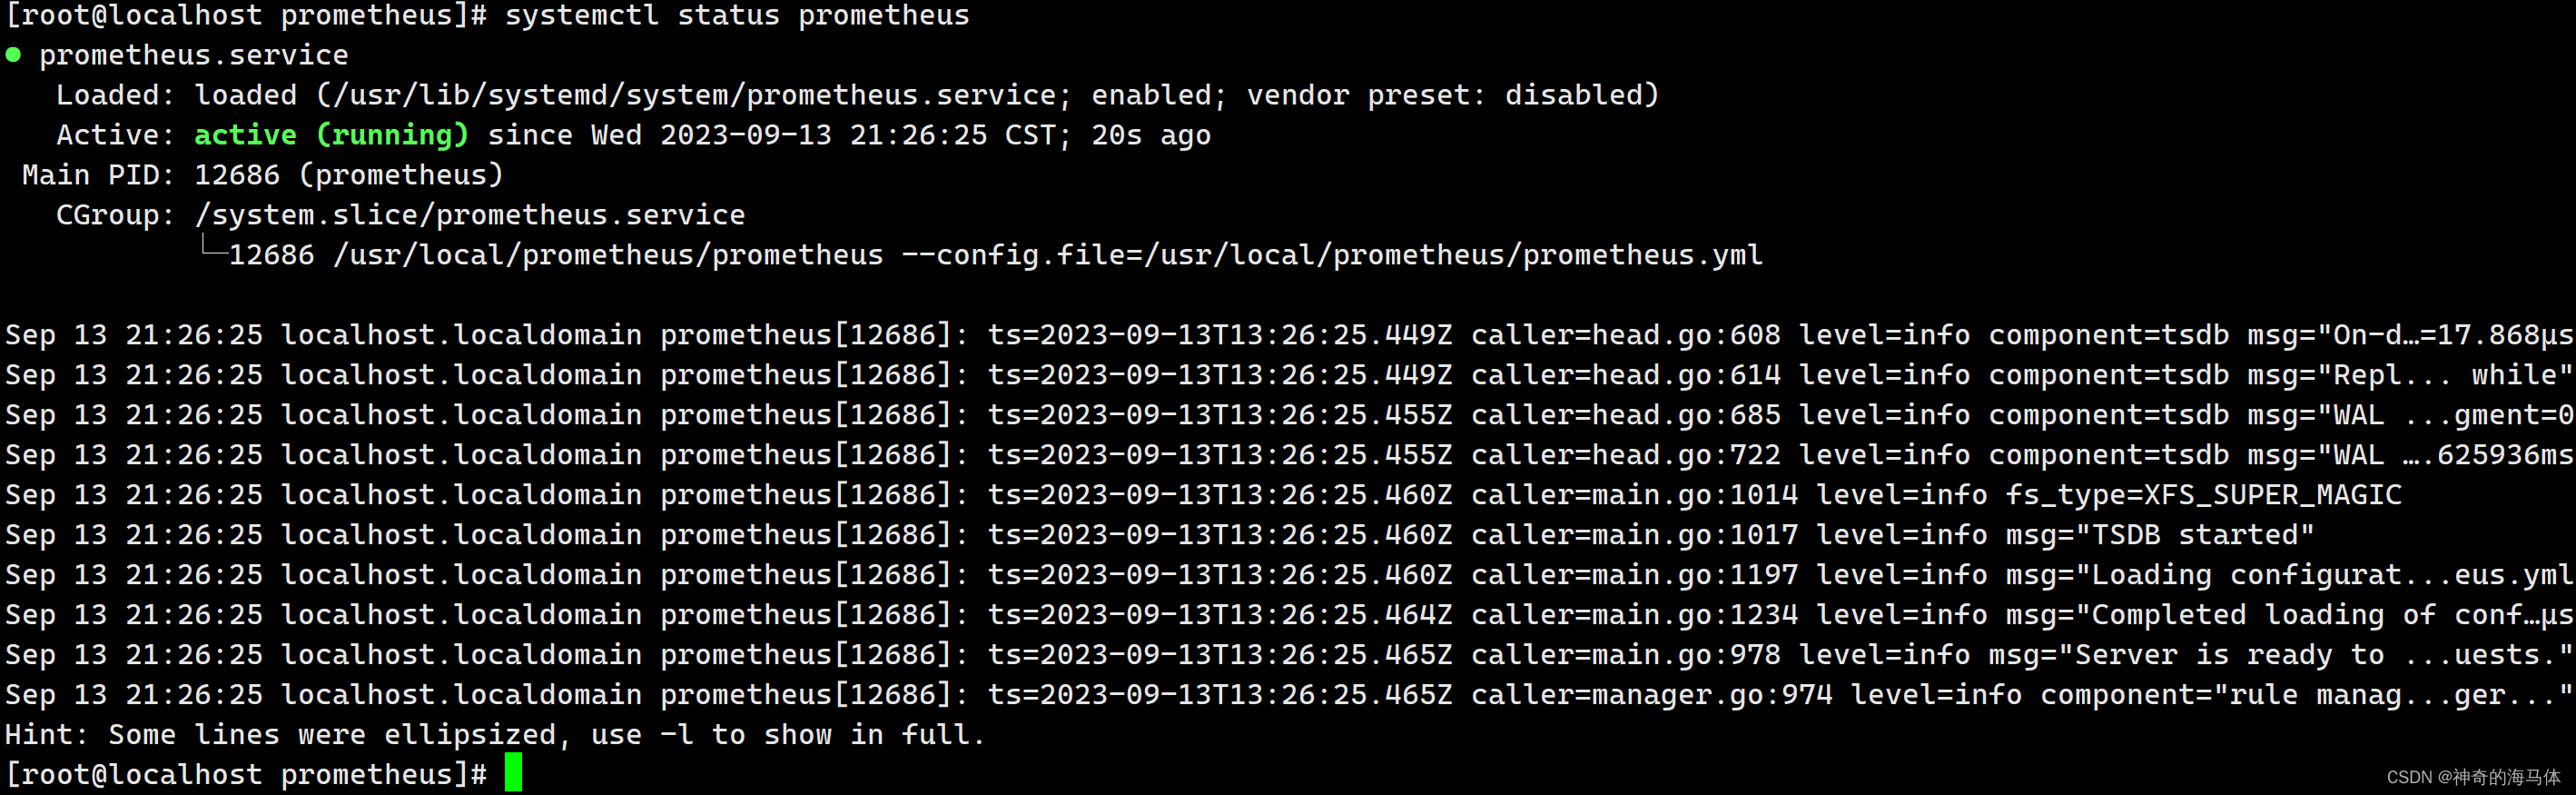
显示如上图,表示Prometheus也没问题了,默认端口是9090,我们可以浏览器访问一下
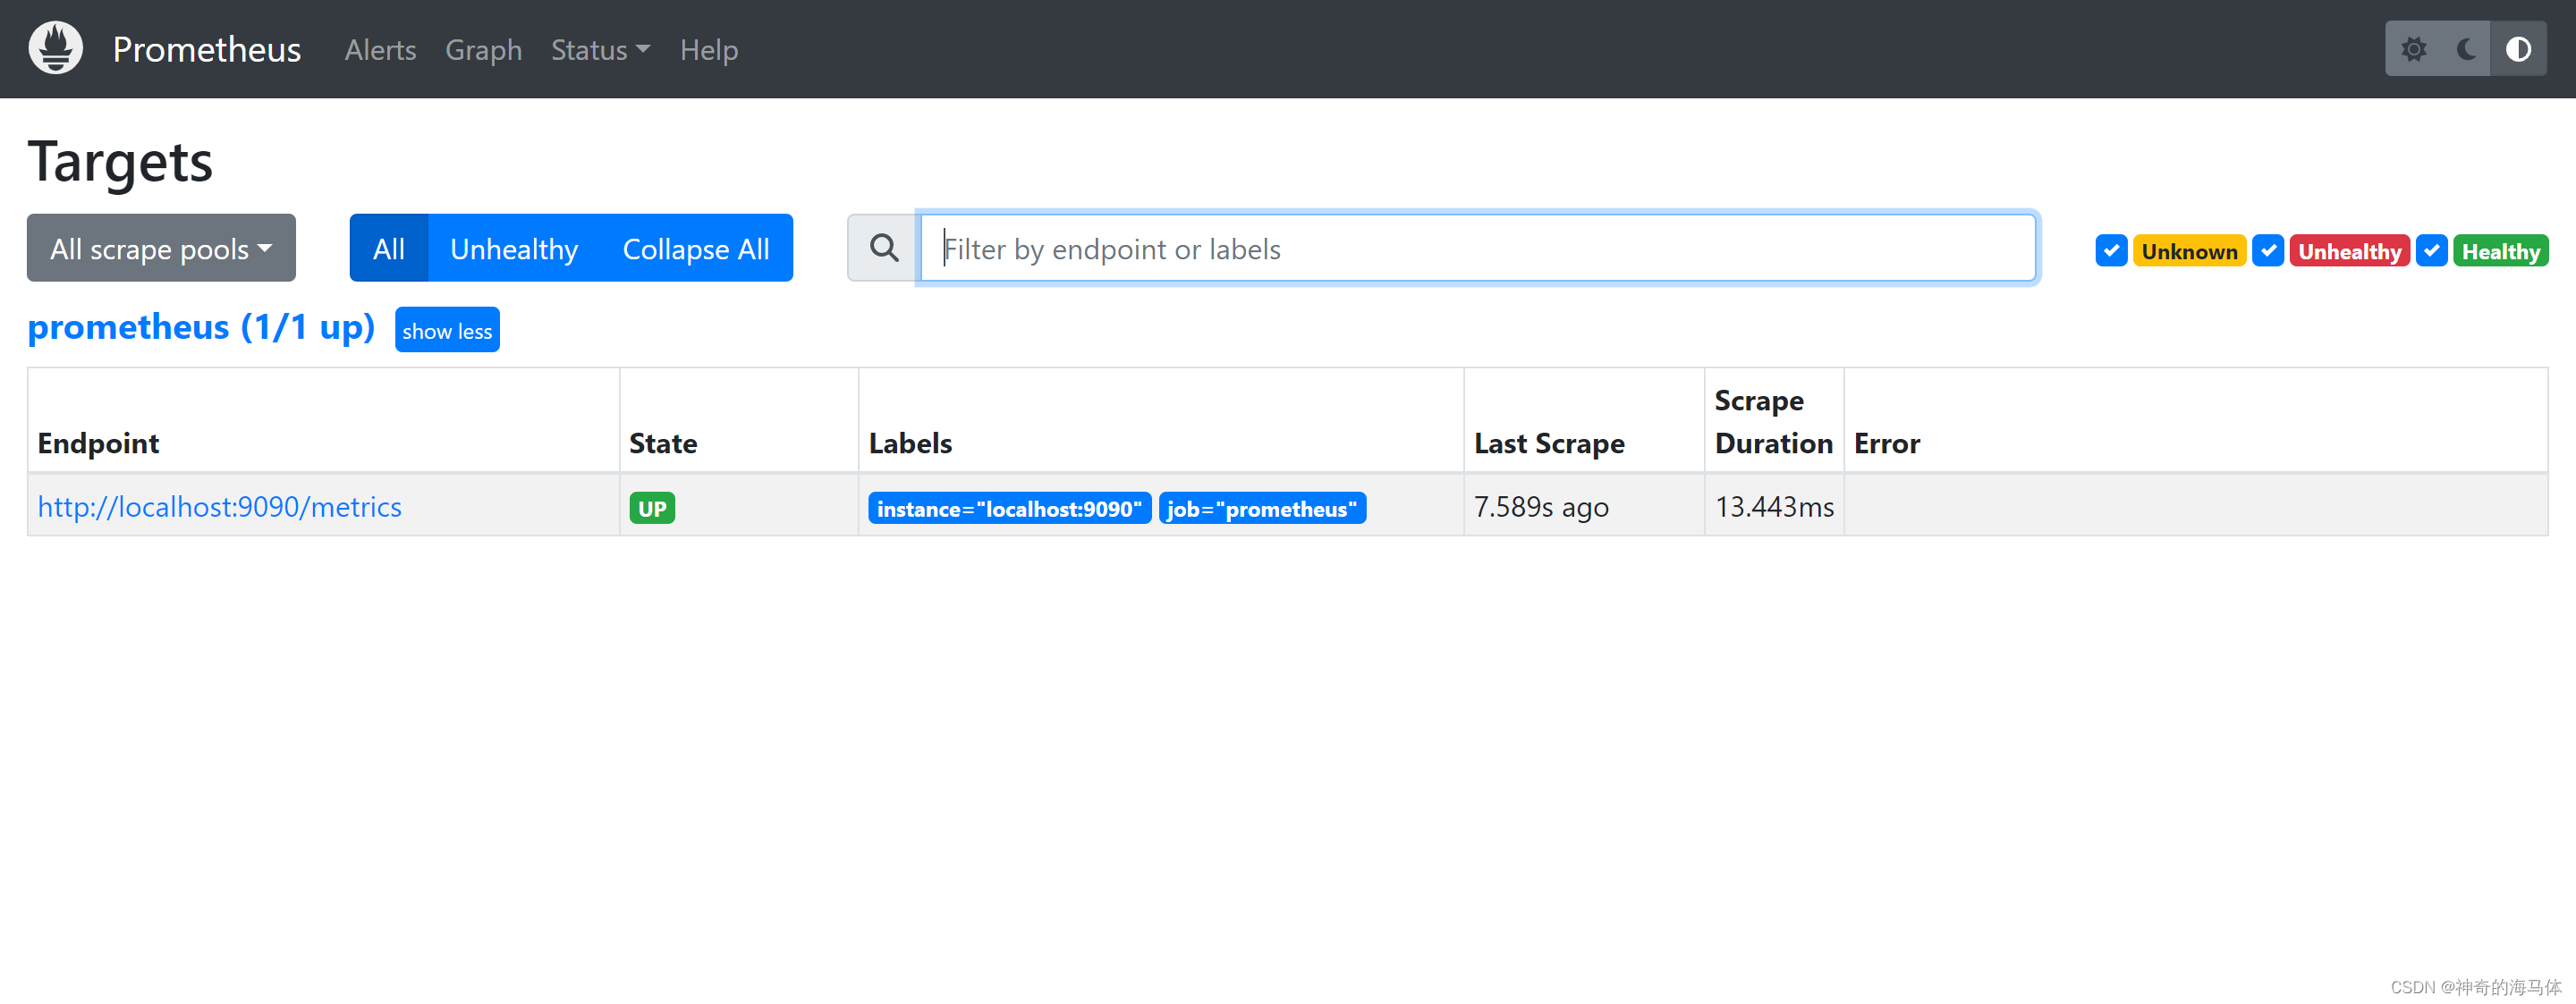
点击 Status > Targets 可以查看到Prometheus自己的metrics如下图:
四、安装Grafana
1、安装Grafana
wget https://dl.grafana.com/enterprise/release/grafana-enterprise-9.4.1-1.x86_64.rpm
sudo yum install grafana-enterprise-9.4.1-1.x86_64.rpm -y

systemctl enable grafana-server.service --now
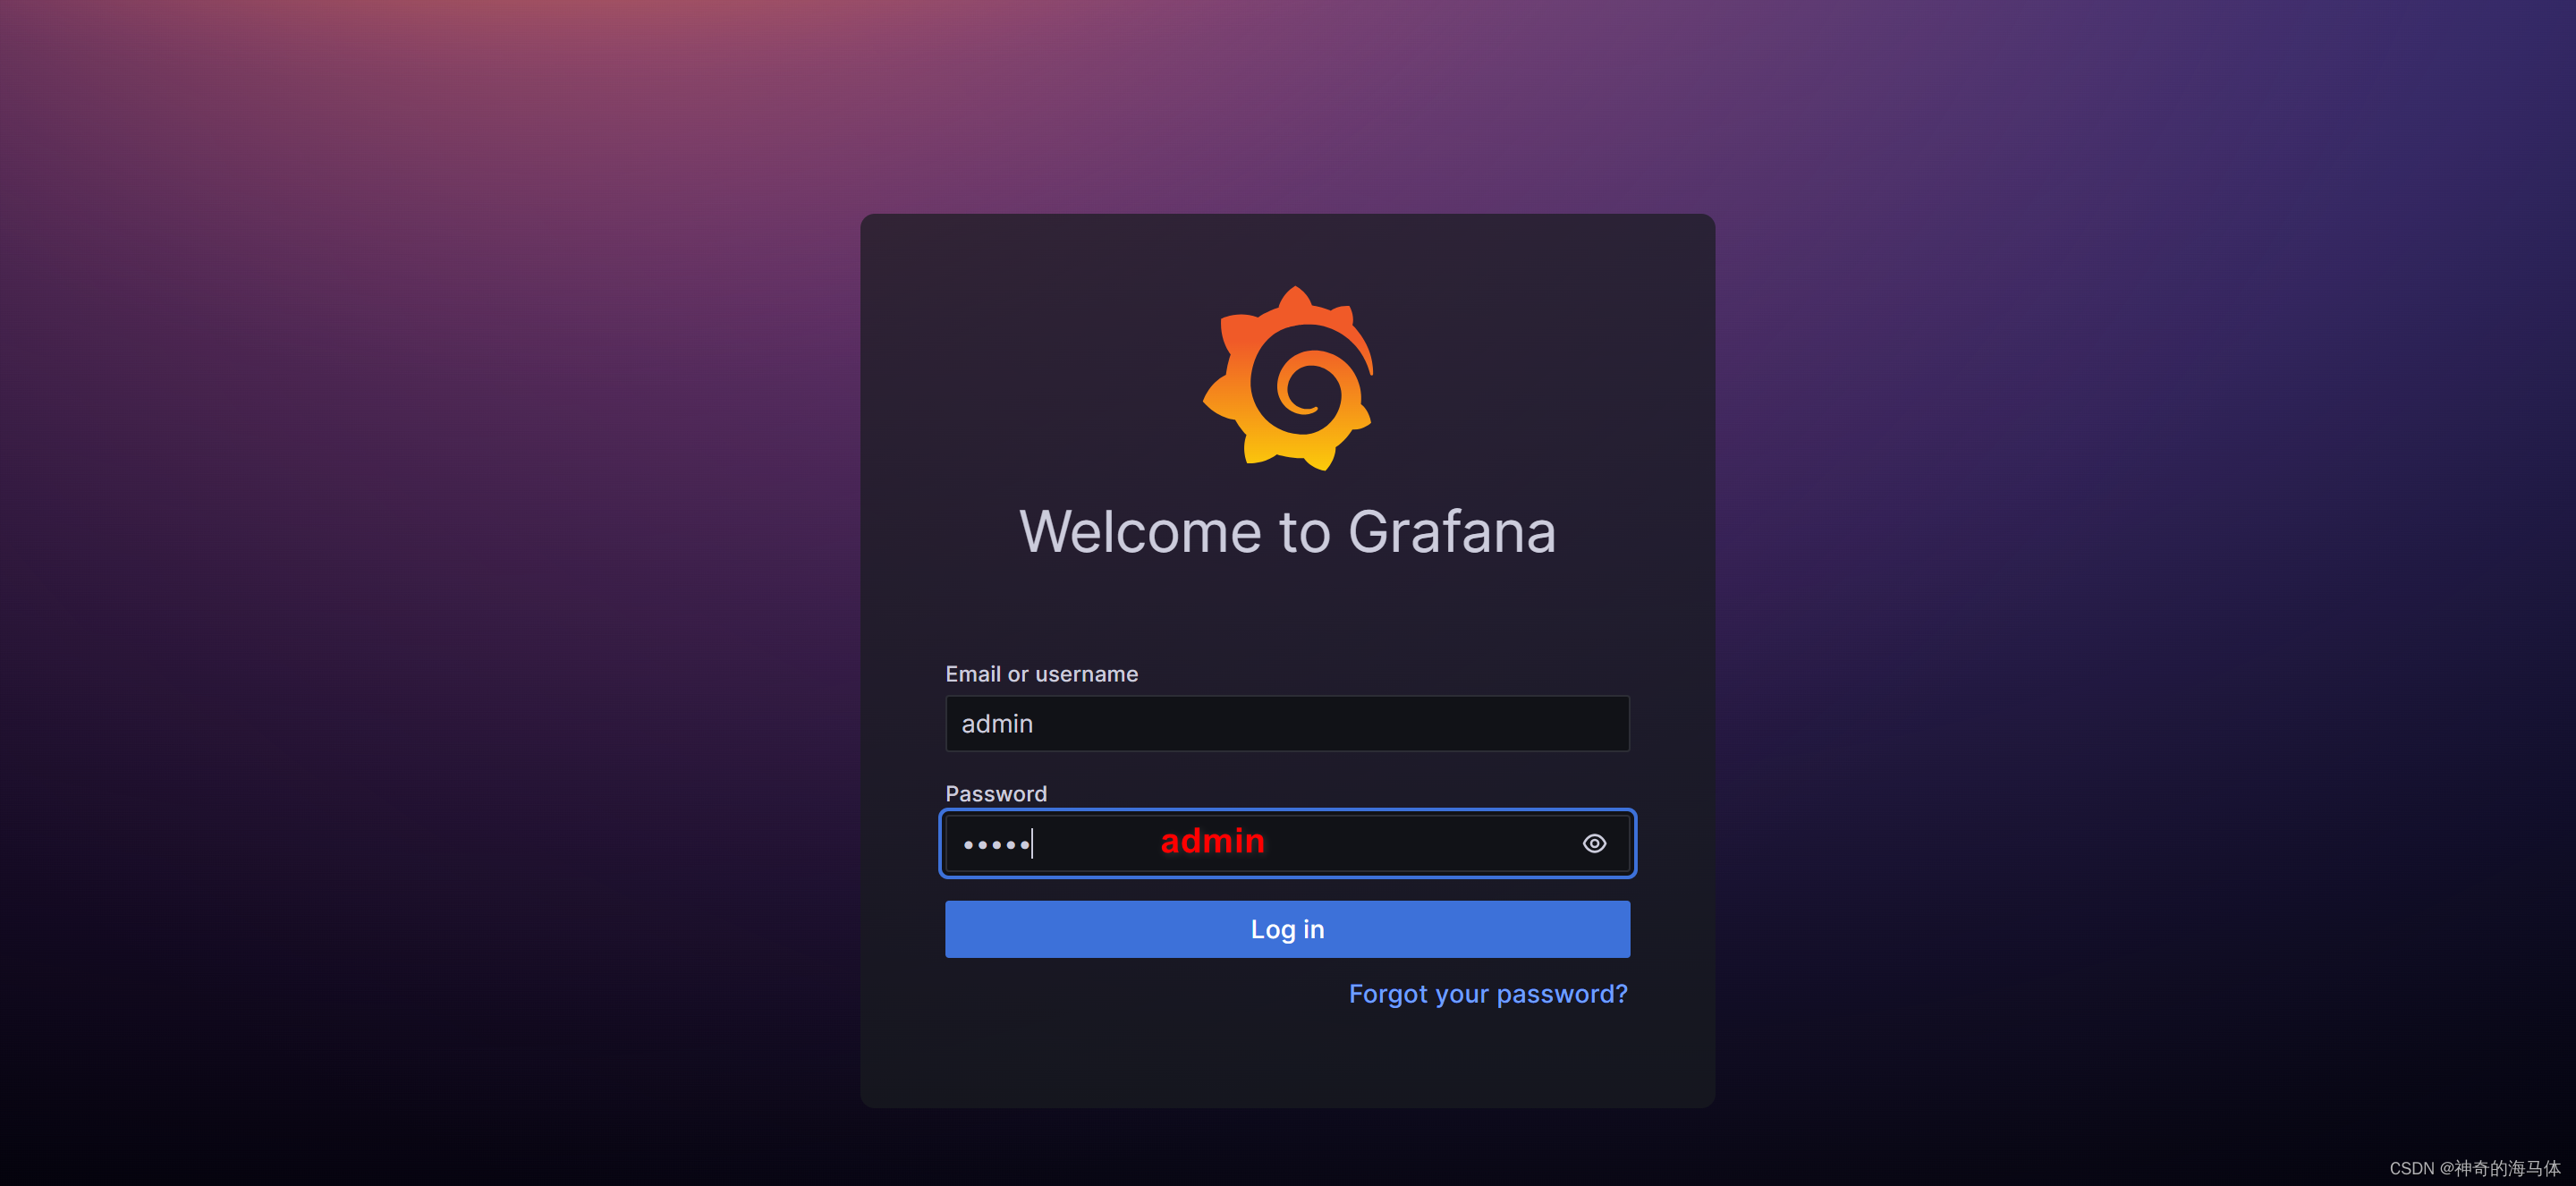
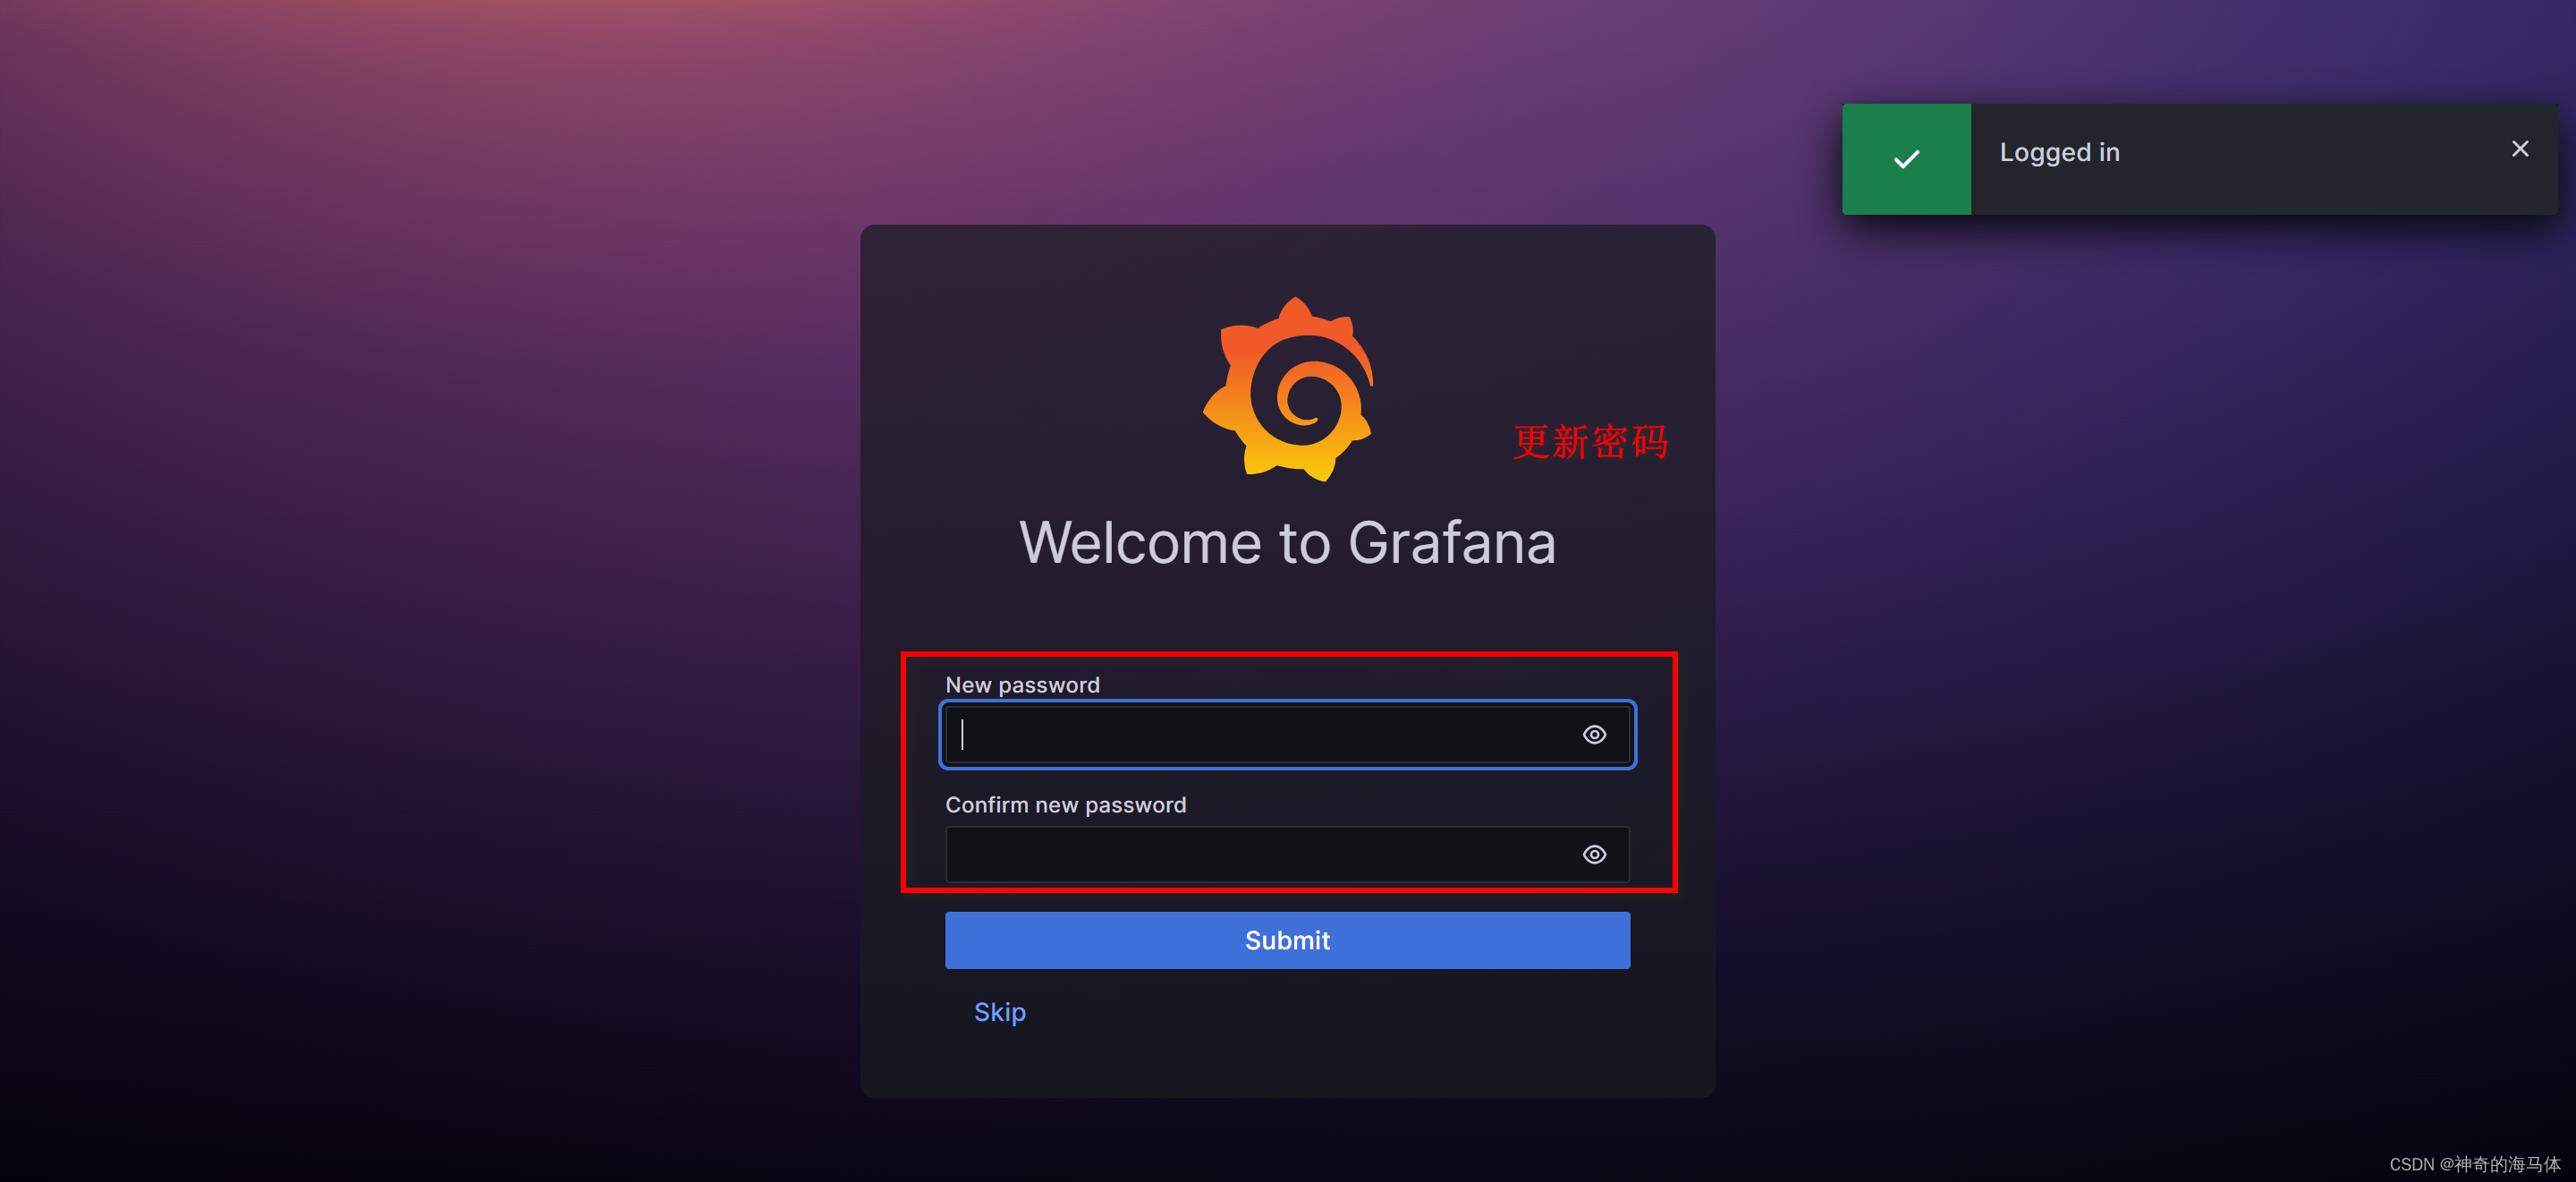
2、WEB页面验证
默认端口是3000,第一次访问会提示重新设置密码,如下图:
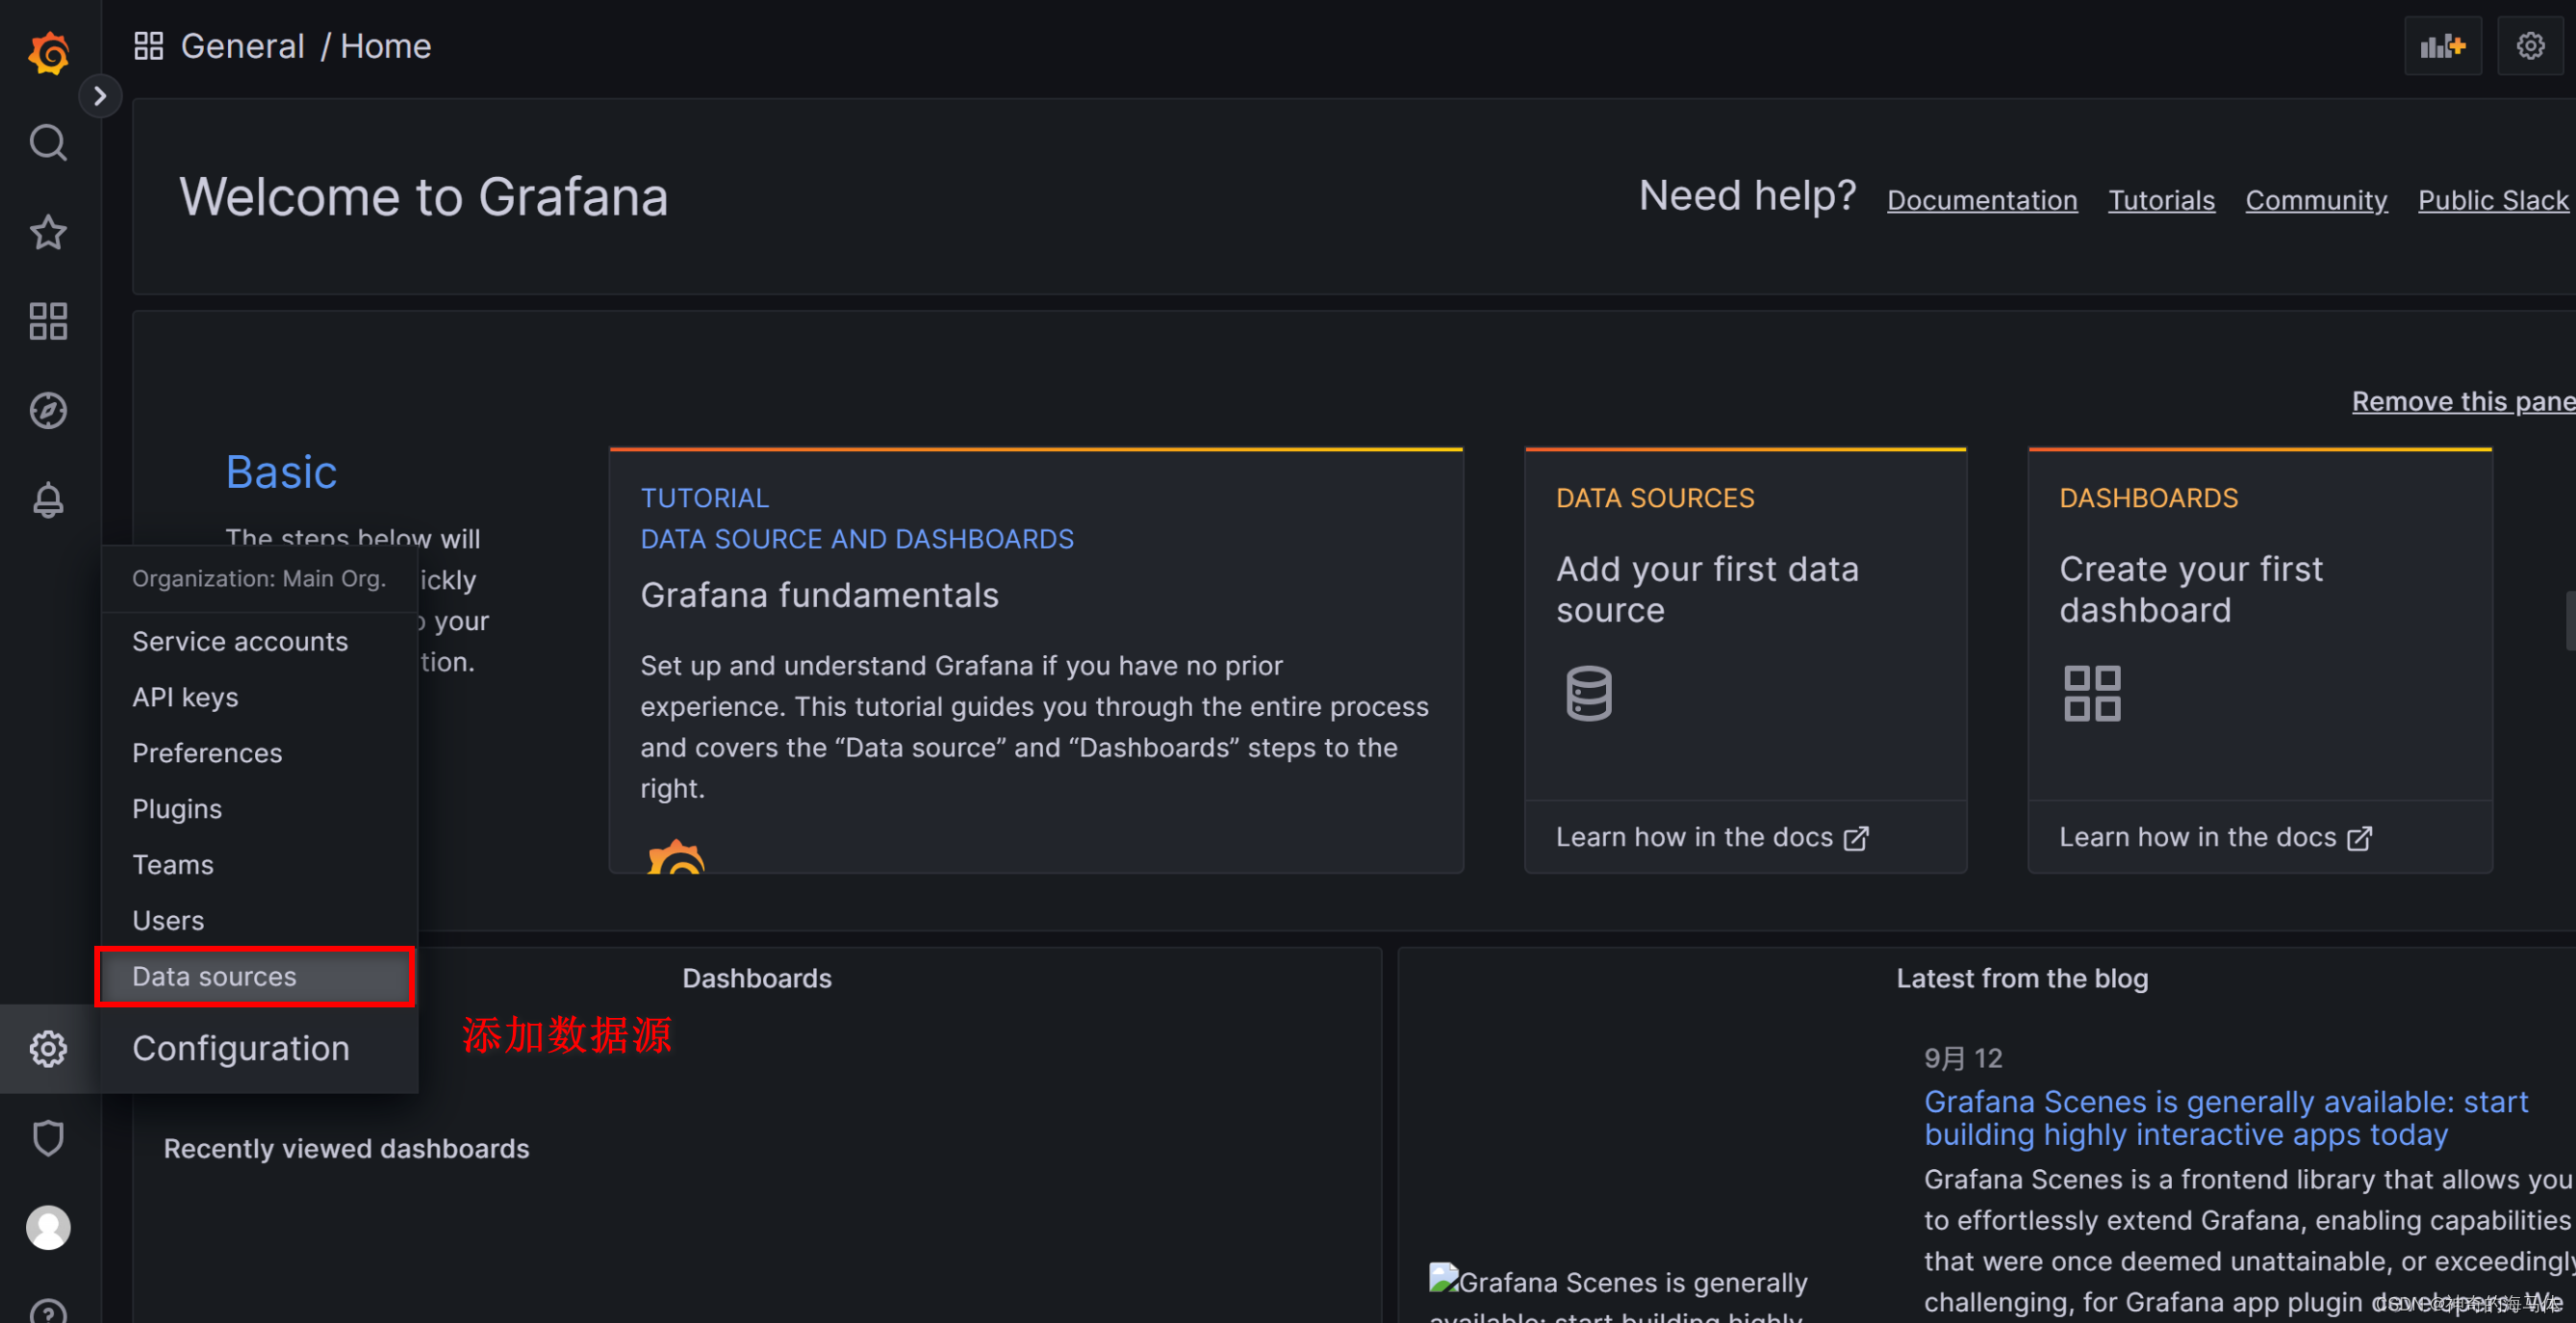
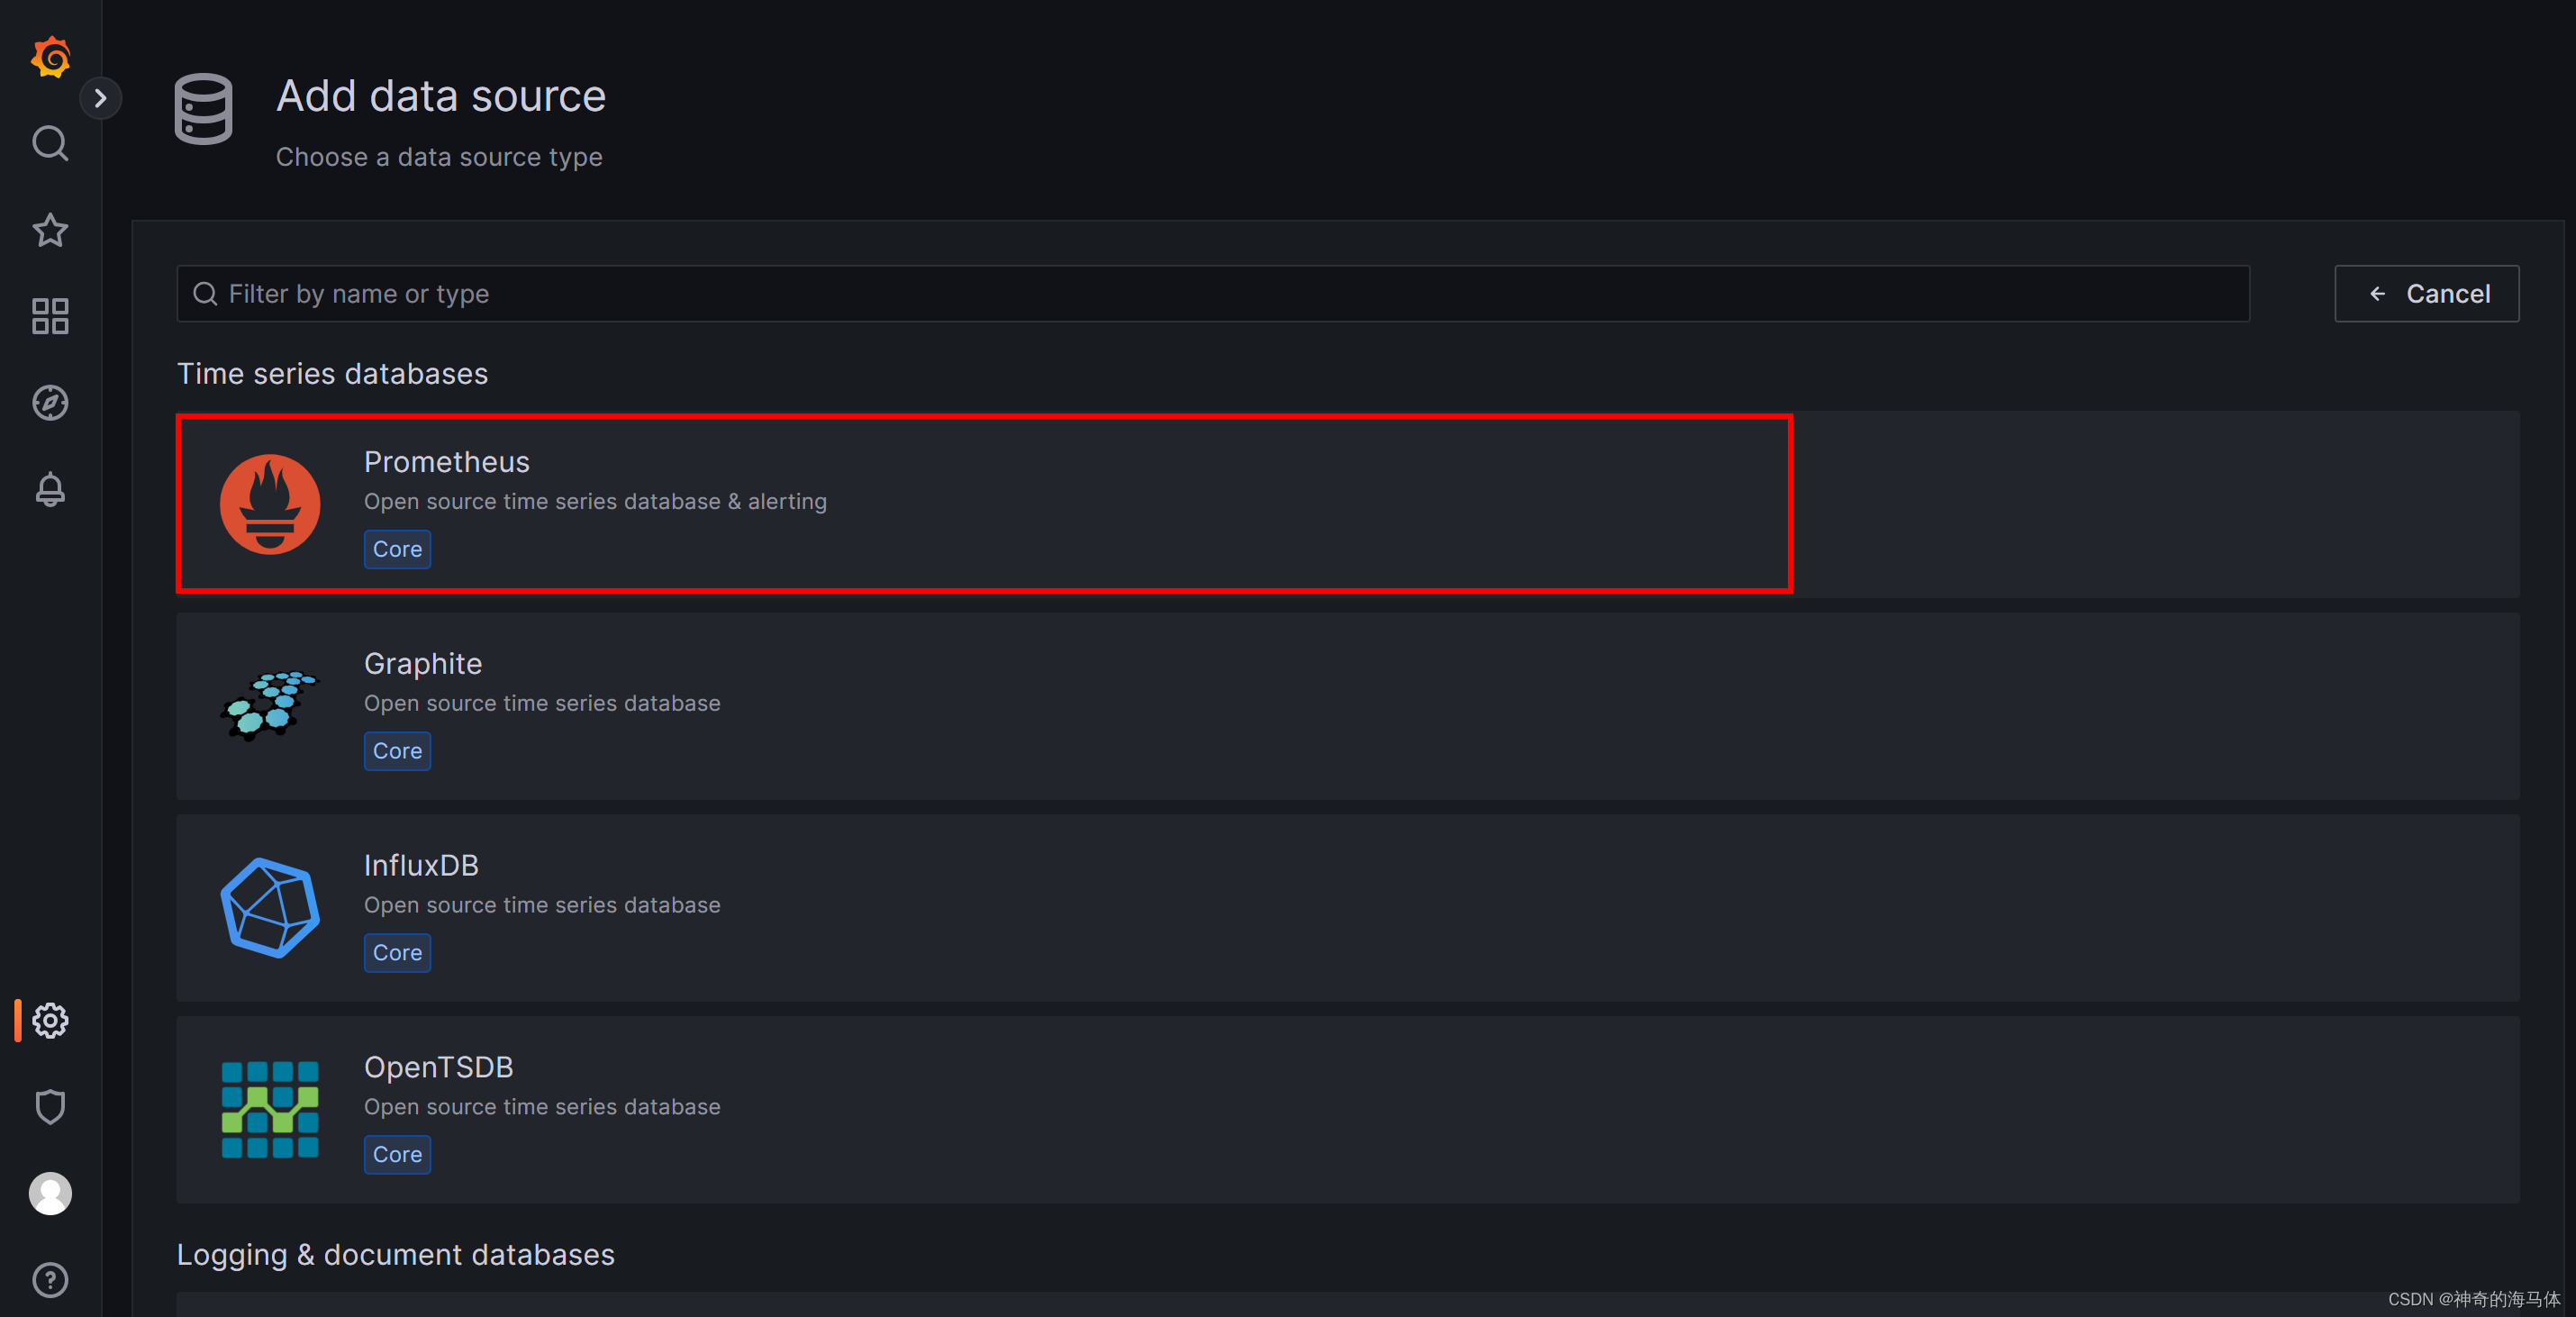
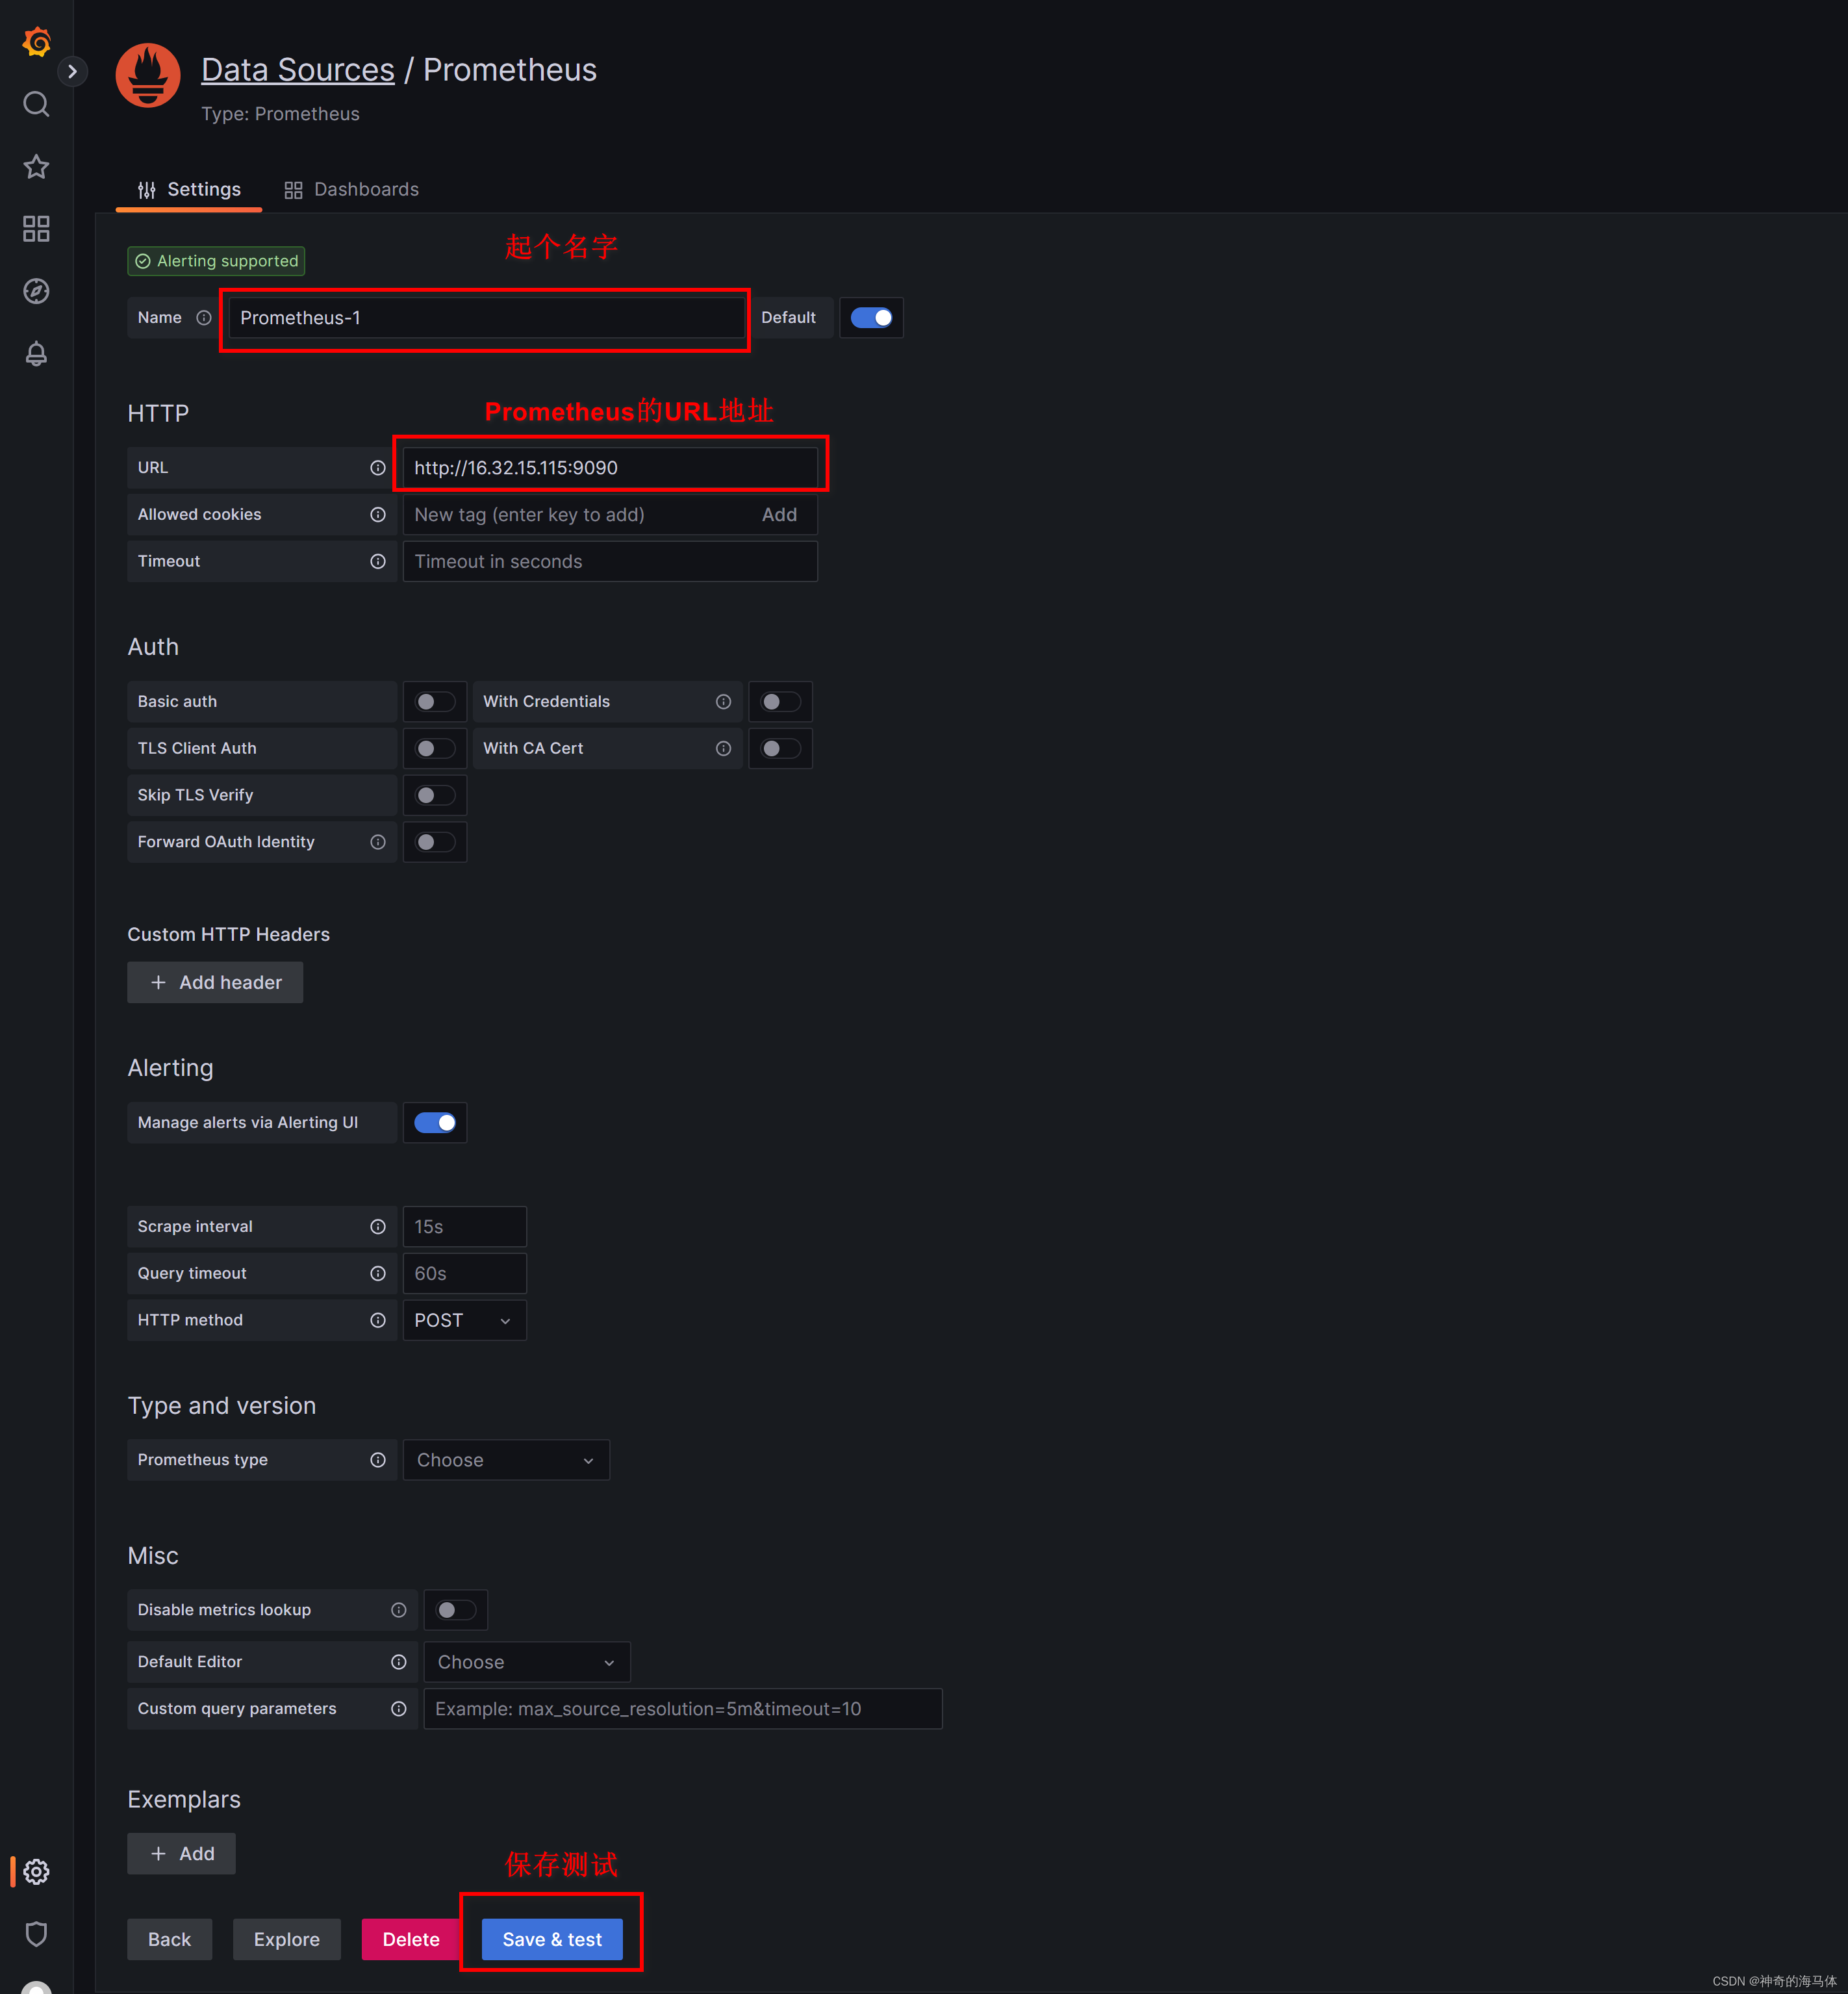
五、Pronetheus和Grafana相关联
六、安装elasticsearch_exporter
1、安装elasticsearch_exporter
wget https://github.com/prometheus-community/elasticsearch_exporter/releases/download/v1.3.0/elasticsearch_exporter-1.3.0.linux-amd64.tar.gz
tar zxf elasticsearch_exporter-1.3.0.linux-amd64.tar.gz
mv elasticsearch_exporter-1.3.0.linux-amd64 /usr/local/elasticsearch_exporter
2、配置systemd管理
注意: --es.uri参数设置自己的es访问地址,我这里是本机,我写的是http://127.0.0.1:9200
cat > /usr/lib/systemd/system/elasticsearch_exporter.service << EOF
[Unit]
Description=elasticsearch_exporter Service
After=network.target

[Service]
Type=simple
ExecStart=/usr/local/elasticsearch_exporter/elasticsearch_exporter  --es.all --es.indices --es.cluster_settings --es.indices_settings --es.shards --es.snapshots --es.uri http://127.0.0.1:9200
ExecReload=/bin/kill -HUP \$MAINPID
Restart=on-failure
RestartSec=30s

[Install]
WantedBy=multi-user.target
EOF
启动并加入开机自启动
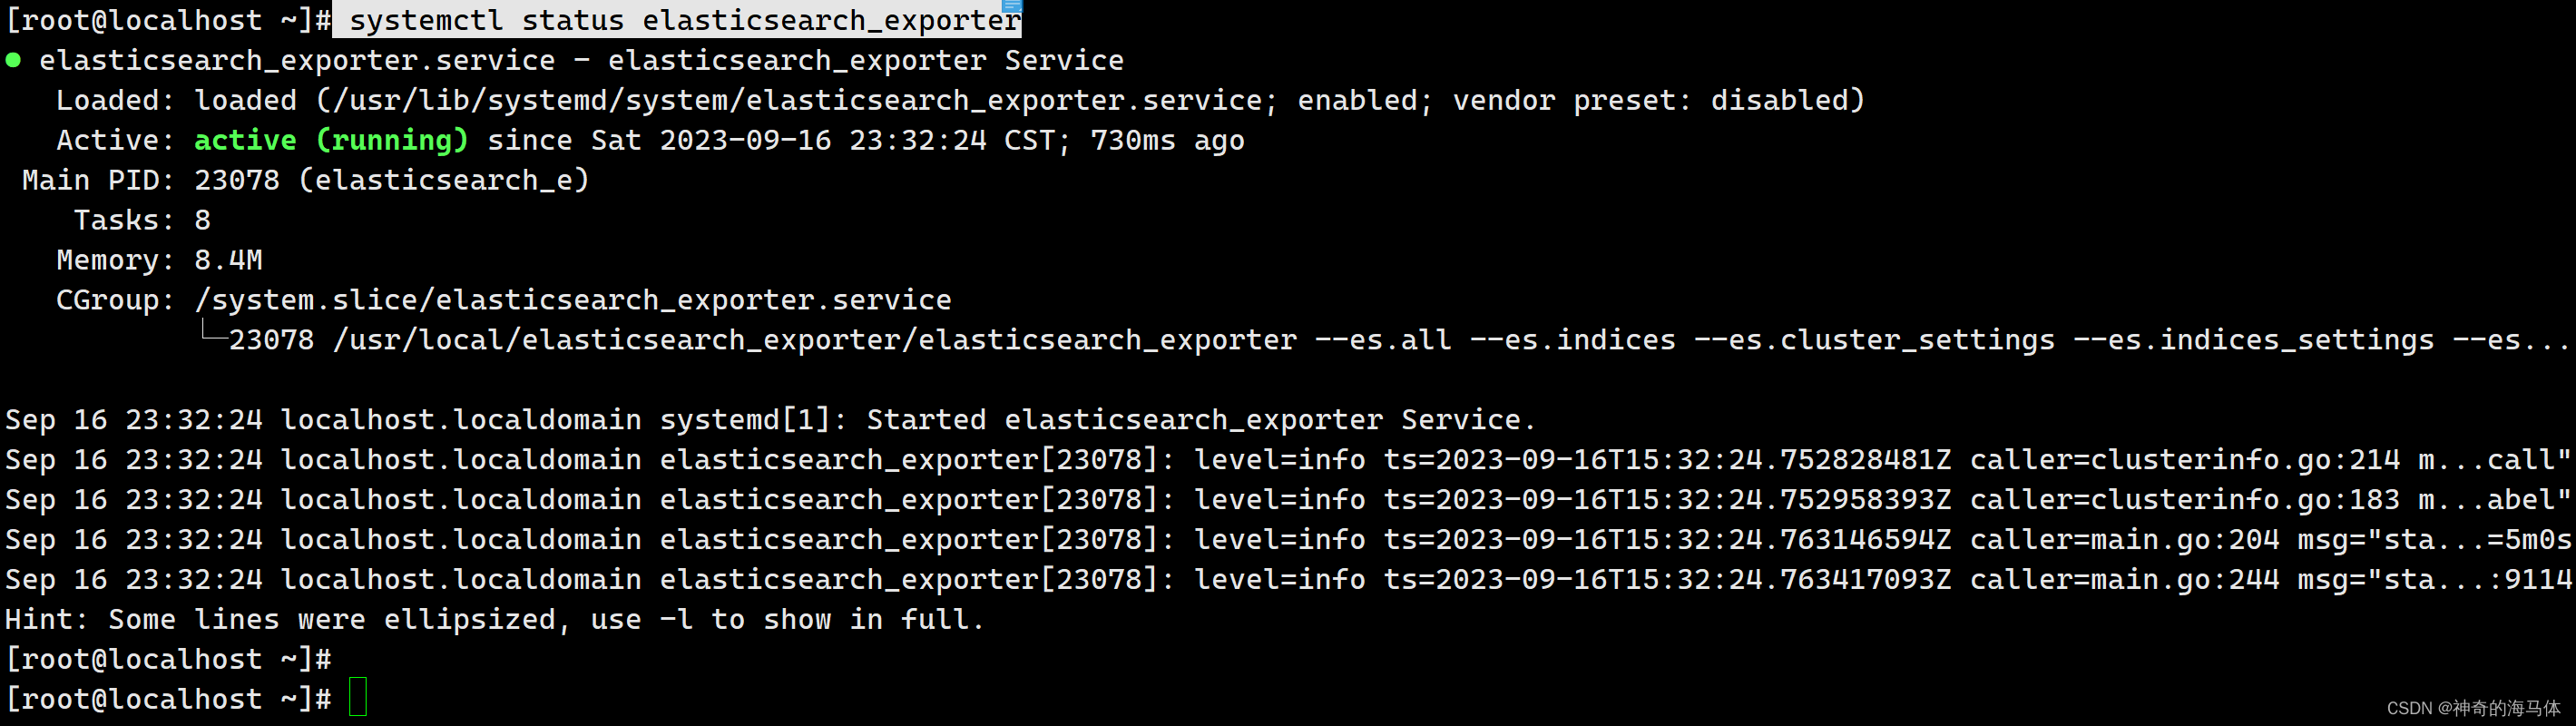
systemctl enable elasticsearch_exporter --now
systemctl status elasticsearch_exporter
默认端口为9114
netstat -anput |grep 9114
4、Prometheus配置文件中指定elasticsearch_exporter信息
vim /usr/local/prometheus/prometheus.yml

  - job_name: "ElasticSearch_115"
    static_configs:
      - targets: ["16.32.15.115:9114"]
添加完成配置文件后使用命令测试格式上是否有问题
cd  /usr/local/prometheus/
./promtool check config prometheus.yml
重启Prometheus
systemctl restart prometheus.service
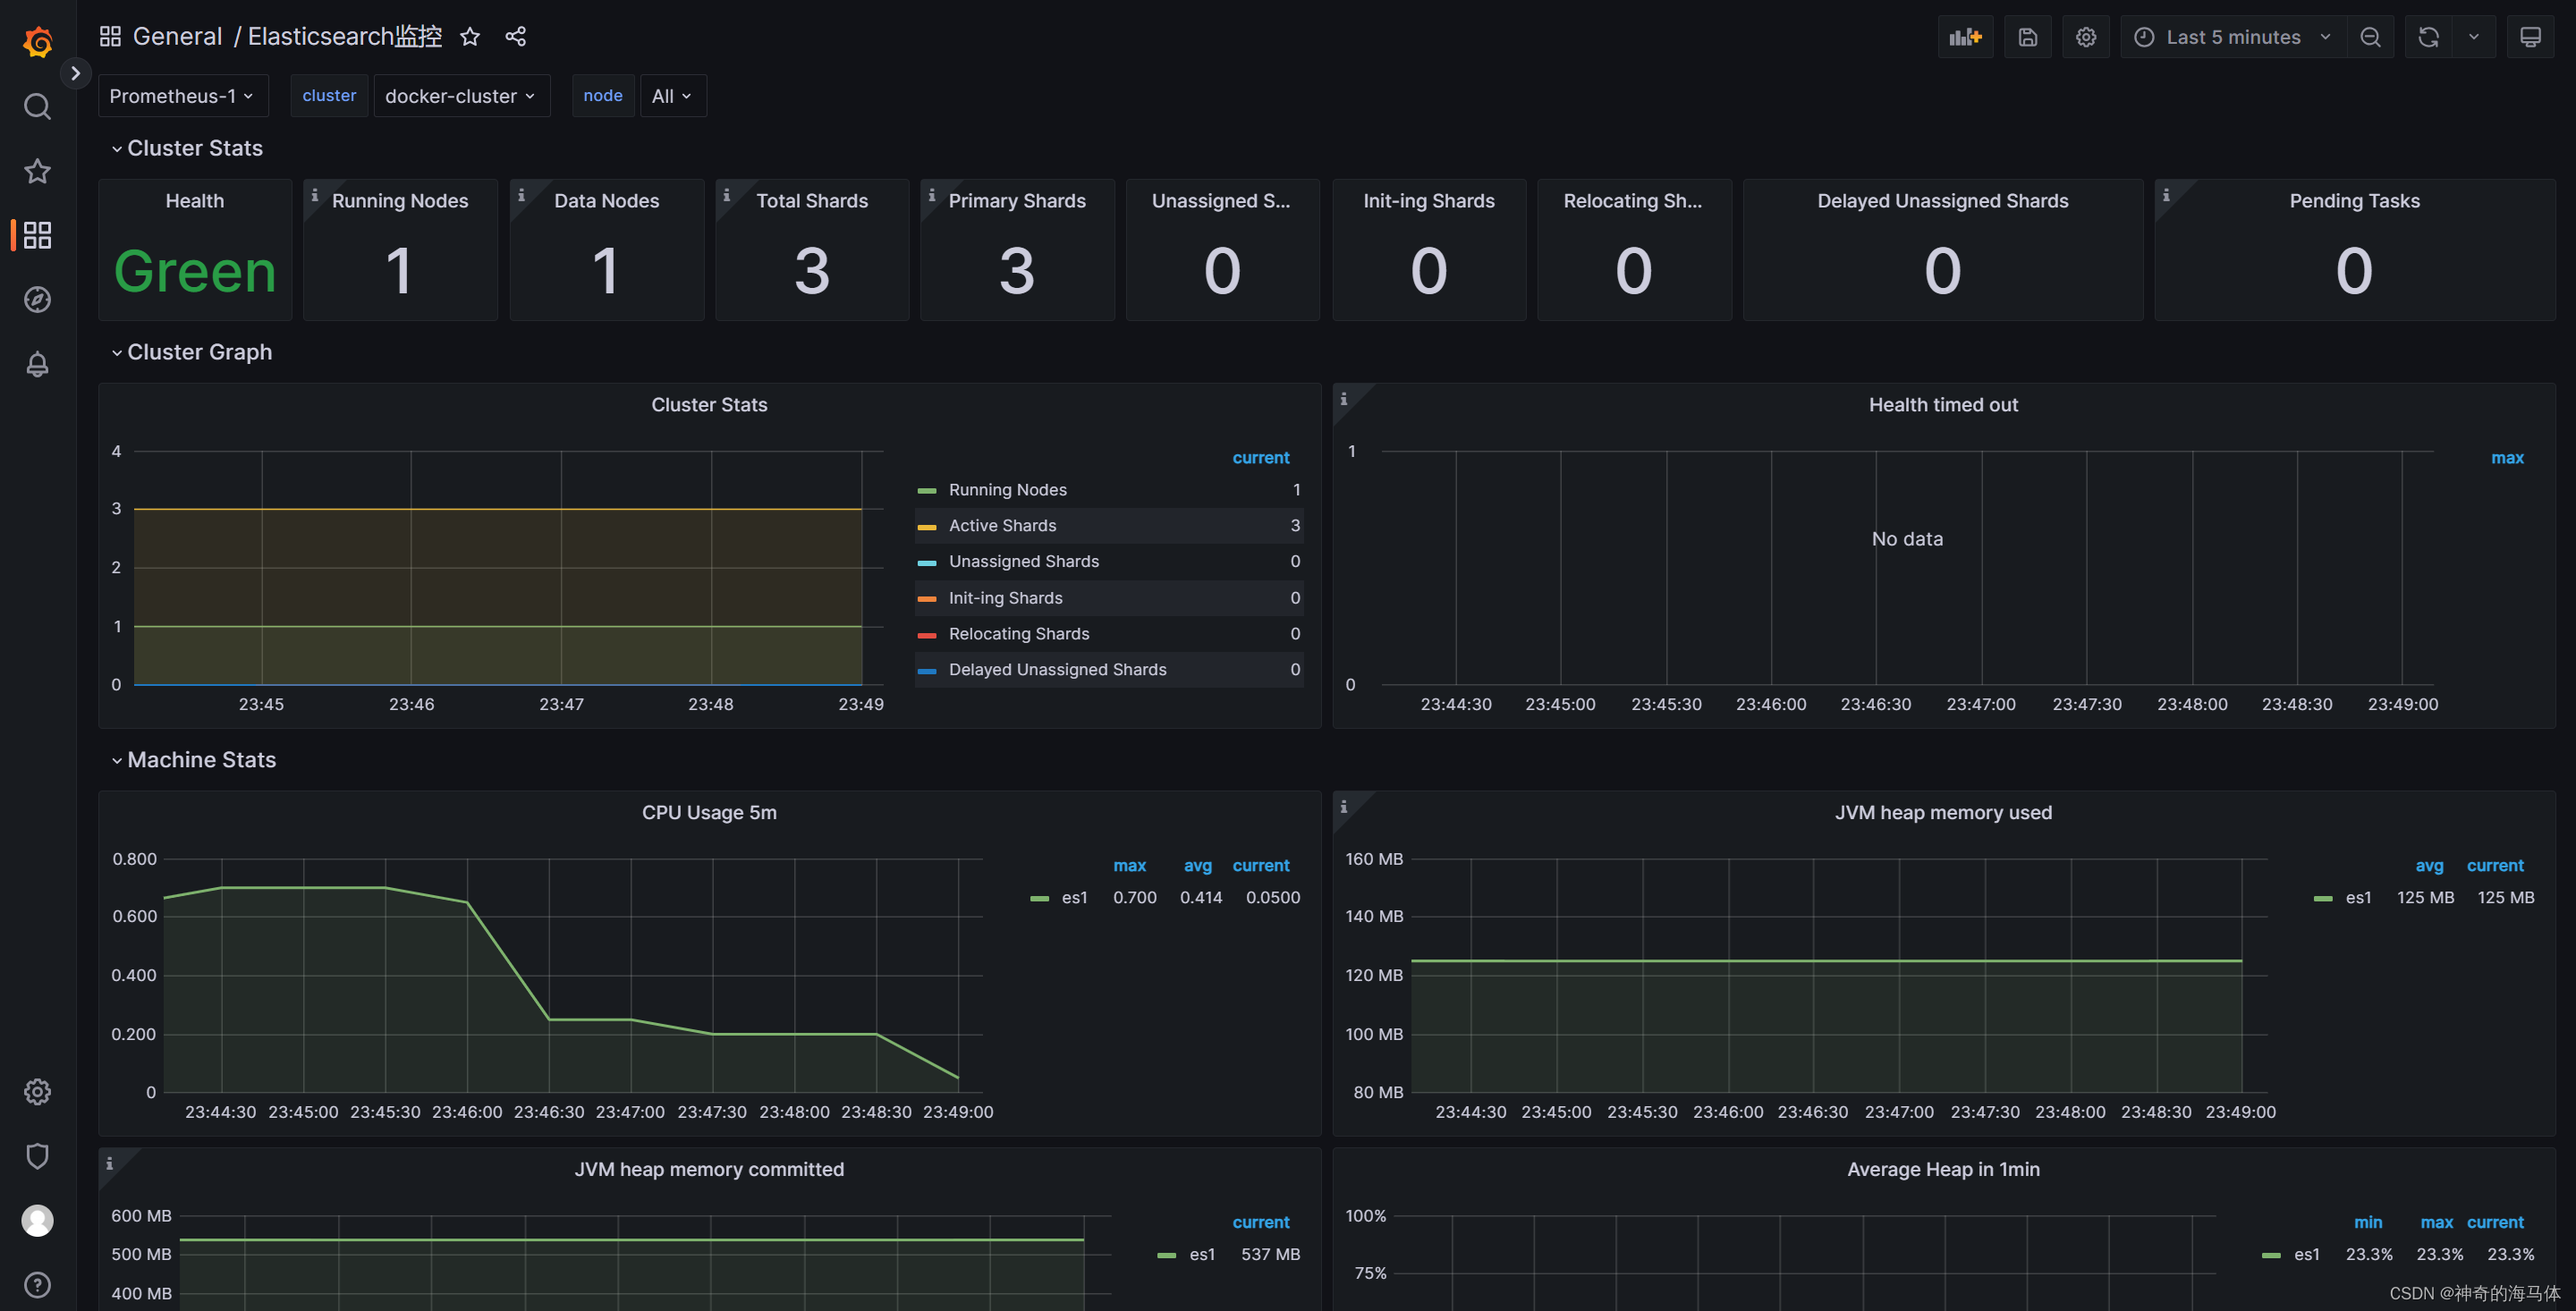
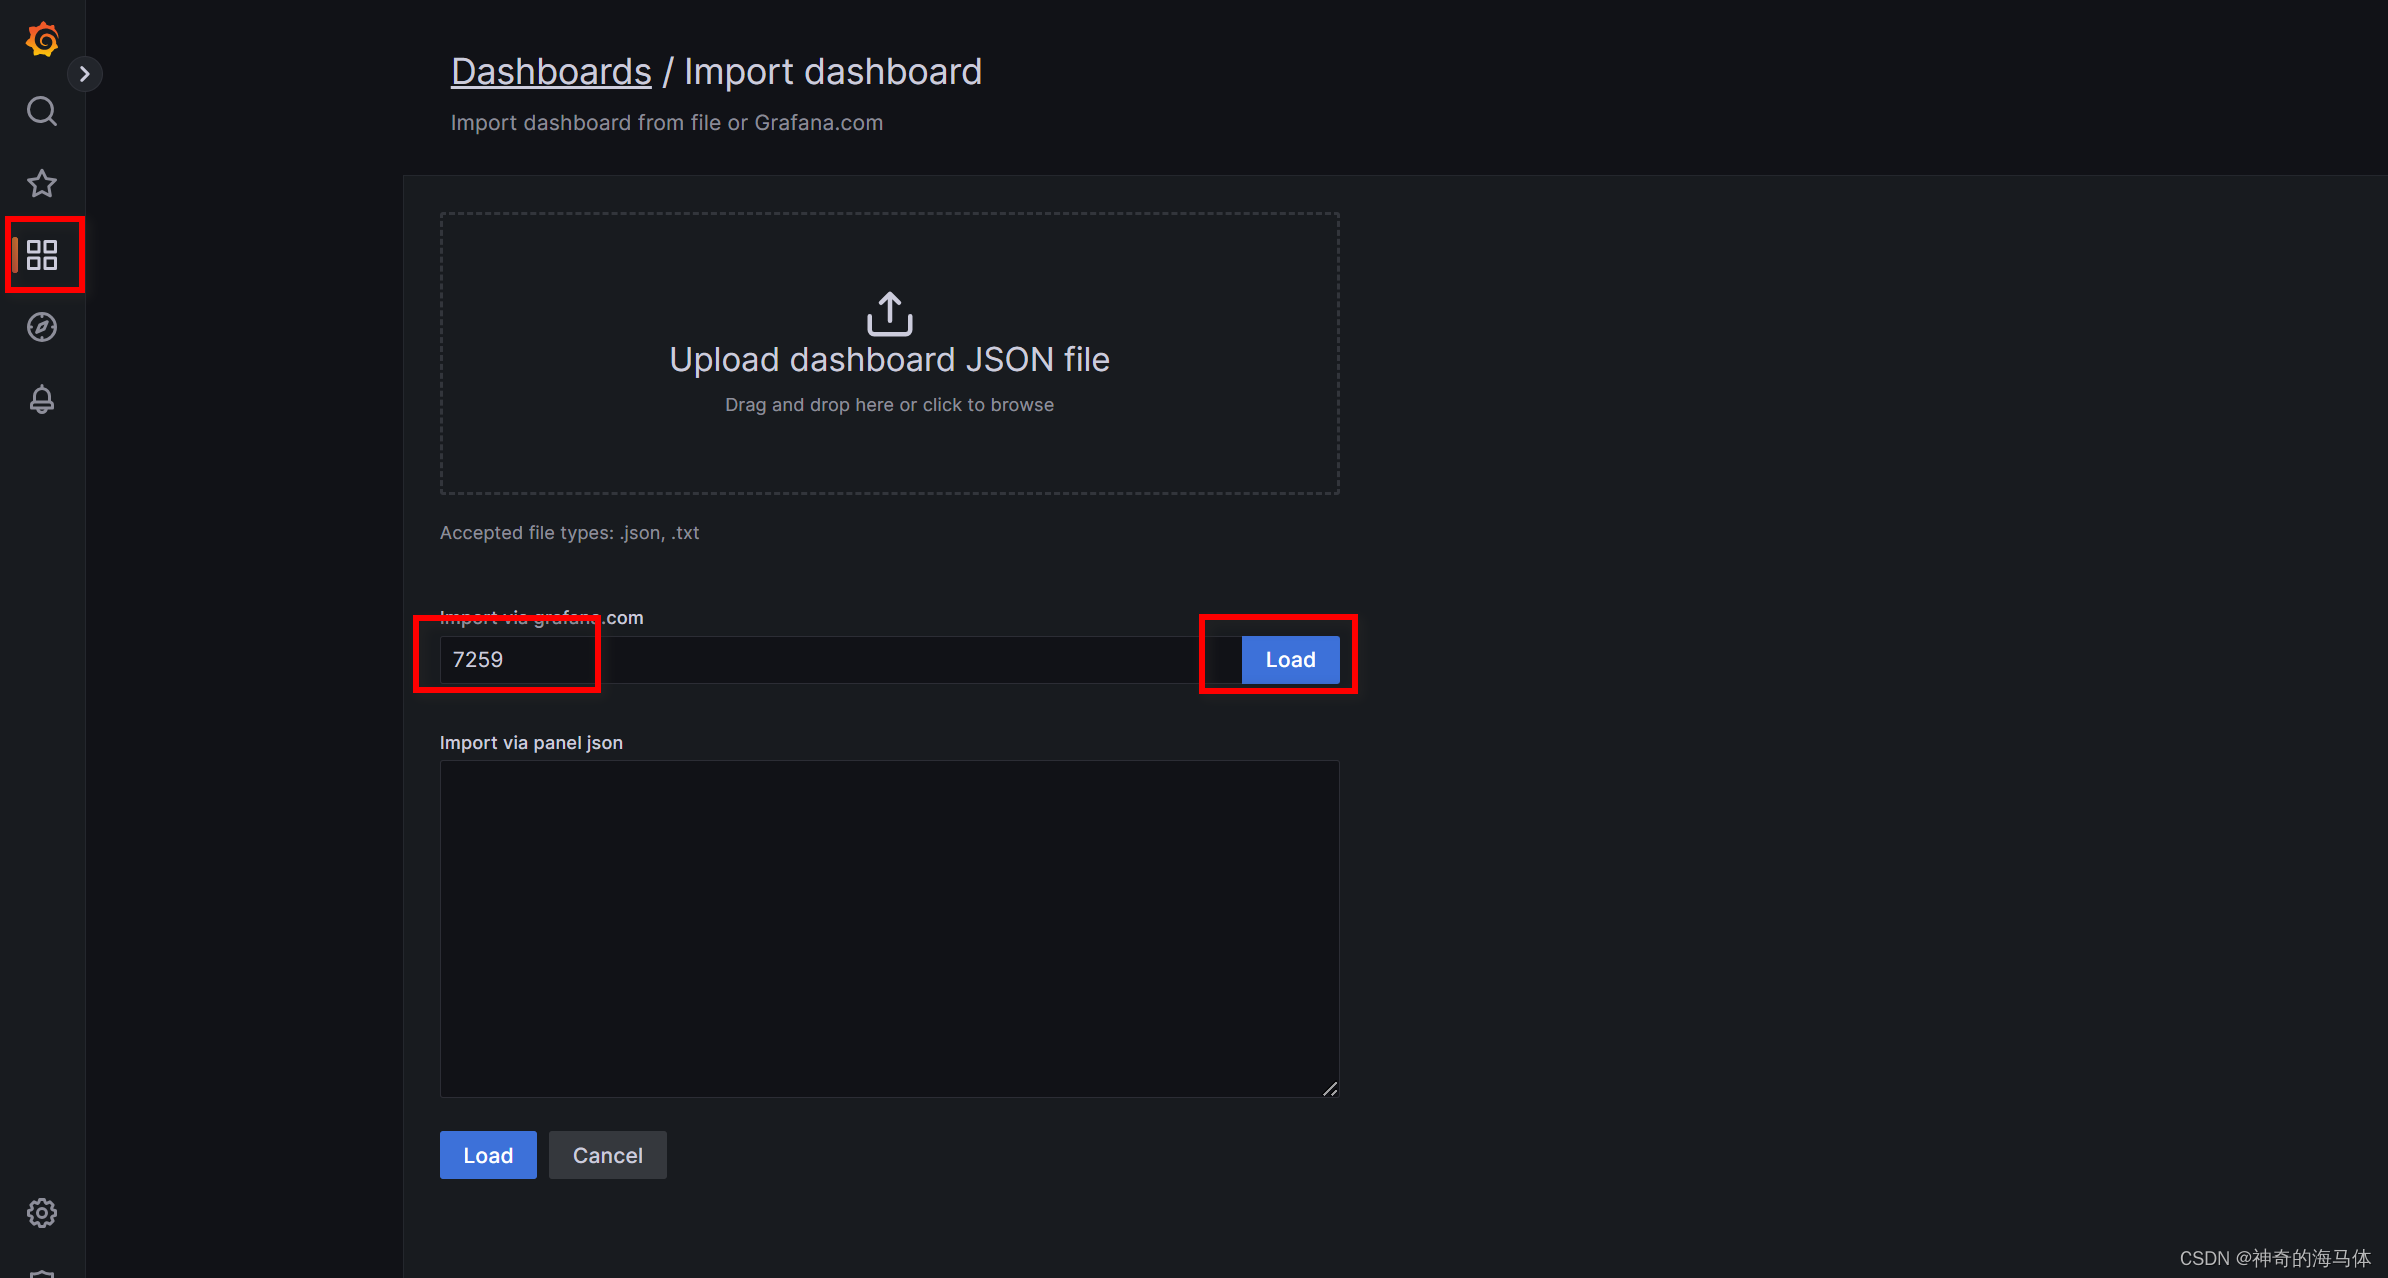
七、Grafana添加ElasticSearch监控模板
这里使用ElasticSearch的模板ID:7259
点击 下方红圈地方 > import > 输入模板ID
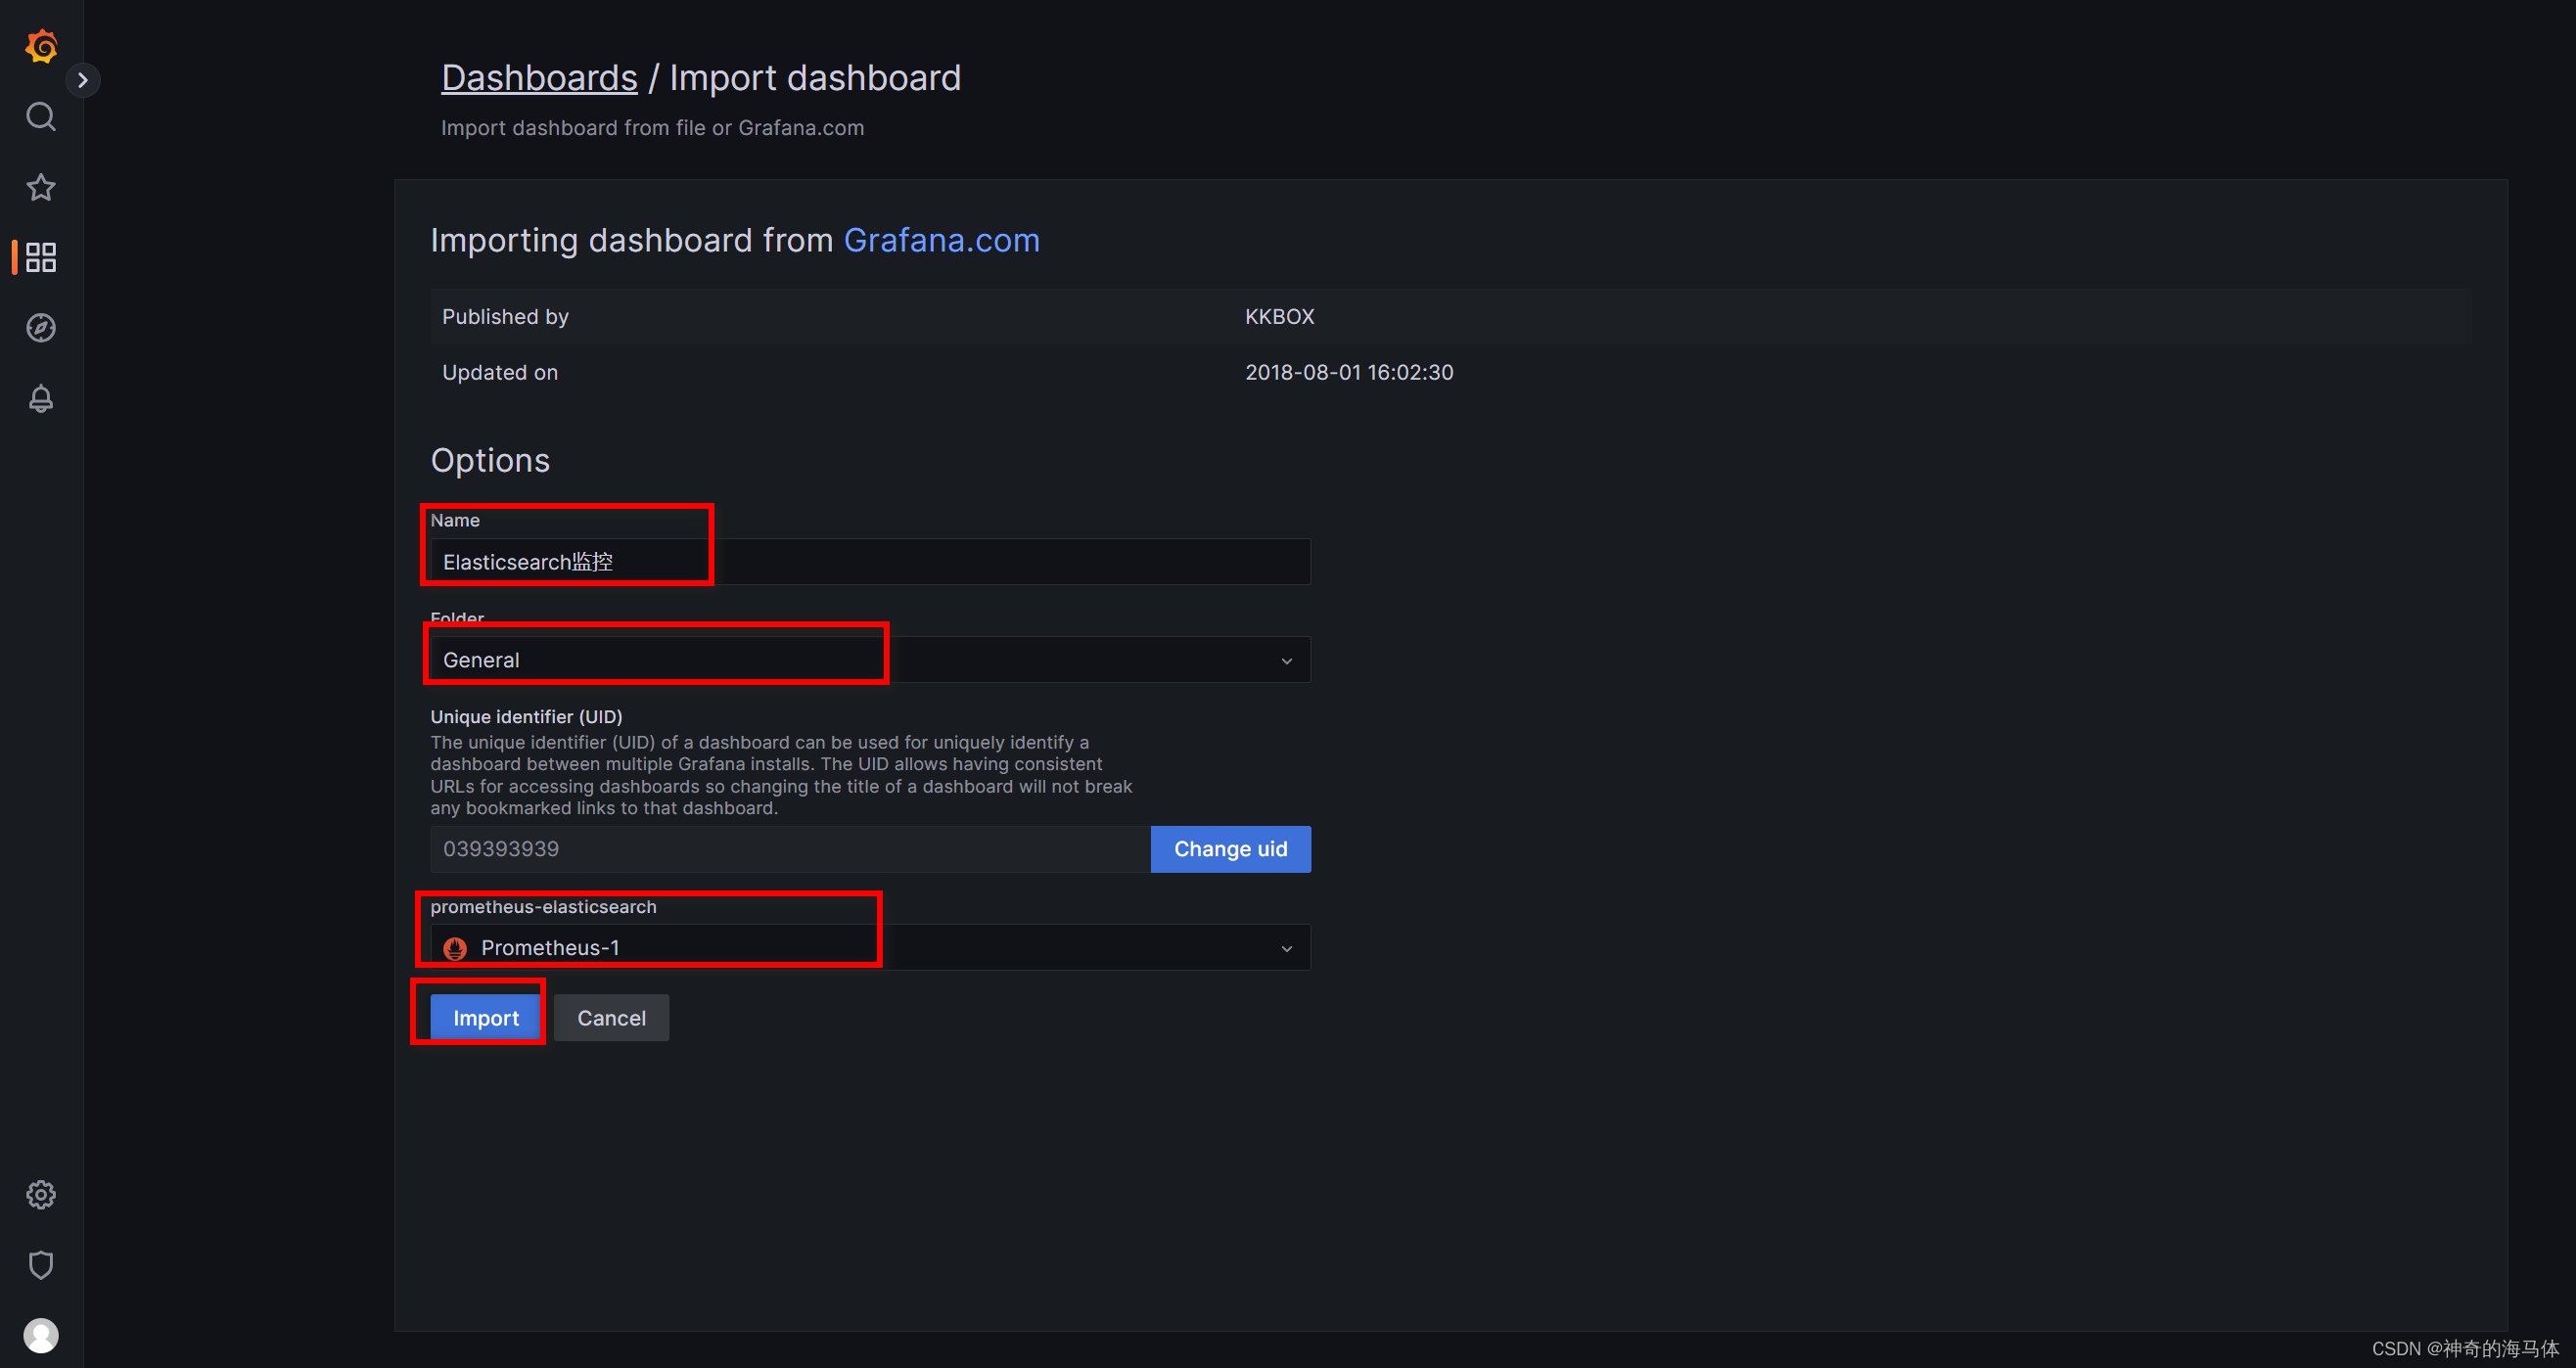
最终效果图如下: