一、简介
区域增长算法是一种用于图像分割方法,将相邻像素按照一定的相似性合并成一个区域。
步骤:
(1)初始化: 选择一个种子像素点(或多个种子点)作为起始点,将其标记为一个新的区域。
(2)生长准则: 定义生长准则,用于决定是否将相邻像素合并到当前区域。生长准则通常是基于像素的强度值、颜色、纹理等属性的相似性。如果相邻像素满足生长准则,它们将被合并到当前区域。
(3)生长过程: 从种子点开始,通过不断地检查相邻像素,根据生长准则逐步扩展区域。这可以使用递归、队列或堆栈等数据结构来实现。
(4)标记和分类: 对每个像素分配一个区域标签,以表示它属于哪个区域。这通常在生长过程中完成。
(5)终止条件: 定义何时停止生长。这可以是根据像素的属性、区域的大小、生长次数等来决定。
区域增长算法通常有一些可调参数,这些参数影响着算法的性能和结果。以下是一些常见的可调参数及其描述:
种子点(Seed Point):种子点是区域增长的起始位置。选择合适的种子点对于获取所需的区域非常重要。容忍度(Tolerance):容忍度(即相邻像素的范围)表示两个像素值之间的允许差异范围。容忍度值越大,允许的差异越大,区域增长范围就越广。容忍度值越小,增长的区域越接近种子点的像素值。连接条件(Connectivity):定义了哪些邻域像素被认为是连接的一部分。
在2D图像中:
(1)使用4连接(一个像素的邻域包括上下左右四个像素)
(2)使用8连接(一个像素的邻域包括上下左右四个像素以及四个对角线方向的像素)
在3D图像中:
(1)使用6连接(一个像素的邻域包括其上下左右前后六个相邻像素)
(2)使用26连接(一个像素的邻域包括其上下左右前后以及八个对角线方向的像素)最大连接区域大小(Max Region Size):限制区域增长的大小,以防止无限制地增长。像素相似度度量(Pixel Similarity Metric):决定了像素之间相似性的度量方式。通常是通过像素值之间的灰度差异来度量,但也可以使用其他度量方法。如:颜色相似度、纹理相似度等等。
二、项目实战
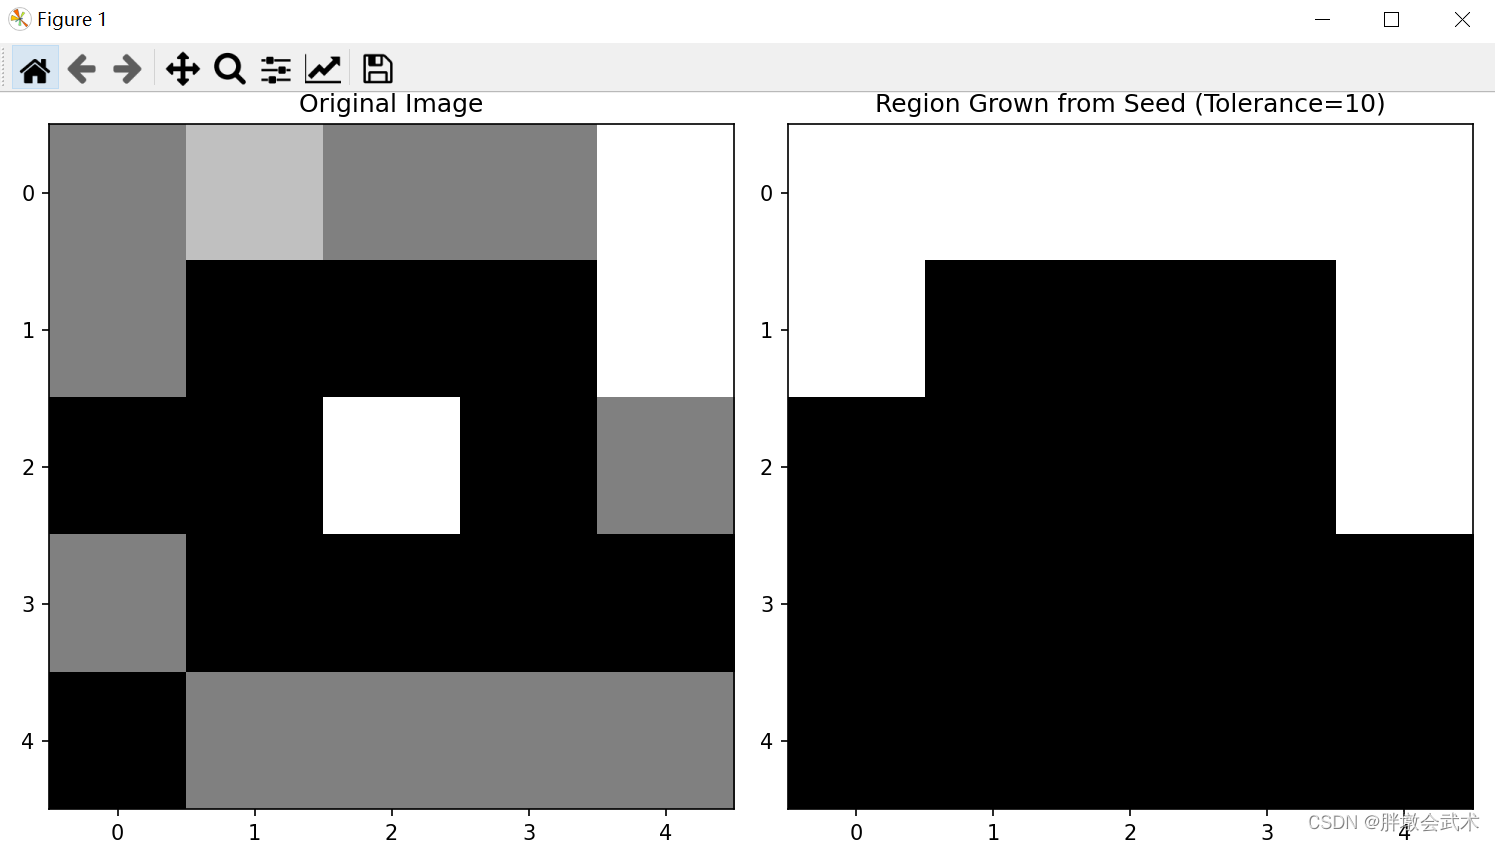
2.1、2D图像(10x10)
import numpy as np
import matplotlib.pyplot as plt

"""
区域增长算法:2D图像中的4连接条件 + 8连接条件
"""


def region_growing_4connect(image, seed, tolerance=1, max_region_size=None):
    """在2D图像中,4连接条件"""
    region = np.zeros_like(image, dtype=bool)
    height, width = image.shape
    stack = [(seed[0], seed[1])]

    while stack:
        y, x = stack.pop()
        if not (0 <= x < width and 0 <= y < height):
            continue
        if region[y, x]:
            continue
        if max_region_size is not None and np.sum(region) >= max_region_size:
            continue
        ###########################################################################
        """
        若添加该条件:其会将多个被独立区域完全分割,导致区域增长无法与周边独立区域进行连接。
        若取消该条件:则将两个独立区域连接的同时,中间的黑色区域也会同时连接。

        备注:当像素值与背景值差异越小则影响越大,反之差异越大则影响越小。
        备注:被黑色包围的区域认定为 "独立区域"
        备注:区域增长最终结果必定是一个独立的整体
        """
        if image[y, x] == 0:  # 如果当前像素值为0(不连接黑色块),则跳过
            continue
        ###########################################################################
        if abs(image[seed[0], seed[1]] - image[y, x]) <= tolerance:
            region[y, x] = 1
            stack.extend([(y - 1, x), (y + 1, x), (y, x - 1), (y, x + 1)])

    return region


def region_growing_8connect(image, seed, tolerance=1, max_region_size=None):
    """在2D图像中,8连接条件"""
    region = np.zeros_like(image, dtype=bool)
    height, width = image.shape
    stack = [(seed[0], seed[1])]

    while stack:
        y, x = stack.pop()
        if not (0 <= x < width and 0 <= y < height):
            continue
        if region[y, x]:
            continue
        if max_region_size is not None and np.sum(region) >= max_region_size:
            continue
        ###########################################################################
        """
        若添加该条件:其会将多个被独立区域完全分割,导致区域增长无法与周边独立区域进行连接。
        若取消该条件:则将两个独立区域连接的同时,中间的黑色区域也会同时连接。

        备注:当像素值与背景值差异越小则影响越大,反之差异越大则影响越小。
        备注:被黑色包围的区域认定为 "独立区域"
        备注:区域增长最终结果必定是一个独立的整体
        """
        if image[y, x] == 0:  # 如果当前像素值为0(不连接黑色块),则跳过
            continue
        ###########################################################################
        if abs(image[seed[0], seed[1]] - image[y, x]) <= tolerance:
            region[y, x] = 1
            stack.extend([(y - 1, x), (y + 1, x), (y, x - 1), (y, x + 1),
                          (y - 1, x - 1), (y - 1, x + 1), (y + 1, x - 1), (y + 1, x + 1)])

    return region


if __name__ == "__main__":

    # (1)灰度图像数据
    image = np.array([[2, 3, 2, 2, 4],
                      [2, 0, 0, 0, 4],
                      [0, 0, 4, 0, 2],
                      [2, 0, 0, 0, 0],
                      [0, 2, 2, 2, 2]])

    # (2)选择种子点并执行区域增长
    seed_point = (0, 0)  # 选择3D种子点
    tolerance_value = 2  # 设置容忍度,即相邻像素的范围
    max_region_size = 25  # 设置最大区域大小
    connect_condition = 4  # 设置连接条件
    result_region = region_growing_4connect(image, seed_point, tolerance=tolerance_value, max_region_size=max_region_size)

    # (3)可视化显示3D原始图像和区域增长的结果(按像素值进行可视化)
    plt.figure(figsize=(10, 5))
    plt.subplot(1, 2, 1)
    plt.imshow(image, cmap='gray', origin='upper')
    plt.title('Original Image')
    plt.subplot(1, 2, 2)
    plt.imshow(result_region, cmap='gray', origin='upper')
    plt.title(f'Region Grown from Seed (Tolerance={

      tolerance_value})')
    plt.tight_layout()
    plt.show()
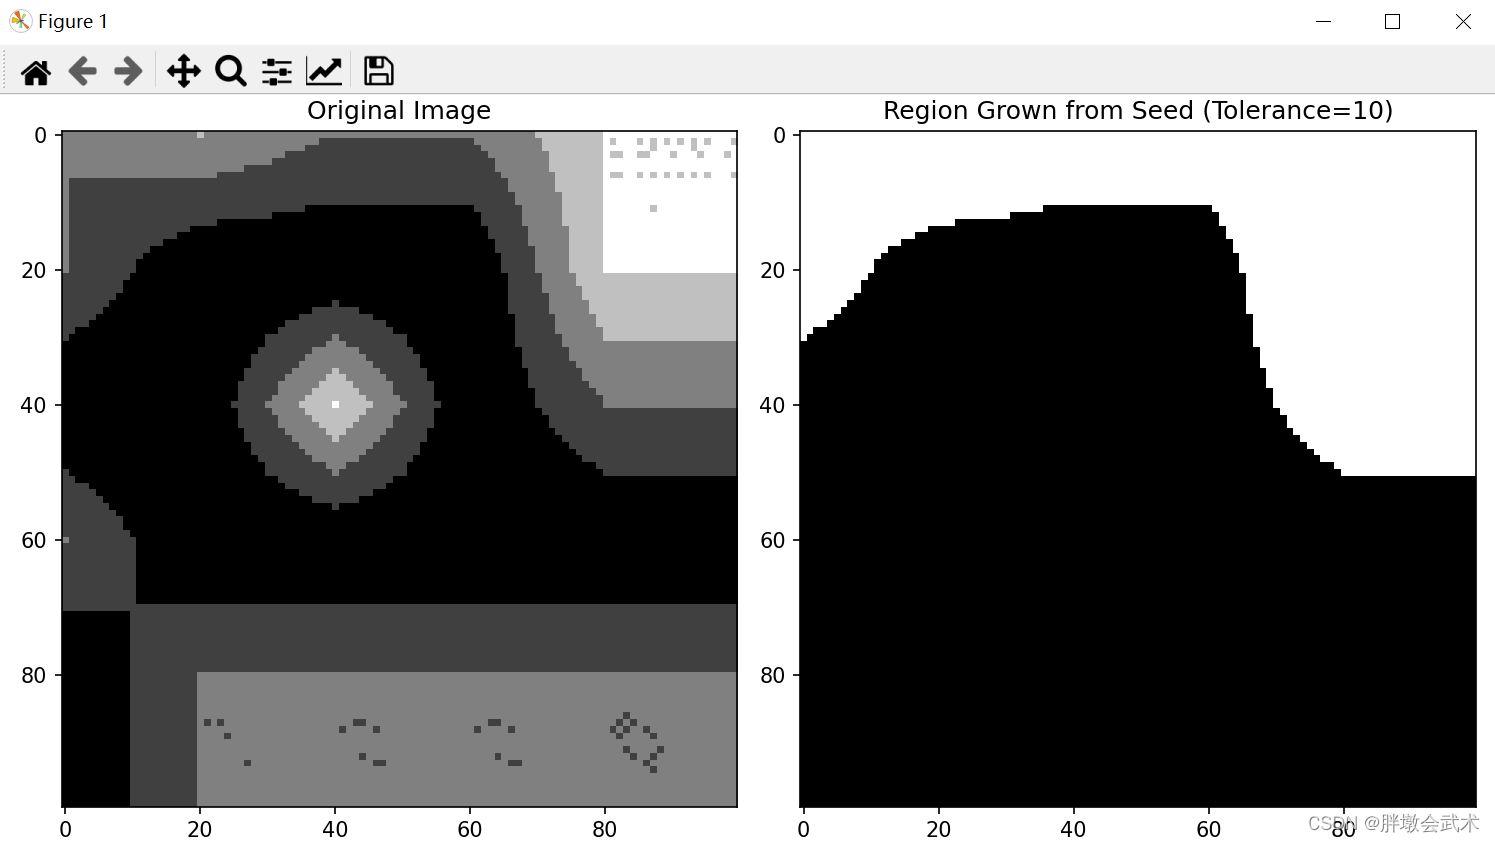
2.2、2D图像(100x100)
import numpy as np
import matplotlib.pyplot as plt

"""
区域增长算法:2D图像中的4连接条件 + 8连接条件
"""


def region_growing_4connect(image, seed, tolerance=1, max_region_size=None):
    """在2D图像中,4连接条件"""
    region = np.zeros_like(image, dtype=bool)
    height, width = image.shape
    stack = [(seed[0], seed[1])]

    while stack:
        y, x = stack.pop()
        if not (0 <= x < width and 0 <= y < height):
            continue
        if region[y, x]:
            continue
        if max_region_size is not None and np.sum(region) >= max_region_size:
            continue
        ###########################################################################
        """
        若添加该条件:其会将多个被独立区域完全分割,导致区域增长无法与周边独立区域进行连接。
        若取消该条件:则将两个独立区域连接的同时,中间的黑色区域也会同时连接。

        备注:当像素值与背景值差异越小则影响越大,反之差异越大则影响越小。
        备注:被黑色包围的区域认定为 "独立区域"
        备注:区域增长最终结果必定是一个独立的整体
        """
        if image[y, x] == 0:  # 如果当前像素值为0(不连接黑色块),则跳过
            continue
        ###########################################################################
        if abs(image[seed[0], seed[1]] - image[y, x]) <= tolerance:
            region[y, x] = 1
            stack.extend([(y - 1, x), (y + 1, x), (y, x - 1), (y, x + 1)])

    return region


def region_growing_8connect(image, seed, tolerance=1, max_region_size=None):
    """在2D图像中,8连接条件"""
    region = np.zeros_like(image, dtype=bool)
    height, width = image.shape
    stack = [(seed[0], seed[1])]

    while stack:
        y, x = stack.pop()
        if not (0 <= x < width and 0 <= y < height):
            continue
        if region[y, x]:
            continue
        if max_region_size is not None and np.sum(region) >= max_region_size:
            continue
        ###########################################################################
        """
        若添加该条件:其会将多个被独立区域完全分割,导致区域增长无法与周边独立区域进行连接。
        若取消该条件:则将两个独立区域连接的同时,中间的黑色区域也会同时连接。

        备注:当像素值与背景值差异越小则影响越大,反之差异越大则影响越小。
        备注:被黑色包围的区域认定为 "独立区域"
        备注:区域增长最终结果必定是一个独立的整体
        """
        if image[y, x] == 0:  # 如果当前像素值为0(不连接黑色块),则跳过
            continue
        ###########################################################################
        if abs(image[seed[0], seed[1]] - image[y, x]) <= tolerance:
            region[y, x] = 1
            stack.extend([(y - 1, x), (y + 1, x), (y, x - 1), (y, x + 1),
                          (y - 1, x - 1), (y - 1, x + 1), (y + 1, x - 1), (y + 1, x + 1)])

    return region


if __name__ == "__main__":
    ######################################################################
    # (1.1)原始数组大小
    original_array = np.array([[2, 3, 2, 2, 4],
                               [2, 0, 0, 0, 4],
                               [0, 0, 4, 0, 2],
                               [2, 0, 0, 0, 0],
                               [0, 2, 2, 2, 2]])

    # (1.2)目标数组大小
    target_size = (100, 100)  # 目标大小
    x_scale = target_size[1] / original_array.shape[1]  # 计算x轴方向的缩放因子
    y_scale = target_size[0] / original_array.shape[0]  # 计算y轴方向的缩放因子
    target_array = np.zeros(target_size, dtype=original_array.dtype)  # 创建目标数组

    # (1.3)使用双线性插值填充目标数组
    for y in range(target_size[0]):
        for x in range(target_size[1]):
            # 3.1、计算在原始数组中的坐标
            original_x = x / x_scale
            original_y = y / y_scale
            # 3.2、四个最近的原始数组中的点
            x1, y1 = int(original_x), int(original_y)
            x2, y2 = x1 + 1, y1 + 1
            # 3.3、边界检查
            x1 = min(max(x1, 0), original_array.shape[1] - 1)
            x2 = min(max(x2, 0), original_array.shape[1] - 1)
            y1 = min(max(y1, 0), original_array.shape[0] - 1)
            y2 = min(max(y2, 0), original_array.shape[0] - 1)
            # 3.4、双线性插值
            fx = original_x - x1
            fy = original_y - y1
            target_array[y, x] = (1 - fx) * (1 - fy) * original_array[y1, x1] + fx * (1 - fy) * original_array[y1, x2] + \
                                 (1 - fx) * fy * original_array[y2, x1] + fx * fy * original_array[y2, x2]

    image = target_array
    ######################################################################
    # (2)选择种子点并执行区域增长
    seed_point = (0, 0)  # 选择3D种子点
    tolerance_value = 2  # 设置容忍度,即相邻像素的范围
    max_region_size = 10000  # 设置最大区域大小
    connect_condition = 4  # 设置连接条件
    result_region = region_growing_4connect(image, seed_point, tolerance=tolerance_value, max_region_size=max_region_size)

    # (3)可视化显示3D原始图像和区域增长的结果(按像素值进行可视化)
    plt.figure(figsize=(10, 5))
    plt.subplot(1, 2, 1)
    plt.imshow(image, cmap='gray', origin='upper')
    plt.title('Original Image')
    plt.subplot(1, 2, 2)
    plt.imshow(result_region, cmap='gray', origin='upper')
    plt.title(f'Region Grown from Seed (Tolerance={

      tolerance_value})')
    plt.tight_layout()
    plt.show()
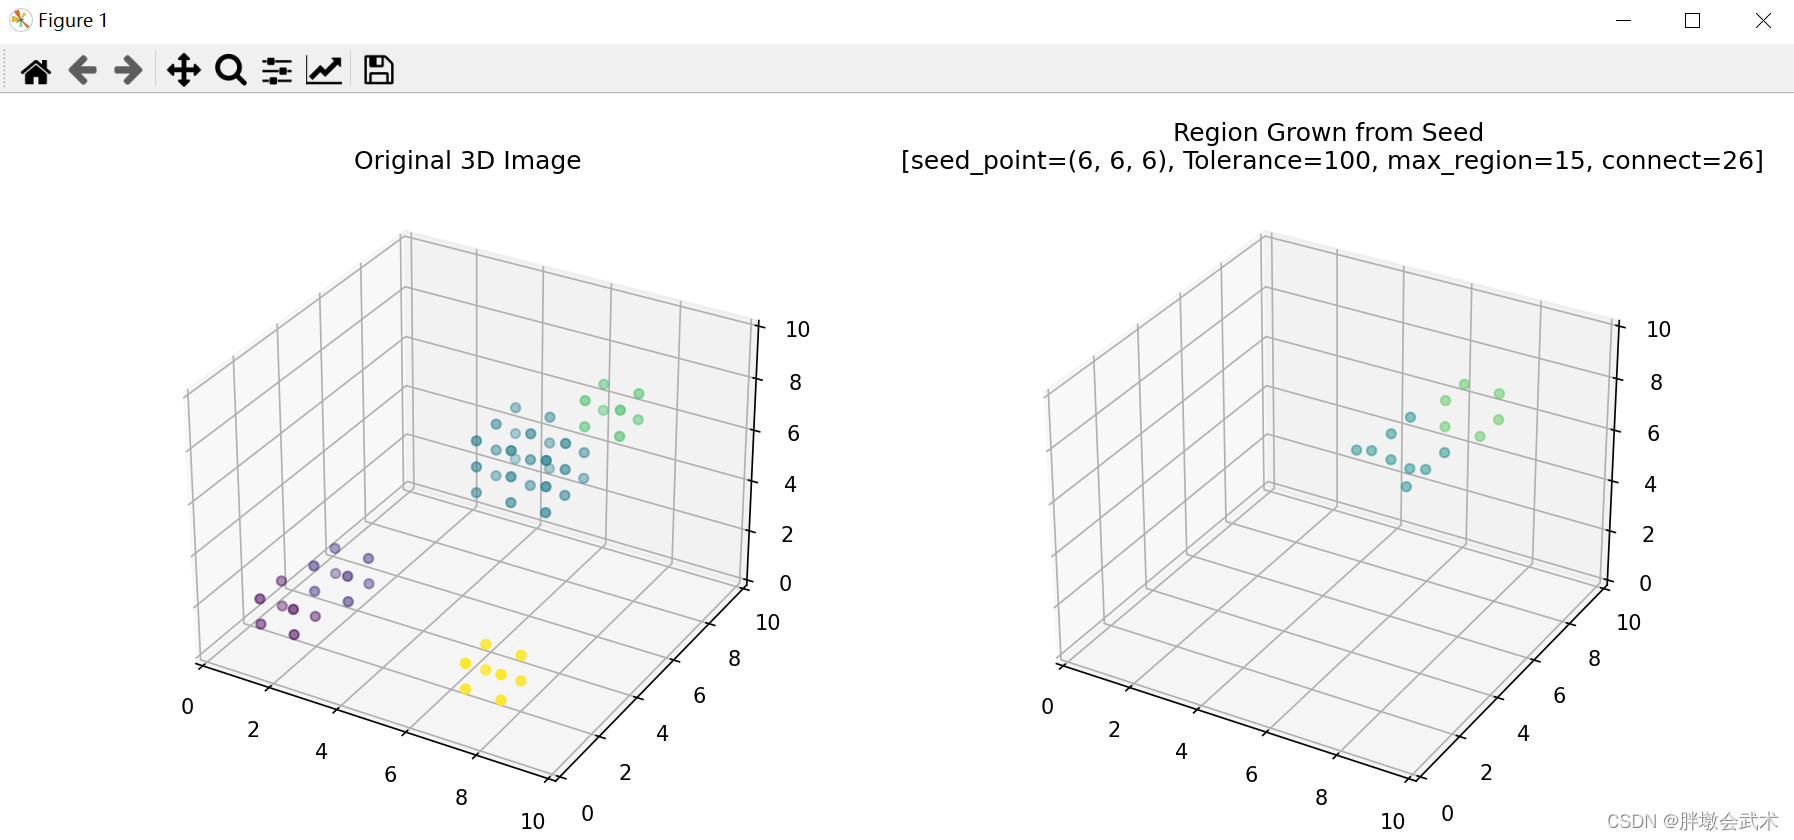
2.3、3D图像(10x10x10)
import numpy as np
import matplotlib.pyplot as plt

"""
区域增长算法:3D图像中的6连接条件 + 26连接条件
"""


def region_growing_6connect(image, seed, tolerance=1, max_region_size=None):
    """在3D图像中,6连接条件"""
    region = np.zeros_like(image, dtype=bool)
    depth, height, width = image.shape
    stack = [(seed[0], seed[1], seed[2])]

    while stack:
        z, y, x = stack.pop()
        if not (0 <= x < width and 0 <= y < height and 0 <= z < depth):
            continue
        if region[z, y, x]:
            continue
        if max_region_size is not None and np.sum(region) >= max_region_size:
            continue
        ###########################################################################
        """
        若添加该条件:其会将多个被独立区域完全分割,导致区域增长无法与周边独立区域进行连接。
        若取消该条件:则将两个独立区域连接的同时,中间的黑色区域也会同时连接。

        备注:当像素值与背景值差异越小则影响越大,反之差异越大则影响越小。
        备注:被黑色包围的区域认定为 "独立区域"
        备注:区域增长最终结果必定是一个独立的整体
        """
        if image[z, y, x] == 0:  # 如果当前像素值为0(背景),则跳过
            continue
        ###########################################################################
        if abs(image[seed[0], seed[1], seed[2]] - image[z, y, x]) <= tolerance:
            region[z, y, x] = 1
            stack.extend([(z - 1, y, x), (z + 1, y, x), (z, y - 1, x), (z, y + 1, x), (z, y, x - 1), (z, y, x + 1)])
    return region


def region_growing_26connect(image, seed, tolerance=1, max_region_size=None):
    """在3D图像中,26连接条件"""
    region = np.zeros_like(image, dtype=bool)
    depth, height, width = image.shape
    stack = [(seed[0], seed[1], seed[2])]

    while stack:
        z, y, x = stack.pop()
        if not (0 <= x < width and 0 <= y < height and 0 <= z < depth):
            continue
        if region[z, y, x]:
            continue
        if max_region_size is not None and np.sum(region) >= max_region_size:
            continue
        ###########################################################################
        """
        若添加该条件:其会将多个被独立区域完全分割,导致区域增长无法与周边独立区域进行连接。
        若取消该条件:则将两个独立区域连接的同时,中间的黑色区域也会同时连接。

        备注:当像素值与背景值差异越小则影响越大,反之差异越大则影响越小。
        备注:被黑色包围的区域认定为 "独立区域"
        备注:区域增长最终结果必定是一个独立的整体
        """
        if image[z, y, x] == 0:  # 如果当前像素值为0(背景),则跳过
            continue
        ###########################################################################
        if abs(image[seed[0], seed[1], seed[2]] - image[z, y, x]) <= tolerance:
            region[z, y, x] = 1
            stack.extend([(z - 1, y, x), (z + 1, y, x), (z, y - 1, x), (z, y + 1, x), (z, y, x - 1), (z, y, x + 1),
                          (z - 1, y - 1, x), (z - 1, y + 1, x), (z + 1, y - 1, x), (z + 1, y + 1, x),
                          (z - 1, y, x - 1), (z - 1, y, x + 1), (z + 1, y, x - 1), (z + 1, y, x + 1),
                          (z, y - 1, x - 1), (z, y - 1, x + 1), (z, y + 1, x - 1), (z, y + 1, x + 1),
                          (z - 1, y - 1, x - 1), (z - 1, y - 1, x + 1), (z - 1, y + 1, x - 1), (z - 1, y + 1, x + 1),
                          (z + 1, y - 1, x - 1), (z + 1, y - 1, x + 1), (z + 1, y + 1, x - 1), (z + 1, y + 1, x + 1)])
    return region


if __name__ == "__main__":

    # (1)创建一个典型的3D图像数据
    depth, height, width = 10, 10, 10
    image3D = np.zeros((depth, height, width), dtype=int)
    image3D[1:3, 1:3, 1:3] = 1
    image3D[2:4, 2:4, 2:4] = 2
    image3D[5:8, 5:8, 5:8] = 4
    image3D[7:9, 7:9, 7:9] = 6
    image3D[7:9, 1:3, 1:3] = 8

    # (2)选择种子点并执行区域增长
    seed_point = (6, 6, 6)  # 选择3D种子点
    tolerance_value = 100  # 设置容忍度,即相邻像素的范围
    max_region_size = 15  # 设置最大区域大小
    connect_condition = 26  # 设置连接条件
    result_region = region_growing_26connect(image3D, seed_point, tolerance=tolerance_value, max_region_size=max_region_size)

    # (3)可视化显示3D原始图像和区域增长的结果(按像素值进行可视化)
    fig = plt.figure(figsize=(12, 5))
    # (3.1)原始3D图像
    ax1 = fig.add_subplot(121, projection='3d')
    x, y, z = np.where(image3D > 0)
    ax1.scatter(x, y, z, c=image3D[x, y, z], cmap='viridis')  # 点状图
    ax1.set_title('Original 3D Image')
    ax1.set_xlim(0, 10)  # 设置X轴范围
    ax1.set_ylim(0, 10)  # 设置Y轴范围
    ax1.set_zlim(0, 10)  # 设置Z轴范围
    # (3.2)区域增长结果,使用第一张图的颜色映射
    from matplotlib.colors import Normalize
    ax2 = fig.add_subplot(122, projection='3d')
    x, y, z = np.where(result_region)
    cmap = plt.get_cmap('viridis')
    norm = Normalize(vmin=np.min(image3D), vmax=np.max(image3D))
    ax2.scatter(x, y, z, c=cmap(norm(image3D[x, y, z])), alpha=0.5)  # 点状图
    ax2.set_title(f'Region Grown from Seed'
                  f'\n [seed_point={

      seed_point}, Tolerance={

      tolerance_value}, max_region={

      max_region_size}, connect={

      connect_condition}]')
    ax2.set_xlim(0, 10)  # 设置X轴范围
    ax2.set_ylim(0, 10)  # 设置Y轴范围
    ax2.set_zlim(0, 10)  # 设置Z轴范围

    plt.tight_layout()
    plt.show()