1.导入图片后进行预处理,包括灰度图、滤波、突出边缘、二值化。边缘检测方法有:'gaussian', 'sobel', 'prewitt', 'laplacian', 'log', 'average', 'unsharp', 'disk', 'motion'。
2.使用[H,theta,rho] = hough(f3,'RhoResolution', 0.2, 'Theta', -90:0.2:89)函数将预处理后的图片进行hough变换,得到H矩阵。
3.使用P=houghpeaks(H,5,'threshold', ceil(0.3*max(H(:))))函数取得H矩阵中5处最高值的位置,表示取得存在于原图中较长的5条直线。
4.使用lines=houghlines(f3,theta,rho,P,'FillGap',20,'MinLength',40)函数取得上述5条直线在图中的端点。
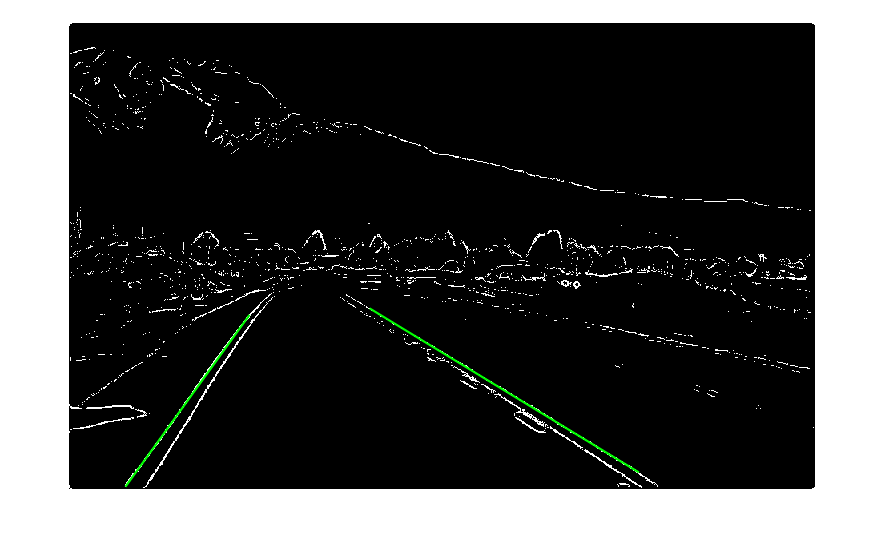
5.滤除长度与斜率不符合车道实际的线段后,划线显示检测得到的车道。
F=imread('D:\Desktop\2.png');
f=rgb2gray(F);
f1=medfilt2(f,[9,9]);              %中值滤波
H=fspecial('log');
f2=imfilter(f1,H);                 %突出边缘
thresh=graythresh(f2);
f3=imbinarize(f2,thresh);           %二值化
figure(1),imshow(f3);

[H,theta,rho] = hough(f3,'RhoResolution', 0.2, 'Theta', -90:0.2:89);
figure(2),imshow(imadjust(rescale(H)),'XData',theta,'YData',rho,'InitialMagnification','fit');
title('Hough transform');
xlabel('\theta'), ylabel('\rho');
axis on, axis normal, hold on;
colormap(gca,hot);

P=houghpeaks(H,5,'threshold', ceil(0.3*max(H(:))));
x = theta(P(:,2));
y = rho(P(:,1));
plot(x,y,'s','LineWidth',1.5,'Markersize',10,'color','green');

lines=houghlines(f3,theta,rho,P,'FillGap',20,'MinLength',40);
line_length_thred=40;
slope_thred=0.1;
figure(3),imshow(f3);
L= length(lines);
for k=1:L
  xy= [lines(k).point1; lines(k).point2];
  line_length=((xy(1,1)-xy(2,1))^2+(xy(1,2)-xy(2,2))^2)^0.5;
if line_length< line_length_thred
  continue;
end
slope=(xy(1,2)-xy(2,2))/(xy(1,1)-xy(2,1));
if abs(slope)< slope_thred
  continue;
end
line(xy(:,1),xy(:,2),'LineWidth',2,'Color','green');
end
预处理后的二值化图像如下:

hough变换后找到5个H矩阵中的最大值:

可看到(rho,theta)在图内部有2个高值在(100,-50°)、(400,40°)左右。
根据matlab中hough变换后的坐标关系,可知(rho,theta)为(100,-50°)正是检测到的右边的车道线。(rho,theta)为(400,40°)正是检测到的左边的车道线。
theta在-90°与90°附近检测到3个H矩阵中的高值,表示检测到图片中横向的线条。

滤除长度与斜率不符合车道实际的线段后,划线显示检测得到的车道。