1 效果
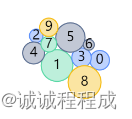
初始化时节点向中间聚拢
拖动后,随引力作用缓缓向中间聚拢
点击节点,节点放大,并展示标签文字
2 代码分析
2.1 数据
2.1.1 节点数据
nodes: [
          {


            id: '0',
            label: '0',
            value: 10,
            cluster: 'a',
            description: 'this is node 0, \nand the value of it is 10',
          },
          {


            id: '1',
            label: '1',
            value: 20,
            cluster: 'b',
            description: 'this is node 1, \nand the value of it is 20',
          },
value: 决定节点大小
cluster: a b c d 对应不同的样式 cluster值决定拿到colors、strokes数组中的某一项
label: 默认节点文本(默认配置项属性)
description: 点击节点放大后 该该数据赋值给label 展示文本
2.1.2 节点样式
样式并不是按照顺序固定给某节点的的,而是通过cluster拿到对应数组的某一项,赋予节点
	  // 节点填充颜色
      const colors = [
        '#BDD2FD',
        '#BDEFDB',
        '#C2C8D5',
        '#FBE5A2',
        '#F6C3B7',
        '#B6E3F5',
        '#D3C6EA',
        '#FFD8B8',
        '#AAD8D8',
        '#FFD6E7',
      ];
      // 节点边颜色
      const strokes = [
        '#5B8FF9',
        '#5AD8A6',
        '#5D7092',
        '#F6BD16',
        '#E8684A',
        '#6DC8EC',
        '#9270CA',
        '#FF9D4D',
        '#269A99',
        '#FF99C3',
      ];
2.2 图配置
Graph 的初始化通过 new 进行实例化,实例化时需要传入需要的参数。
<div id="container"></div>

const graph = new G6.Graph({


        container: 'container',
        width,
        height,
        layout: {


          type: 'force', // 力导向布局
          nodeStrength: 30, // 节点作用力,正数代表节点之间的引力作用,负数代表节点之间的斥力作用
          collideStrength: 0.7, // 防止重叠的力强度,范围 [0, 1]
          alphaDecay: 0.01, // 迭代阈值的衰减率 ?啥玩意
          preventOverlap: true, // 是否防止重叠 必须在数据中设置了 size 或在该布局中配置了与当前图节点大小相同的 nodeSize 值
        },
        modes: {


          default: ['collapse-expand-combo'], // combo类型 之前采用drag-node 不太丝滑
        },
        defaultNode: {


          size: [10, 10],
        },
      });
2.3 定义节点样式
// 遍历nodes 根据cluster属性 给节点添加对应style属性
      nodes.forEach((node) => {


        nodeMap.set(node.id, node);
        // cluster
        if (node.cluster && clusterMap.get(node.cluster) === undefined) {


          clusterMap.set(node.cluster, clusterId);
          clusterId++;
        }
        const cid = clusterMap.get(node.cluster);
        if (!node.style) node.style = {

    };
        node.style.fill = colors[cid % colors.length]; //节点颜色
        node.style.stroke = strokes[cid % strokes.length]; //节点边颜色
        node.x = width / 2 + 200 * (Math.random() - 0.5);
        node.y = height / 2 + 200 * (Math.random() - 0.5);
      });
2.4 节点大小设置
// 调用scaleNodeProp
scaleNodeProp(nodes, 'size', 'value', nodeSizeDataRange, nodeSizeRange);

      // 添加size属性
      function scaleNodeProp (elements, propName, refPropName, dataRange, outRange) {


        const outLength = outRange[1] - outRange[0];
        const dataLength = dataRange[1] - dataRange[0];
        elements.forEach(function (n) {


          if (propName.split('.')[0] === 'style') {


            if (n.style) {


              n.style[propName.split('.')[1]] =
                ((n[refPropName] - dataRange[0]) * outLength) / dataLength + outRange[0];
            } else {


              n.style = _defineProperty(
                {

    },
                propName.split('.')[1],
                ((n[refPropName] - dataRange[0]) * outLength) / dataLength + outRange[0],
              );
            }
          } else {


            n[propName] = ((n[refPropName] - dataRange[0]) * outLength) / dataLength + outRange[0];
          }
        });
      }
2.5 节点交互事件
  // 方法:跟随拖动的位置 节点位置移动
  // 参数e:鼠标拖动信息
  function refreshDragedNodePosition (e) {


    const model = e.item.get('model');
    model.fx = e.x;
    model.fy = e.y;
  }
2.5.1 节点开始被拖拽
  // 事件绑定 graph.on()
  // Node 交互事件: node:dragstart 当节点开始被拖拽的时候触发的事件
  graph.on('node:dragstart', function (e) {


    graph.layout(); // graph.layout()重新以当前配置的属性进行一次布局
    refreshDragedNodePosition(e);
  });
2.5.2 开始拖拽过程
  // node:drag  当节点在拖动过程中时触发的事件
  graph.on('node:drag', function (e) {


    refreshDragedNodePosition(e);
  });
2.5.3 拖拽完成后
  // node:dragend 当拖拽完成后触发的事件
  graph.on('node:dragend', function (e) {


    e.item.get('model').fx = null;
    e.item.get('model').fy = null;
  });
2.5.4 点击事件
  // node:click 鼠标左键单击节点时触发
  graph.on('node:click', function (e) {


    // debugger;
    const node = e.item; //那到当前点击的节点
    const states = node.getStates(); //返回当前元素的所有状态 啥也没有
    let clicked = false;
    const model = node.getModel(); // 获得节点位置
    let size = 200; // 变大
    let labelText = 'NODE: ' + model.id + '\n' + model.description; // 拼接: "NODE:  this is node 8, and the value of it is 21"
    states.forEach(function (state) {


      if (state === 'click') {


        clicked = true;
        size = model.oriSize;
        labelText = model.oriLabel;
      }
    });
    graph.setItemState(node, 'click', !clicked); //设置元素状态(元素实例,状态值,是否启用状态)
    // 更新元素,包括更新数据、样式等
    graph.updateItem(node, {


      size,
      label: labelText,
    });
    graph.layout(); // graph.layout()重新以当前配置的属性进行一次布局
  });
2.6 初始化图数据
  graph.data(data); // 初始化图数据,data是一个包括 节点 数组和 边 数组的对象
  graph.render();
2.7 mounted() 调用
上述代码包裹在 getInit() 方法中
在组件挂载后调用 getInit()