Vue2中使用Echart
1. Demo效果
1.2 安装echarts
$npm install echarts --save1.3 安装vue echarts
Echarts官方专门为vue做的封装
$npm install vue-echarts --save1.4 在mian.js中引入
import 'echarts'

import Echarts from 'vue-echarts'

import 'echarts/theme/shine'//引入echart 主题(多种主题可使用)

import 'echarts/theme/cool'

const app = createApp(App)

app.component('v-chart', Echarts)

app.mount('#app')
1.5组件中使用
demo.vue
<template>

 <v-chart autoresize theme="shine" :option="option_column" style="height: 400px;width:600px;"></v-chart>

</template>
<script>
import LineOption from './options/echart-line.ts'
export default {
name:'EchartLine',
data() {
return {
option_column: LineOption
};
},
};
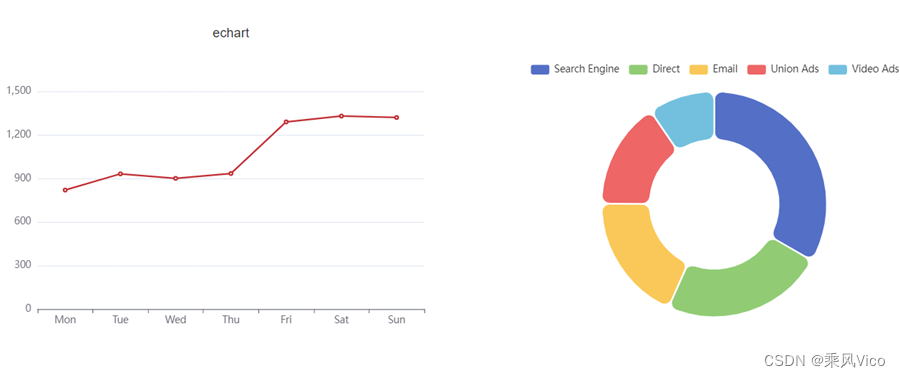
</script>echart-line.ts
const LineOption = {

 xAxis: {

  type: 'category',

  data: ['Mon', 'Tue', 'Wed', 'Thu', 'Fri', 'Sat', 'Sun']

 },

 yAxis: {

  type: 'value'

 },

 series: [

  {

   data: [820, 932, 901, 934, 1290, 1330, 1320],//数据

   type: 'line',//图表类型

   smooth: false,//是否

  }

 ]

};

export default LineOption;
1.6其他属性
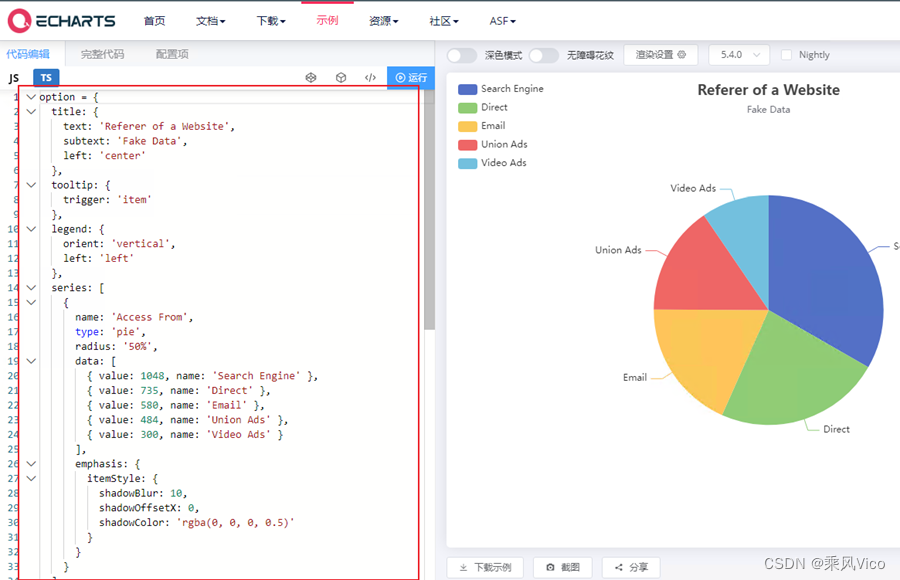
Option中定义图表数据、图表类型及图表的其他属性。
查看官网demo时,直接将demo的option替换进来即可,其他效果待进一步研究。