1、实现效果
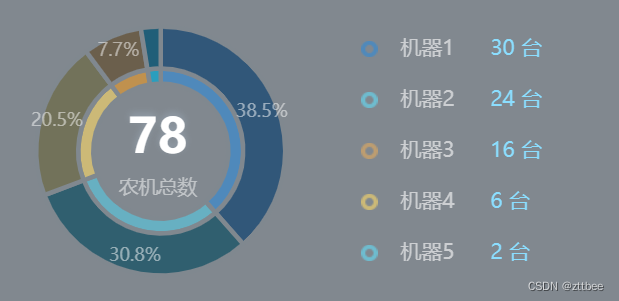
环形图,有两层环形,扇形之间有间隔,中间是标题,图例是自定义图片
2、实现
在template里写一个盒子放图表
<div class="chartMachineStyle" ref="chartMachine"></div>
在style里设置盒子尺寸
.chartMachineStyle {


			height: 200px;
			width:355px
		}
在data中声明一个变量
myChartMachine: '',
在methods写一个配置图表函数
	initChartMachine() {


				var data = [{


					name: '机器1',
					value: '30',
					icon: 'image://https://asc-test1.oss-cn-beijing.aliyuncs.com/2023/07/05/icon1.png'
				}, {


					name: '机器2',
					value: '24',
					icon: "image://https://asc-test1.oss-cn-beijing.aliyuncs.com/2023/07/05/icon2.png",
				}, {


					name: '机器3',
					value: '16',
					icon: "image://https://asc-test1.oss-cn-beijing.aliyuncs.com/2023/07/05/icon3.png",
				}, {


					name: '机器4',
					value: '6',
					icon: "image://https://asc-test1.oss-cn-beijing.aliyuncs.com/2023/07/05/icon4.png",
				}, {


					name: '机器5',
					value: '2',
					icon: "image://https://asc-test1.oss-cn-beijing.aliyuncs.com/2023/07/05/icon5.png",
				}, ]
				var subText = '78'
				let _this = this;
				this.myChartMachine = echarts.init(this.$refs.chartMachine)
				var option;
				option = {


					tooltip: {


						trigger: "item",
						formatter: "{b}<br/> {c}台  ({d}%)",
						backgroundColor: "rgba(50, 50, 50, 0.7)",
						color: "rgba(50, 50, 50, 0.7)",
						borderWidth: "1", //边框宽度设置1
						borderColor: "rgba(50, 50, 50, 0.7)", //设置边框颜色
						textStyle: {


							color: "#ffffff" //设置文字颜色
						},
					},
					//环形图中间文字
					title: {


						text: subText,
						subtext: "农机总数",
						textStyle: {


							fontSize: 32,
							color: '#ffffff',
							fontWeight: 600,
							textShadowOffsetY: -2,
							textShadowBlur: 5,
							textShadowColor: 'rgb(199,227,252,0.24)',
						},
						subtextStyle: {


							fontSize: 13,
							color: "rgba(255,255,255,0.5)",
						},
						textAlign: "center", //图例文字居中显示
						x: "25%", //距离左边的距离
						y: "36%" //距离上边的距离
					},
					grid: {


						//设置图表撑满整个画布
						//left: '50%',
					},
					legend: {


						orient: "vertical", //竖直展示,如果横着的话,这个可以直接去掉
						top: "center",
						align: "left",
						itemGap: 20, //数据上下的距离
						data: data,
						orient: 'vertical',
						x: 'right', //可设定图例在左、右、居中
						y: 'center', //可设定图例在上、下、居中
						itemHeight: 11, // 每个图例的宽度
						itemWidth: 11, // 每个图例的高度
						// 重写legend显示样式
						formatter: function(name) {

     //用来格式化图例文本,支持字符串模板和回调函数两种形式。模板变量为图例名称 {name}
							var tarValue;
							for (var i = 0; i < data.length; i++) {


								if (data[i].name == name) {


									tarValue = data[i].value;
								}
							}
							var arr = [
								'{a|' + name + '}',
								'{b|' + tarValue + ' 台' + '}',
							]
							return arr.join('')
						},
						textStyle: {


							rich: {


								a: {


									fontSize: 14,
									color: 'rgb(255,255,255,0.6)',
									padding: [0, 0, 0, 10],
									width: 60,
								},
								b: {


									fontSize: 14,
									color: '#8BDEFF',
									align: 'center',
									shadowColor: 'rgb(0,14,17,0.19)',
									shadowBlur: 1,
									shadowOffsetY: 2,
								}
							}
						},
					},
					series: [{


							name: '农机数量',
							type: 'pie',
							radius: ['45%', '55%'],
							center: ['27%', '50%'],
							avoidLabelOverlap: false,
							emphasis: {


								scale: false,
								label: {


									show: false,
									fontSize: 40,
									fontWeight: 'bold'
								}
							},
							itemStyle: {


								borderColor: '#80888F',
								borderWidth: 3,
								color: function(colors) {


									var colorList = ["#4F89BB", "#67b0c2", "#ccb977", "#c0914e",
										"#2a9ebe"
									];
									return colorList[colors.dataIndex];
								},
								borderRadius: 0,
							},
							label: {


								show: false,
								position: 'center'
							},
							labelLine: {


								show: false
							},
							data: data
						},
						{


							name: '农机数量',
							type: 'pie',
							radius: ['55%', '83%'],
							center: ['27%', '50%'],
							avoidLabelOverlap: false,
							itemStyle: {


								borderColor: '#80888F',
								borderWidth: 3,
								color: function(colors) {


									var colorList = ["#315779", "#305f6f", "#72725a", "#6b5f4c",
										"#205e78"
									];
									return colorList[colors.dataIndex];
								},
								borderRadius: 0,
							},
							label: {


								show: true,
								formatter: function(data) {


									return data.percent.toFixed(1) + "%";
								},
								color: 'rgba(255,255,255,0.5)',
								fontSize: 12,
								position: 'inner'
							},
							emphasis: {


								label: {


									show: true,
									formatter: function(data) {


										return data.percent.toFixed(1) + "%";
									},
								}
							},
							labelLine: {


								show: false
							},
							data: data
						},
					]
				};
				this.myChartMachine.setOption(option, true);
				window.addEventListener("resize", () => {


					if (this.myChartMachine) {


						this.myChartMachine.resize();
					}
				});
			},
调用即可
this.initChartMachine();
3、备注
这里扇形之间的间隔用边框实现效果,将边框设为一定宽度,再将颜色设为背景色,就好像扇形之间有距离了一样。