Reference: https://blog.csdn.net/zhoufan900428/article/details/12709361
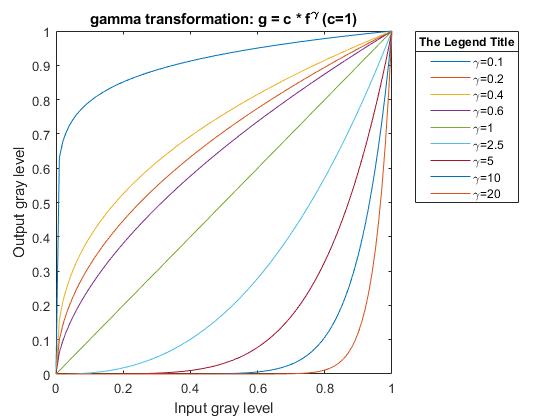
The gamma transformation is different from log transformation. Its code is similar to that of the last blog. Its figure is as follows:
Figure :
gamma transformation Matlab code:
f = imread('2.jpg');
I=rgb2gray(f);
f = mat2gray(I);

gamma1 = 0.1;
g_0_1 = f.^gamma1;
gamma2 = 0.2;
g_0_2 = f.^gamma2;
gamma3 = 0.4;
g_0_4 = f.^gamma3;
gamma4 = 0.6;
g_0_6 = f.^gamma4;
gamma5 = 0.8;
g_0_8 = f.^gamma5;
gamma6 = 1;
g_1 = f.^gamma6;
gamma7 = 2.5;
g_2_5 = f.^gamma7;
gamma8 = 5;
g_5 = f.^gamma8;

figure();
subplot(3,3,1);
imshow(f,[0 1]);
xlabel('a).Original Image');

subplot(3,3,2);
imshow(g_0_1,[0 1]);
xlabel('b).\gamma =0.1');

subplot(3,3,3);
imshow(g_0_2,[0 1]);
xlabel('c).\gamma =0.2');

subplot(3,3,4);
imshow(g_0_4,[0 1]);
xlabel('d).\gamma=0.4');

subplot(3,3,5);
imshow(g_0_6,[0 1]);
xlabel('e).\gamma=0.6');

subplot(3,3,6);
imshow(g_0_8,[0 1]);
xlabel('f).\gamma=0.8');

subplot(3,3,7);
imshow(g_1,[0 1]);
xlabel('g).\gamma=1 i.e. original image');

subplot(3,3,8);
imshow(g_2_5,[0 1]);
xlabel('h).\gamma=2.5');

subplot(3,3,9);
imshow(g_5,[0 1]);
xlabel('i).\gamma=5');
Figure :
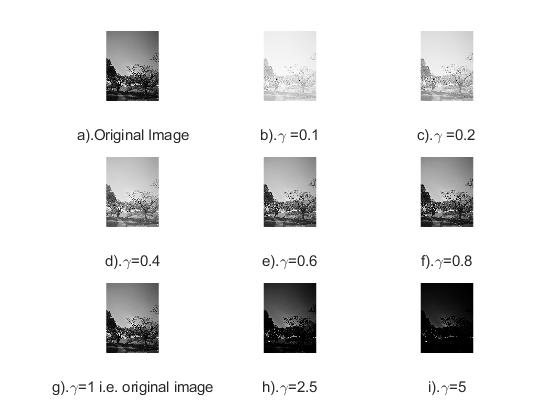
we can see that if gamma <1, the gray level becomes brighter, otherwise, it is darker. It is obvious to know if we connect this figure with the last figure, namely, the gamma image.
I make some improvements on the basis of the original blog. https://blog.csdn.net/zhoufan900428/article/details/12709361 Thanks again.
Due to level constraint, please comment if you ave any questions about this blog. I would greatly appreciate it if you kindly give me some feedback.
^_^