提示:文章写完后,目录可以自动生成,如何生成可参考右边的帮助文档
前言
空域滤波增强
- 卷积原理
- 多维连续卷积
- 线性平滑滤波
- 领域平均法、选择平均法、Wiener滤波
- 非线性平滑滤波
- 中值滤波
- 序统计滤波
- 线性锐化滤波
- Laplacian算子
- 非线性锐化滤波
- Prewitt算子
- Sobel算子
- Log算子
Matlab学习8-图像处理之线性与非线性锐化滤波
序统计滤波、Laplacian算子、梯度法
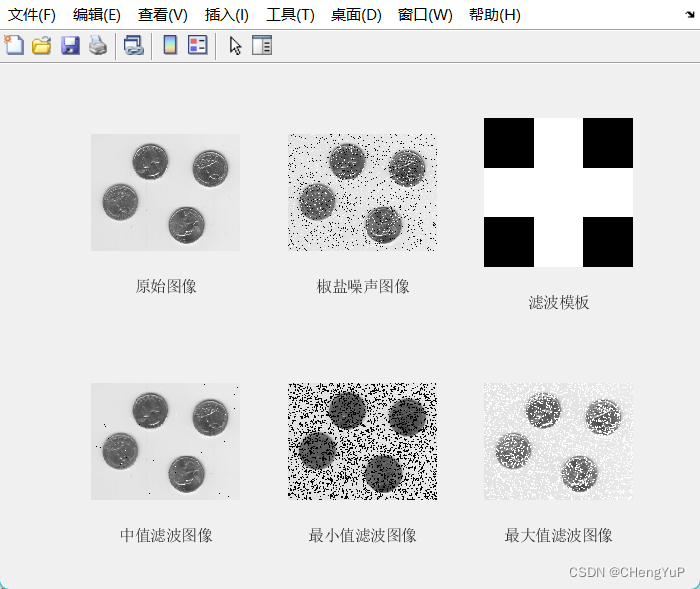
一、序统计滤波
效果
代码
%序统计滤波器
img=imread("img/eight.tif");
subplot(2,3,1),imshow(img),xlabel("原始图像");

img1=imnoise(img,'salt & pepper',0.1);
subplot(2,3,2),imshow(img1),xlabel("椒盐噪声图像");

mask=[  0 1 0
        1 1 1
        0 1 0];
subplot(2,3,3),imshow(mask),xlabel("滤波模板");

K1=ordfilt2(img1,3,mask);
subplot(2,3,4),imshow(uint8(K1)),xlabel("中值滤波图像");

K2=ordfilt2(img1,1,mask);
subplot(2,3,5),imshow(uint8(K2)),xlabel("最小值滤波图像");

K3=ordfilt2(img1,5,mask);
subplot(2,3,6),imshow(uint8(K3)),xlabel("最大值滤波图像");
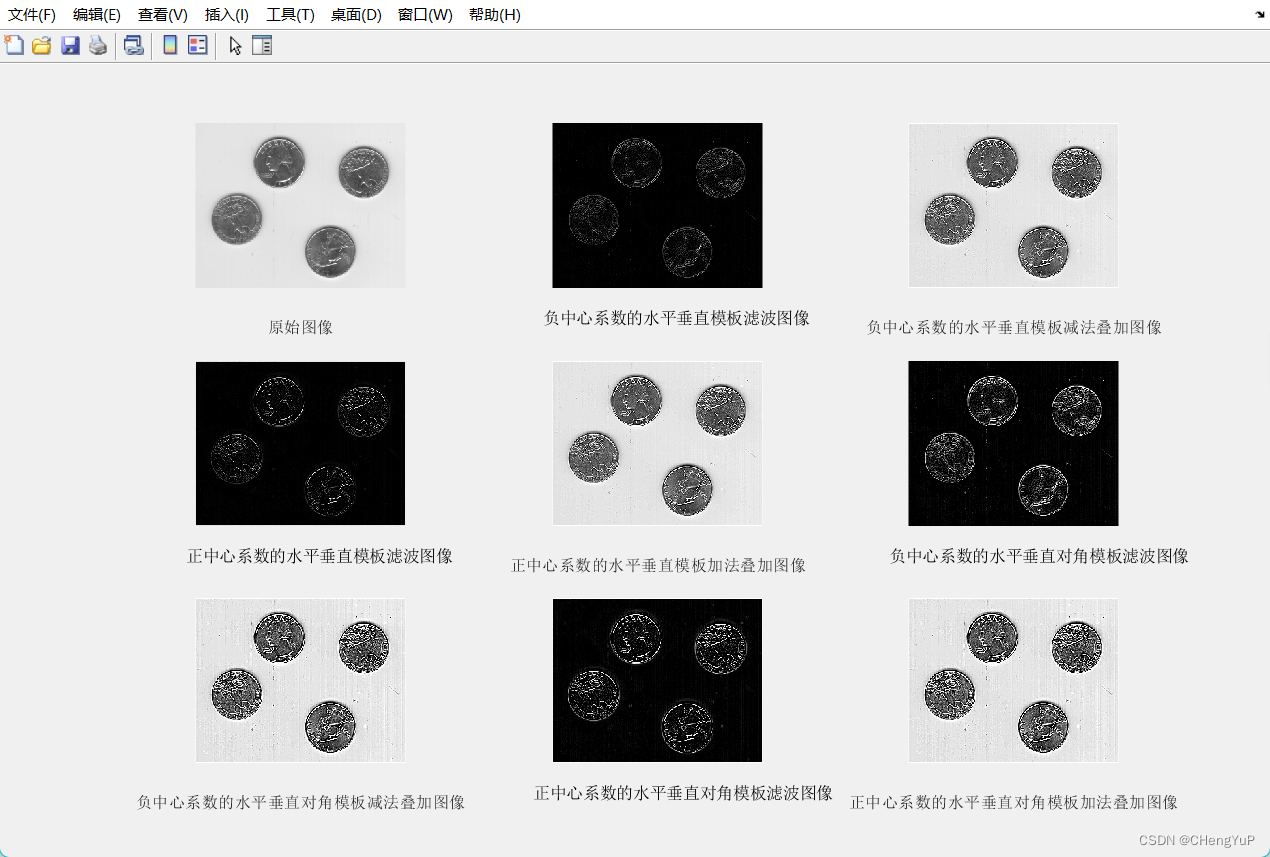
二、拉普拉斯算子
效果
代码
%拉普拉斯算子实例
img=imread("img/eight.tif");
subplot(3,3,1),imshow(img),xlabel("原始图像");
mask1=fspecial('laplacian',0);
L1=filter2(mask1,img);
subplot(3,3,2),imshow(uint8(L1)),text(-14,285,'负中心系数的水平垂直模板滤波图像');
subplot(3,3,3),imshow(uint8(double(img)-L1)),xlabel('负中心系数的水平垂直模板减法叠加图像');

mask2=-mask1;
L2=filter2(mask2,img);
subplot(3,3,4),imshow(uint8(L2)),text(-14,285,'正中心系数的水平垂直模板滤波图像');
subplot(3,3,5),imshow(uint8(double(img)+L2)),xlabel('正中心系数的水平垂直模板加法叠加图像');

mask3=[ 1  1  1
        1 -8  1
        1  1  1];
L3=filter2(mask3,img);
subplot(3,3,6),imshow(uint8(L3)),text(-28,285,'负中心系数的水平垂直对角模板滤波图像');
subplot(3,3,7),imshow(uint8(double(img)-L3)),xlabel('负中心系数的水平垂直对角模板减法叠加图像');

mask4=-mask3;
L4=filter2(mask4,img);
subplot(3,3,8),imshow(uint8(L4)),text(-28,285,'正中心系数的水平垂直对角模板滤波图像');
subplot(3,3,9),imshow(uint8(double(img)+L4)),xlabel('正中心系数的水平垂直对角模板加法叠加图像');
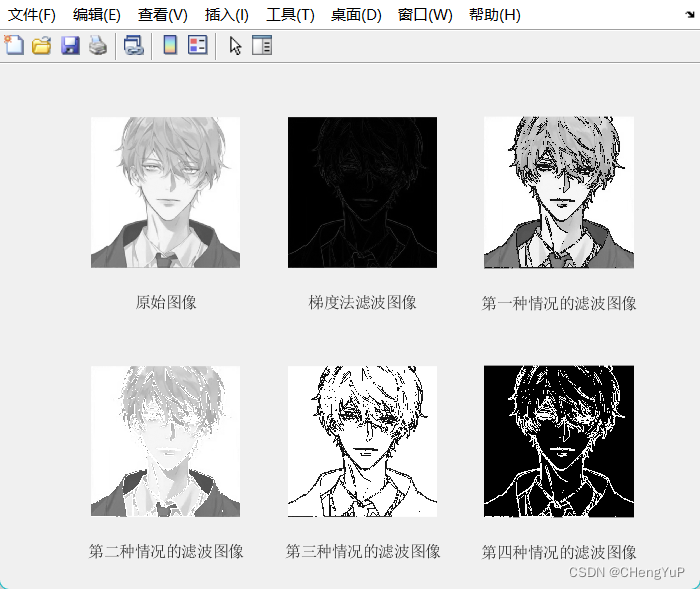
三、梯度滤波
效果
代码
扫描二维码关注公众号,回复:
16033201 查看本文章

%梯度滤波
img=imread("img/img.jpg");
subplot(2,3,1),imshow(img),xlabel("原始图像");

img=double(img);
[Gx,Gy]=gradient(img);
G=sqrt(Gx.*Gx+Gy.*Gy);

img1=G;
subplot(2,3,2),imshow(uint8(img1)),xlabel("梯度法滤波图像");


img2=img;
K=find(G>=7);
img2(K)=G(K);
subplot(2,3,3),imshow(uint8(img2)),xlabel("第一种情况的滤波图像");

img3=img;
K=find(G>=7);
img3(K)=255;
subplot(2,3,4),imshow(uint8(img3)),xlabel("第二种情况的滤波图像");

img4=G;
K=find(G<=7);
img4(K)=255;
subplot(2,3,5),imshow(uint8(img4)),xlabel("第三种情况的滤波图像");

img5=img;
K=find(G<=7);
img5(K)=0;
Q=find(G>=7);
img5(Q)=255;
subplot(2,3,6),imshow(uint8(img5)),xlabel("第四种情况的滤波图像");
点击获取源码
https://gitee.com/CYFreud/matlab/tree/master/image_processing/demo8_220425