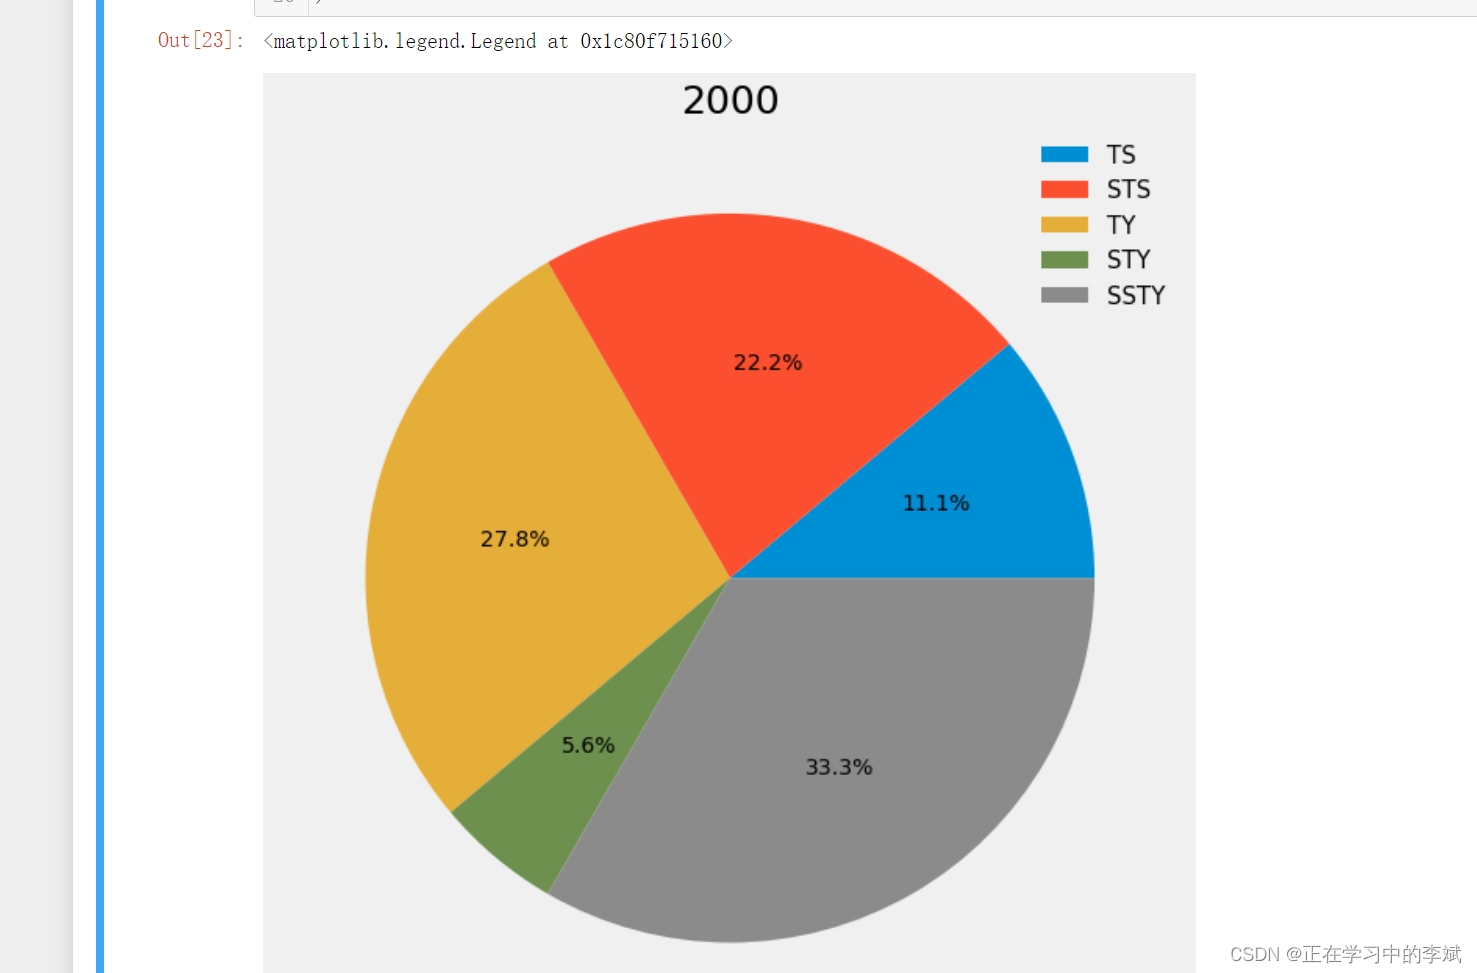
一、普通饼图
import pandas as pd
import matplotlib.pyplot as plt

# 使用好看的样式
plt.style.use('fivethirtyeight')

fig = plt.figure(figsize=(12,12))
ax = fig.add_subplot()

data = [2,4,5,1,6]
labels = ['TS','STS','TY','STY','SSTY']


wedges, texts, autotexts = ax.pie(
    data,
    # 显示百分比,保留一位小数
    autopct='%1.1f%%',
)

ax.set_title(str(2000),fontsize=25)

ax.legend(
    wedges,
    labels,
    title="",
    prop={

    'size': 15},
    frameon=False
)
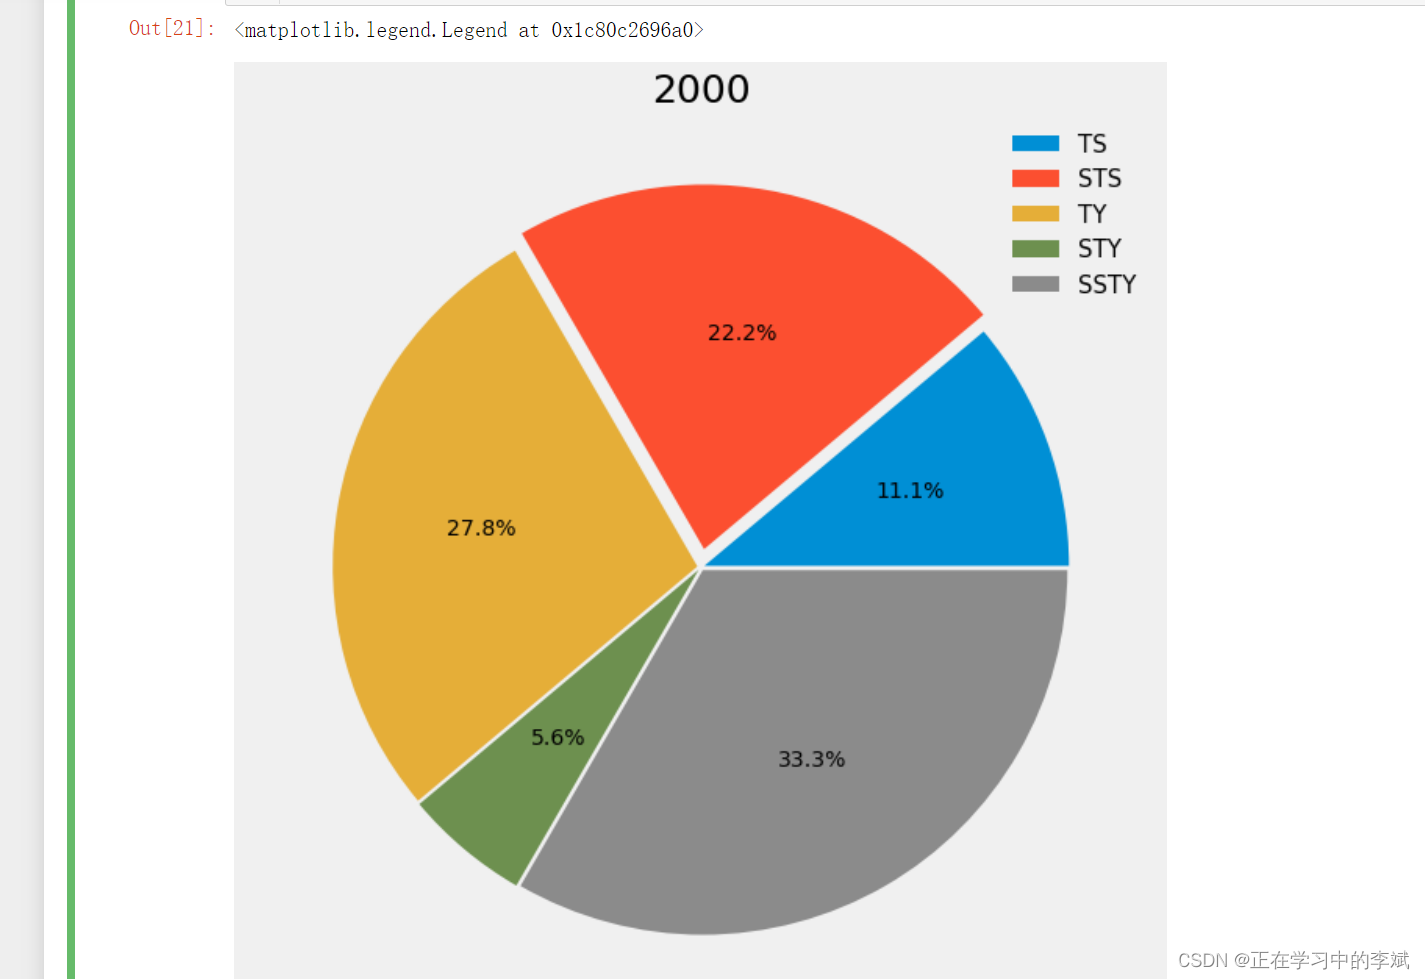
二、强调某一个模块。
在 ax.pie() 中传入参数 explode=(0.01, 0.05, 0.01, 0.01, 0.01), 可以改变间隔
在这里插入图片描述
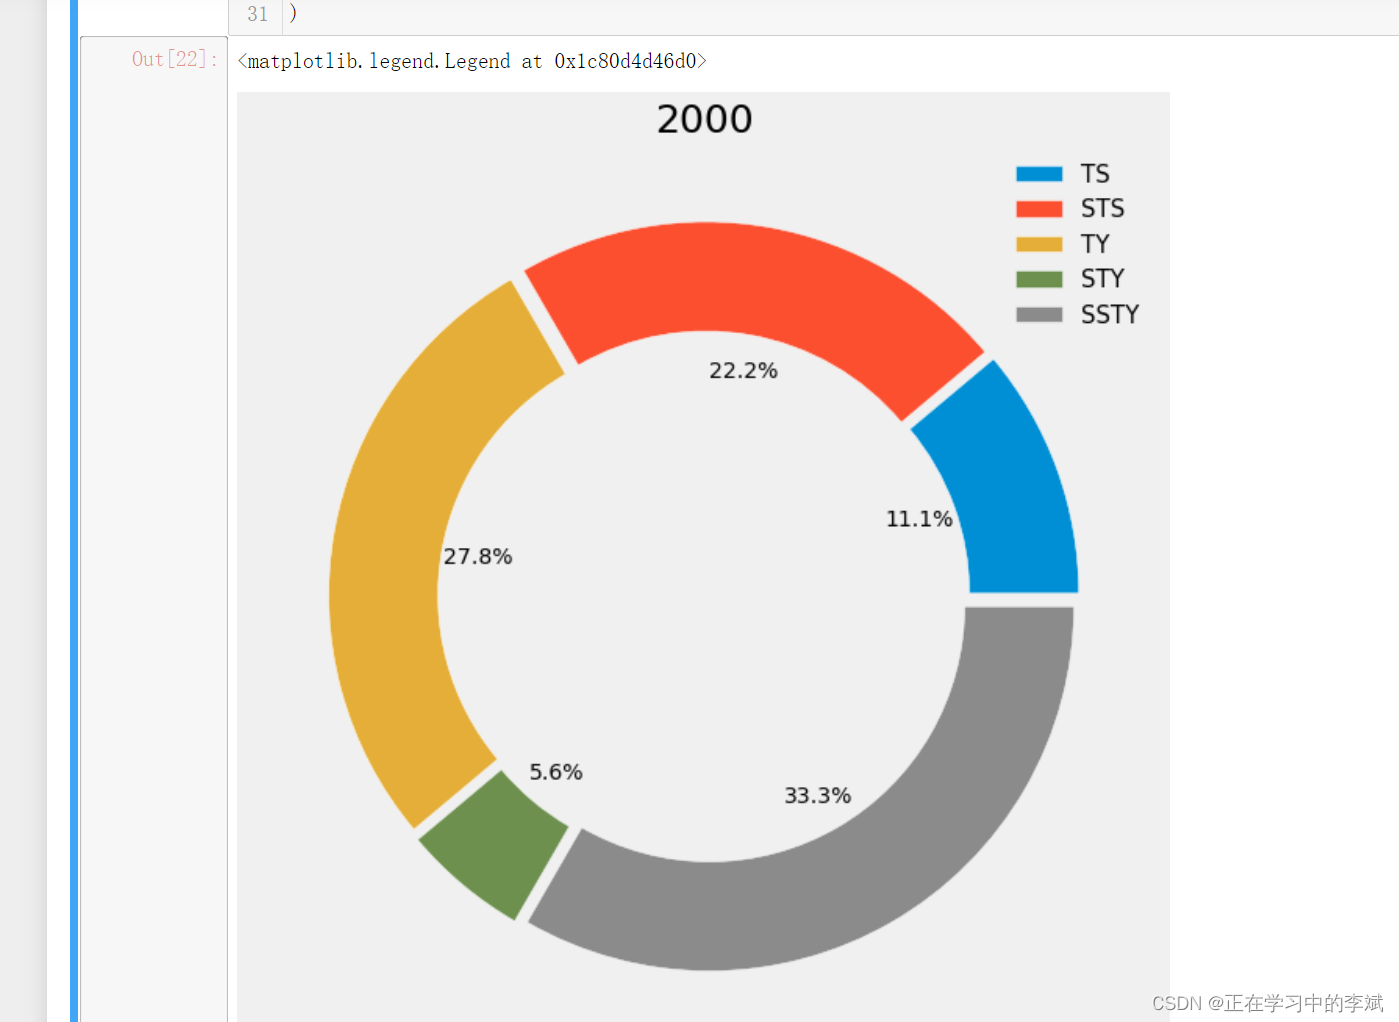
三、环形饼图
import pandas as pd
import matplotlib.pyplot as plt

plt.style.use('fivethirtyeight')

fig = plt.figure(figsize=(12,12))
ax = fig.add_subplot()
explode = (0.03, 0.03, 0.03, 0.03, 0.03,)


data = [2,4,5,1,6]
labels = ['TS','STS','TY','STY','SSTY']

wedges, texts, autotexts = ax.pie(
    data,
    autopct='%1.1f%%',
    # 设置各块之间的间隙
    explode=explode,
    # 设置30%的环形图,间距颜色为白色
    wedgeprops=dict(width=0.3, edgecolor='w')
)

ax.set_title(str(2000),fontsize=25)

ax.legend(
    wedges,
    labels,
    title="",
    prop={

    'size': 15},
    frameon=False
)