一、配置前说明:
1、phpStudy集成了XDebug扩展,所以不用单独下载XDebug。
2、打开XDebug扩展:其它选项菜单 > PHP扩展 > Xdebug
二、配置步骤:
1、phpStudy当前版本: 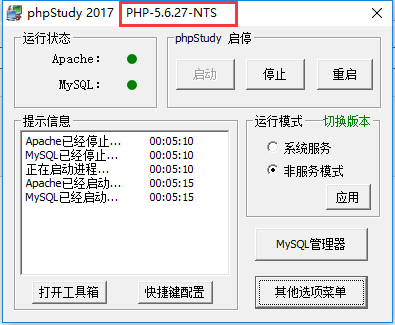
2、修改php.ini文件:

[XDebug]
xdebug.profiler_output_dir="D:\phpStudy\PHPTutorial\tmp\xdebug"
xdebug.trace_output_dir="D:\phpStudy\PHPTutorial\tmp\xdebug"
zend_extension="D:\phpStudy\PHPTutorial\php\php-5.6.27-nts\ext\php_xdebug.dll"
xdebug.remote_enable =1
xdebug.remote_handler = "dbgp"
xdebug.idekey = PHPSTORM
xdebug.remote_host = "127.0.0.1"
xdebug.remote_port = 9000
;是否允许Xdebug跟踪函数调用,跟踪信息以文件形式存储,默认值为0 xdebug.auto_trace=1 ;是否允许Xdebug跟踪函数参数,默认值为0 xdebug.collect_params=1 ;是否允许Xdebug跟踪函数返回值,默认值为0 xdebug.collect_return=1 ;函数调用跟踪信息输出文件目录,默认值为/tmp xdebug.trace_output_dir ="D:\myworkVIP\phpstudy\tmp\xdebug" ;性能分析文件的存放位置,默认值为/tmp xdebug.profiler_output_dir ="D:\myworkVIP\phpstudy\tmp\xdebug" ;打开xdebug的性能分析器,以文件形式存储,这项配置是不能以ini_set()函数配置的,默认值为0 xdebug.profiler_enable = 1 ;性能分析文件的命名规则,默认值为cachegrind.out.%p xdebug.profiler_output_name = "cachegrind.out.%t.%p" xdebug.remote_enable = 1 ;用于zend studio远程调试的应用层通信协议 xdebug.remote_handler = "dbgp" xdebug.idekey = PHPSTORM xdebug.remote_host = "127.0.0.1" xdebug.remote_port = 9000 3、选择PHP版本: 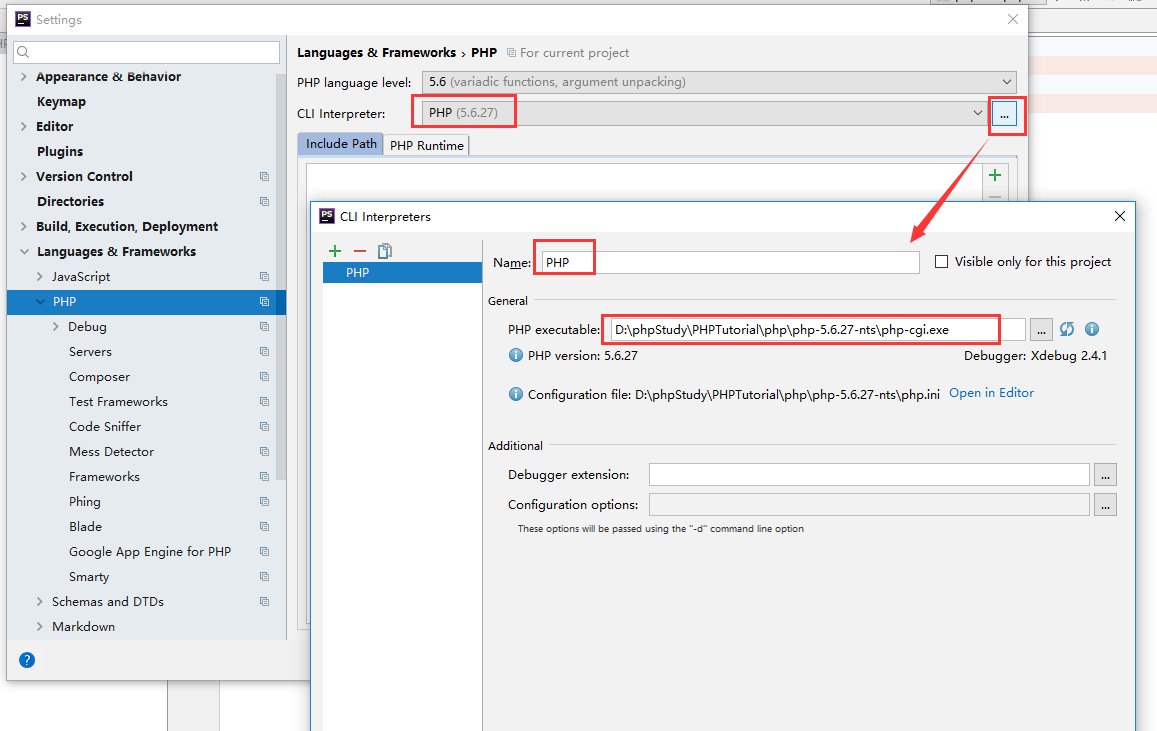
4、Debug端口: 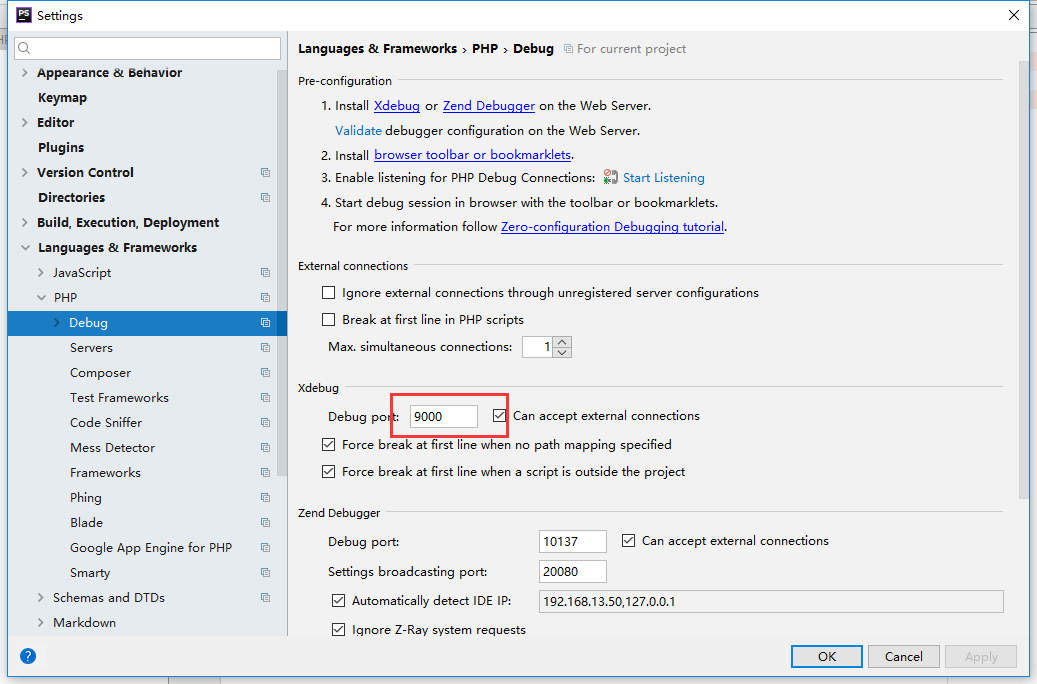
5、IDEKEY: 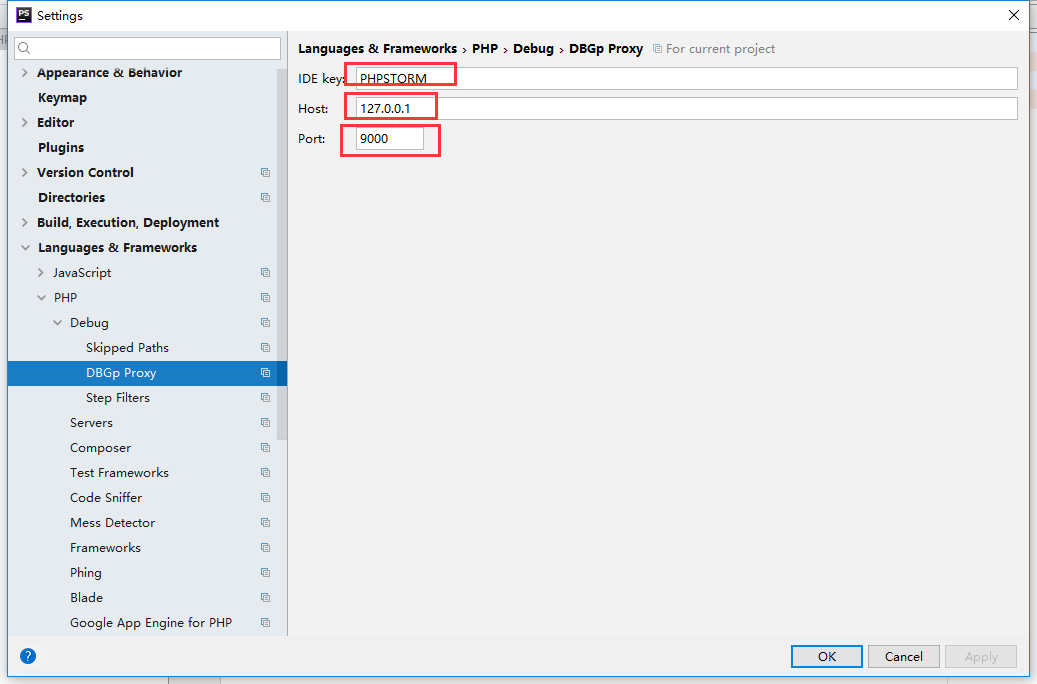
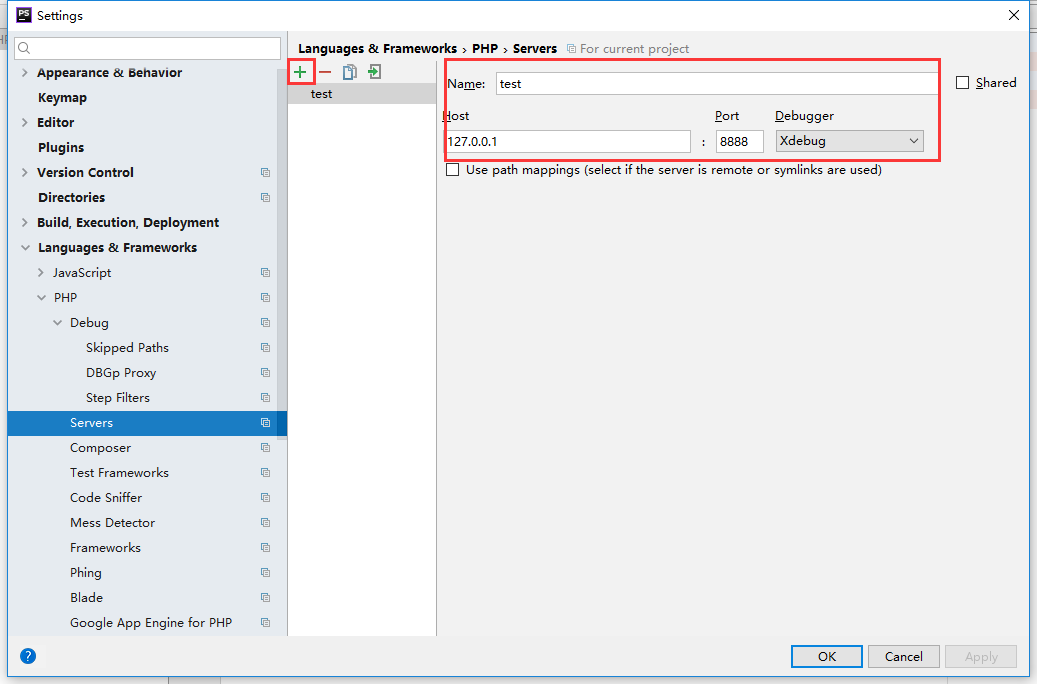
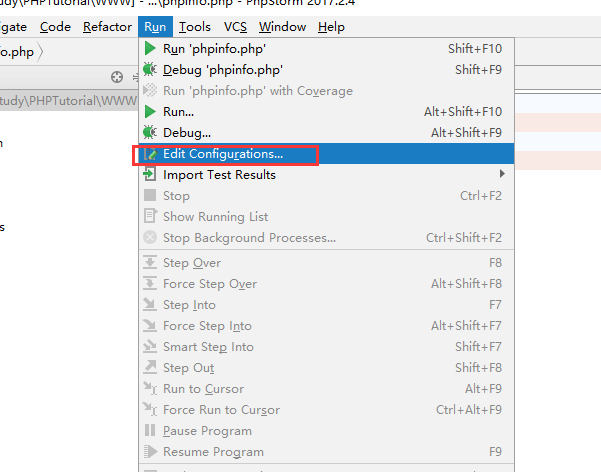
6、配置:
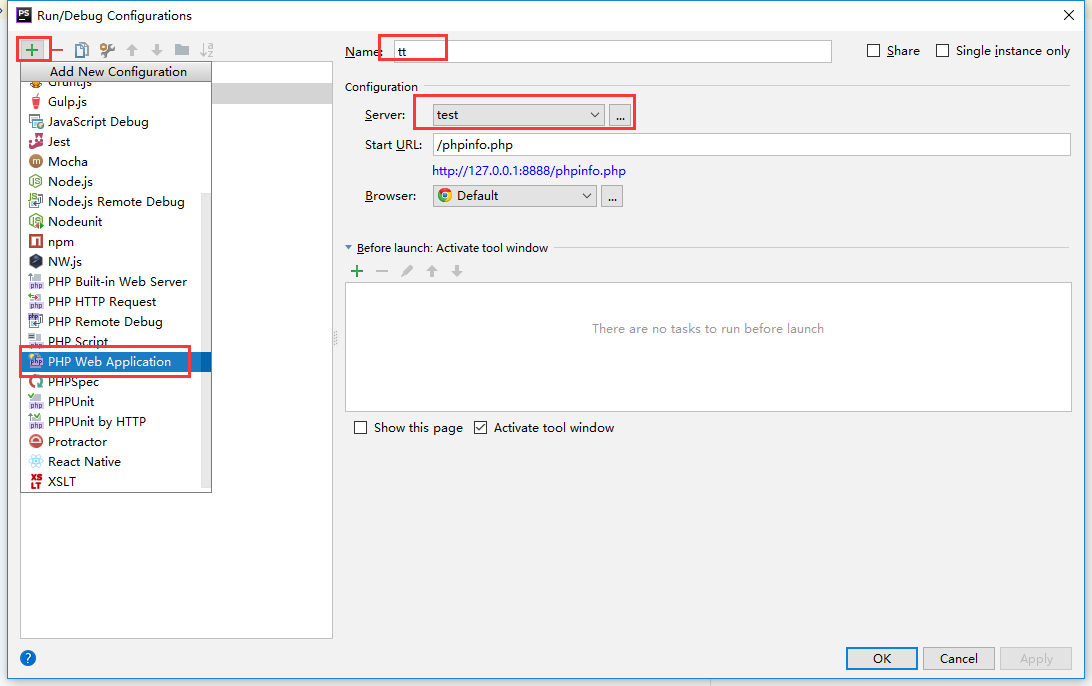
7、查看配置: 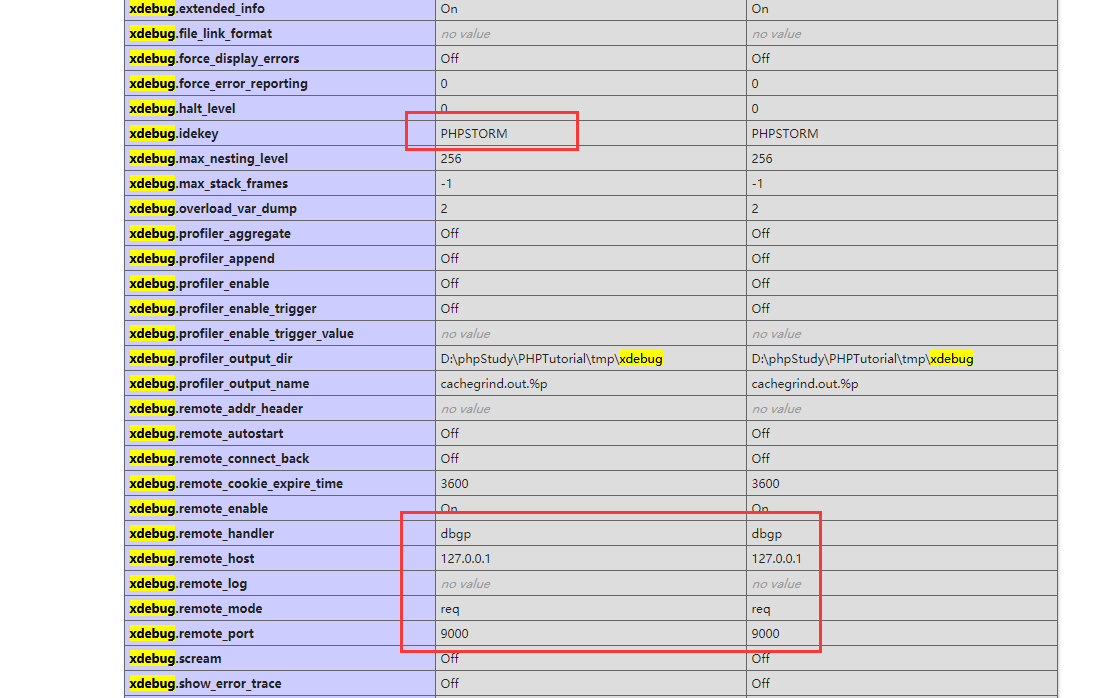
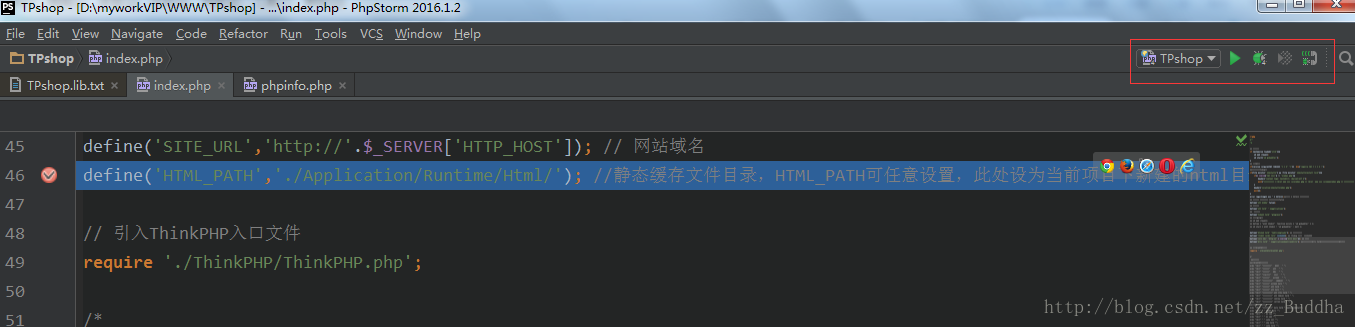
三、调试:
1、开启调试: