版权声明:本文为博主原创文章,未经博主允许不得转载。 https://blog.csdn.net/Amelia__Liu/article/details/90680289
1.官网下载PHPStorm与PHPStudy集成环境
PHPStorm在去这里获取激活码:http://idea.lanyus.com
2.正式配置:
一、配置前说明:
1、phpStudy集成了XDebug扩展,所以不用单独下载XDebug。
2、打开XDebug扩展:其它选项菜单 > PHP扩展 > Xdebug
二、配置步骤:
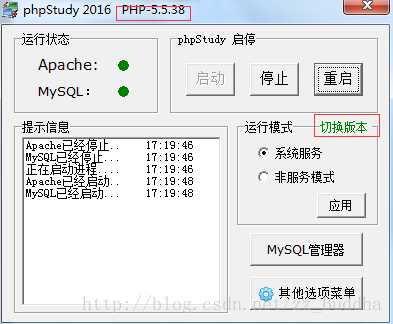
1、phpStudy当前版本:
2、修改php.ini文件:
[XDebug]
xdebug.profiler_output_dir="C:\Users\Admin\Desktop\app\phpStudy\PHPTutorial\tmp\xdebug"
;设置的函数调用监测信息的输出路径
xdebug.trace_output_dir="C:\Users\Admin\Desktop\app\phpStudy\PHPTutorial\tmp\xdebug"
;.dll文件的路径
zend_extension="C:\Users\Admin\Desktop\app\phpStudy\PHPTutorial\php\php-5.4.45\ext\php_xdebug.dll"
xdebug.profiler_append = 0
;效能监测的设置开关
xdebug.profiler_enable = 0
xdebug.profiler_enable_trigger = 0
;profiler_enable设置为1的时候,效能监测信息写入文件所在的目录
;生成的效能监测文件的名字
xdebug.profiler_output_name ="cache.out.%t-%s"
; IDE与XDebug协作
xdebug.remote_enable = 1
; 用于zend studio远程调试的应用层通信协议
xdebug.remote_handler = "dbgp"
xdebug.remote_host = "127.0.0.1"
xdebug.remote_port = 9000
xdebug.idekey = phpstorm-xdebug
可以直接拷贝到最后【xdebug部分】,除了前三个目录变动为你本地安装路径,非必要就都不要改
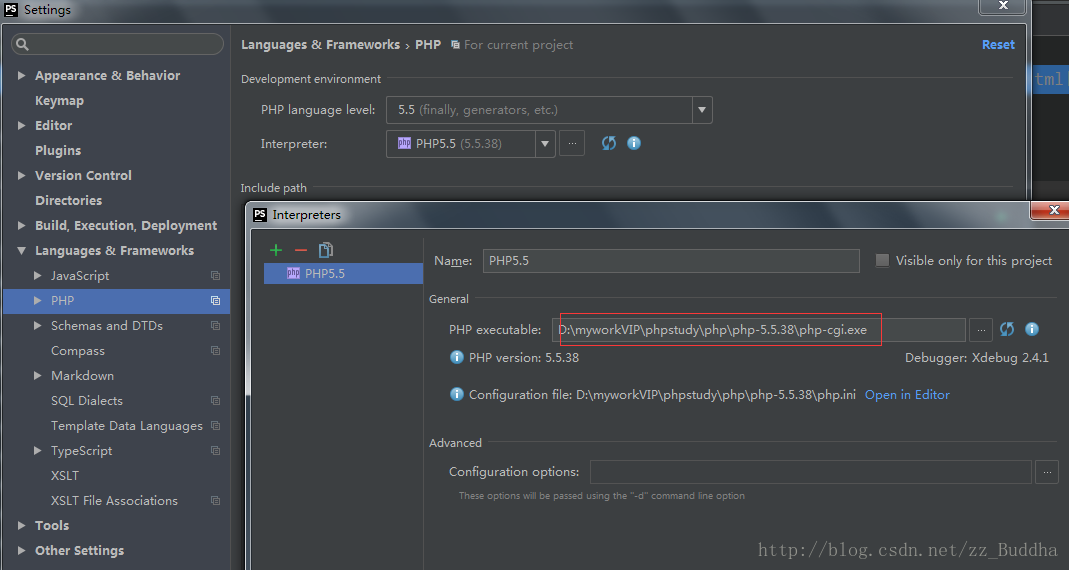
3、选择PHP版本:
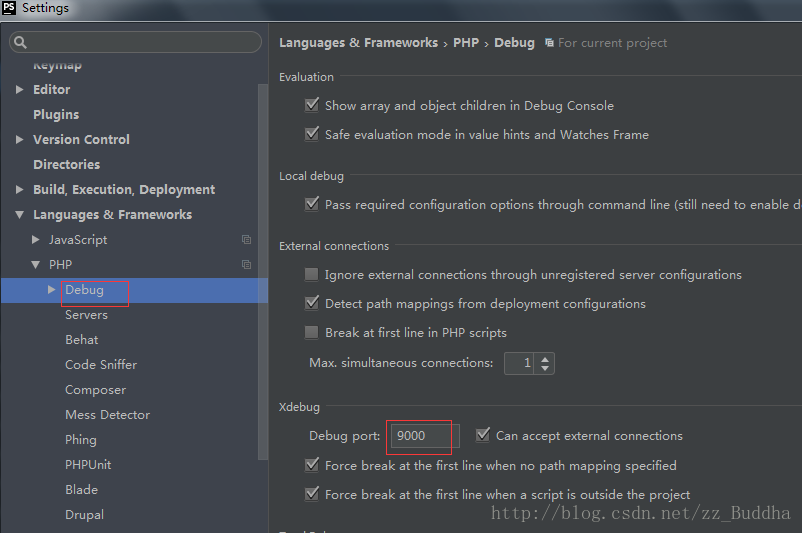
4、Debug端口: (同php配置文件的xdebug.remote_port参数值)
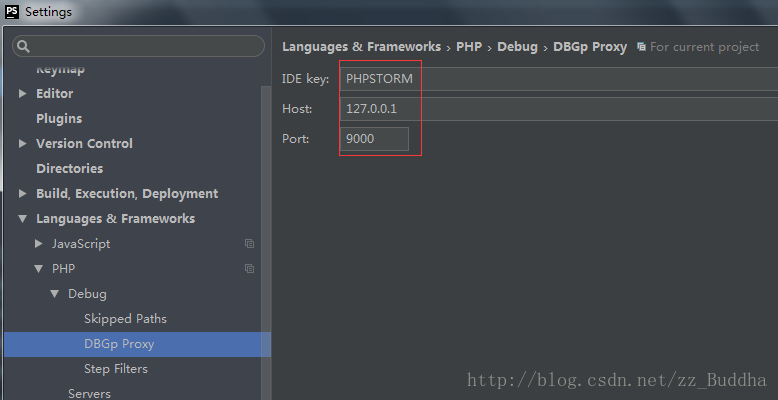
5、IDEKEY: (同php配置文件的xdebug.idekey参数值)
6、配置: 


7. 谷歌浏览器配置
下载扩展程序:
Xdebug helper


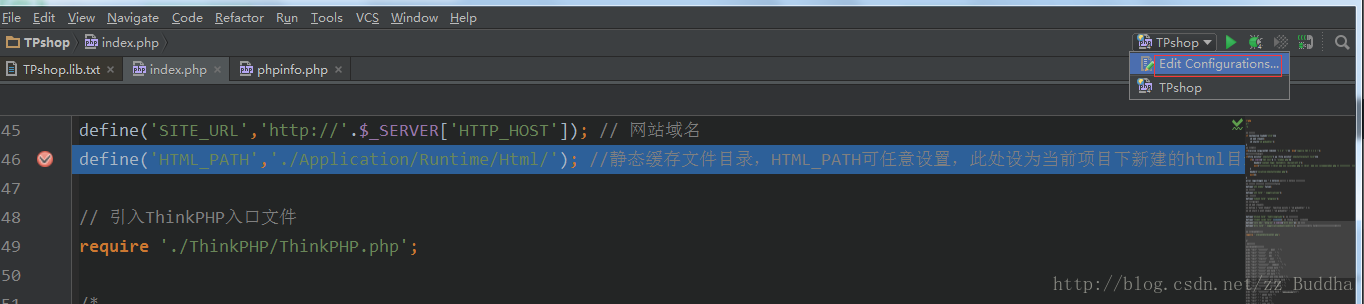
8.phpstorm

点击这个电话打开调试 图中现在是关闭状态
9.配置完毕 访问项目就能开始断点调试