clear all;
clf;
[X,Y,Z,V]=flow;
x1=min(min(min(X)));
x2=max(max(max(X)));
y1=min(min(min(Y)));
y2=max(max(max(Y)));
z1=min(min(min(Z)));
z2=max(max(max(Z)));
s1=linspace(x1+1.2,x2,5);
s2=0;
s3=0;
slice(X,Y,Z,V,s1,s2,s3);
view([-30,38]);
shading interp;
colormap parula;
%以下指令为设置图形的透明度
alpha('color');
alphamap('rampdown');
alphamap('increase',0.14);
colorbar;
axis off
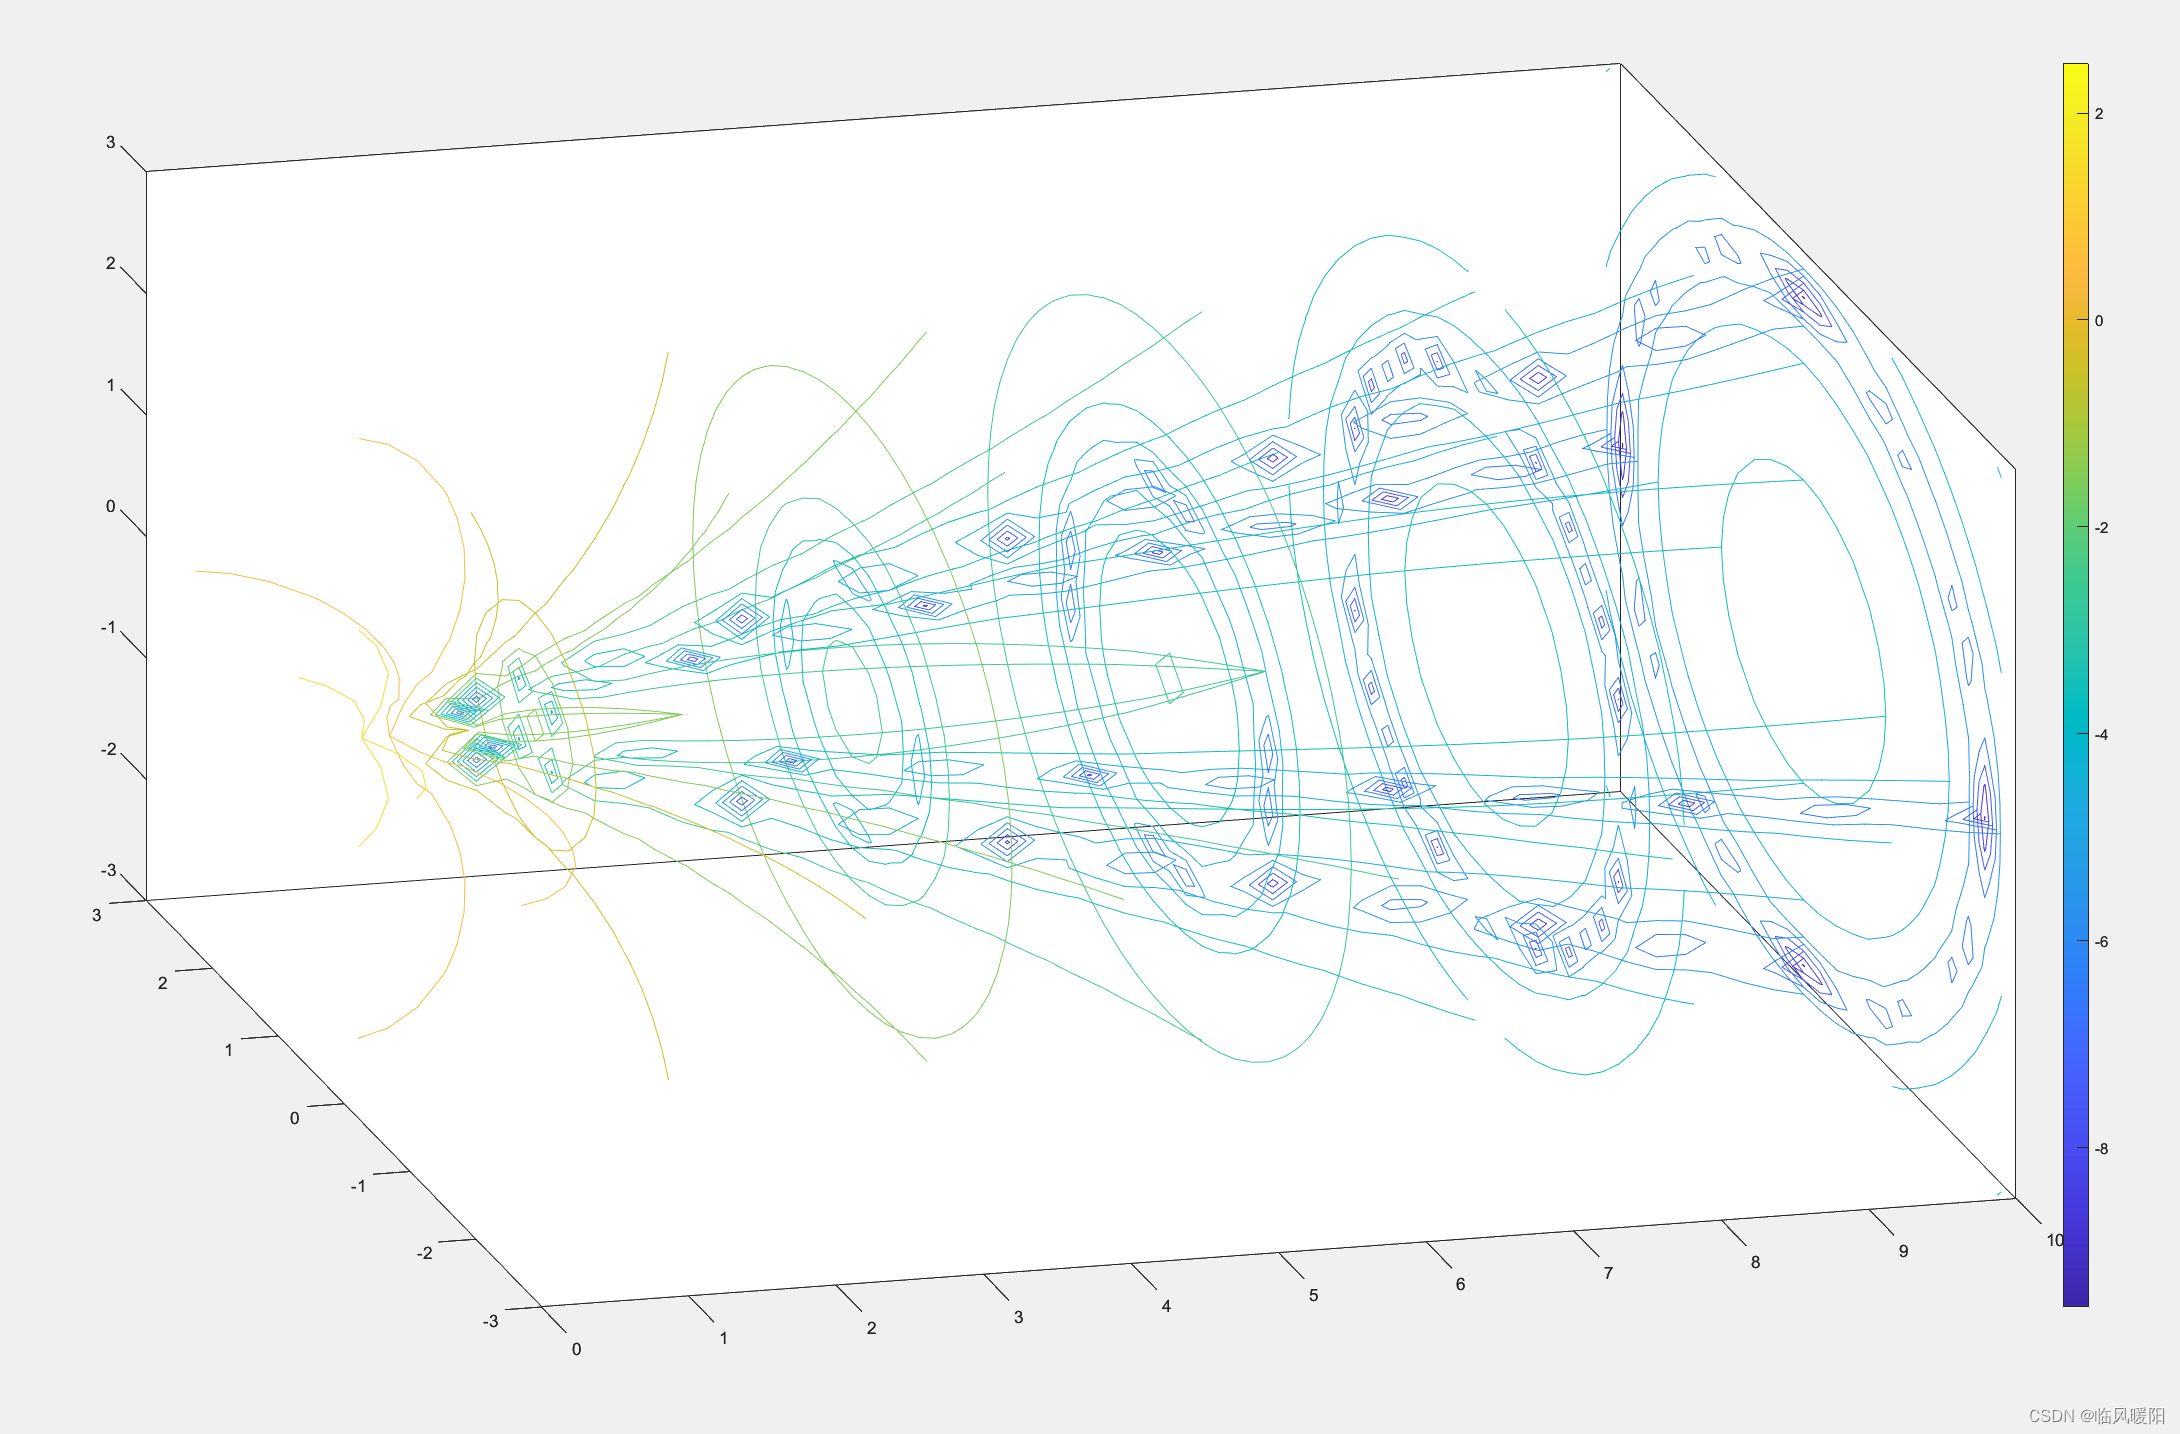
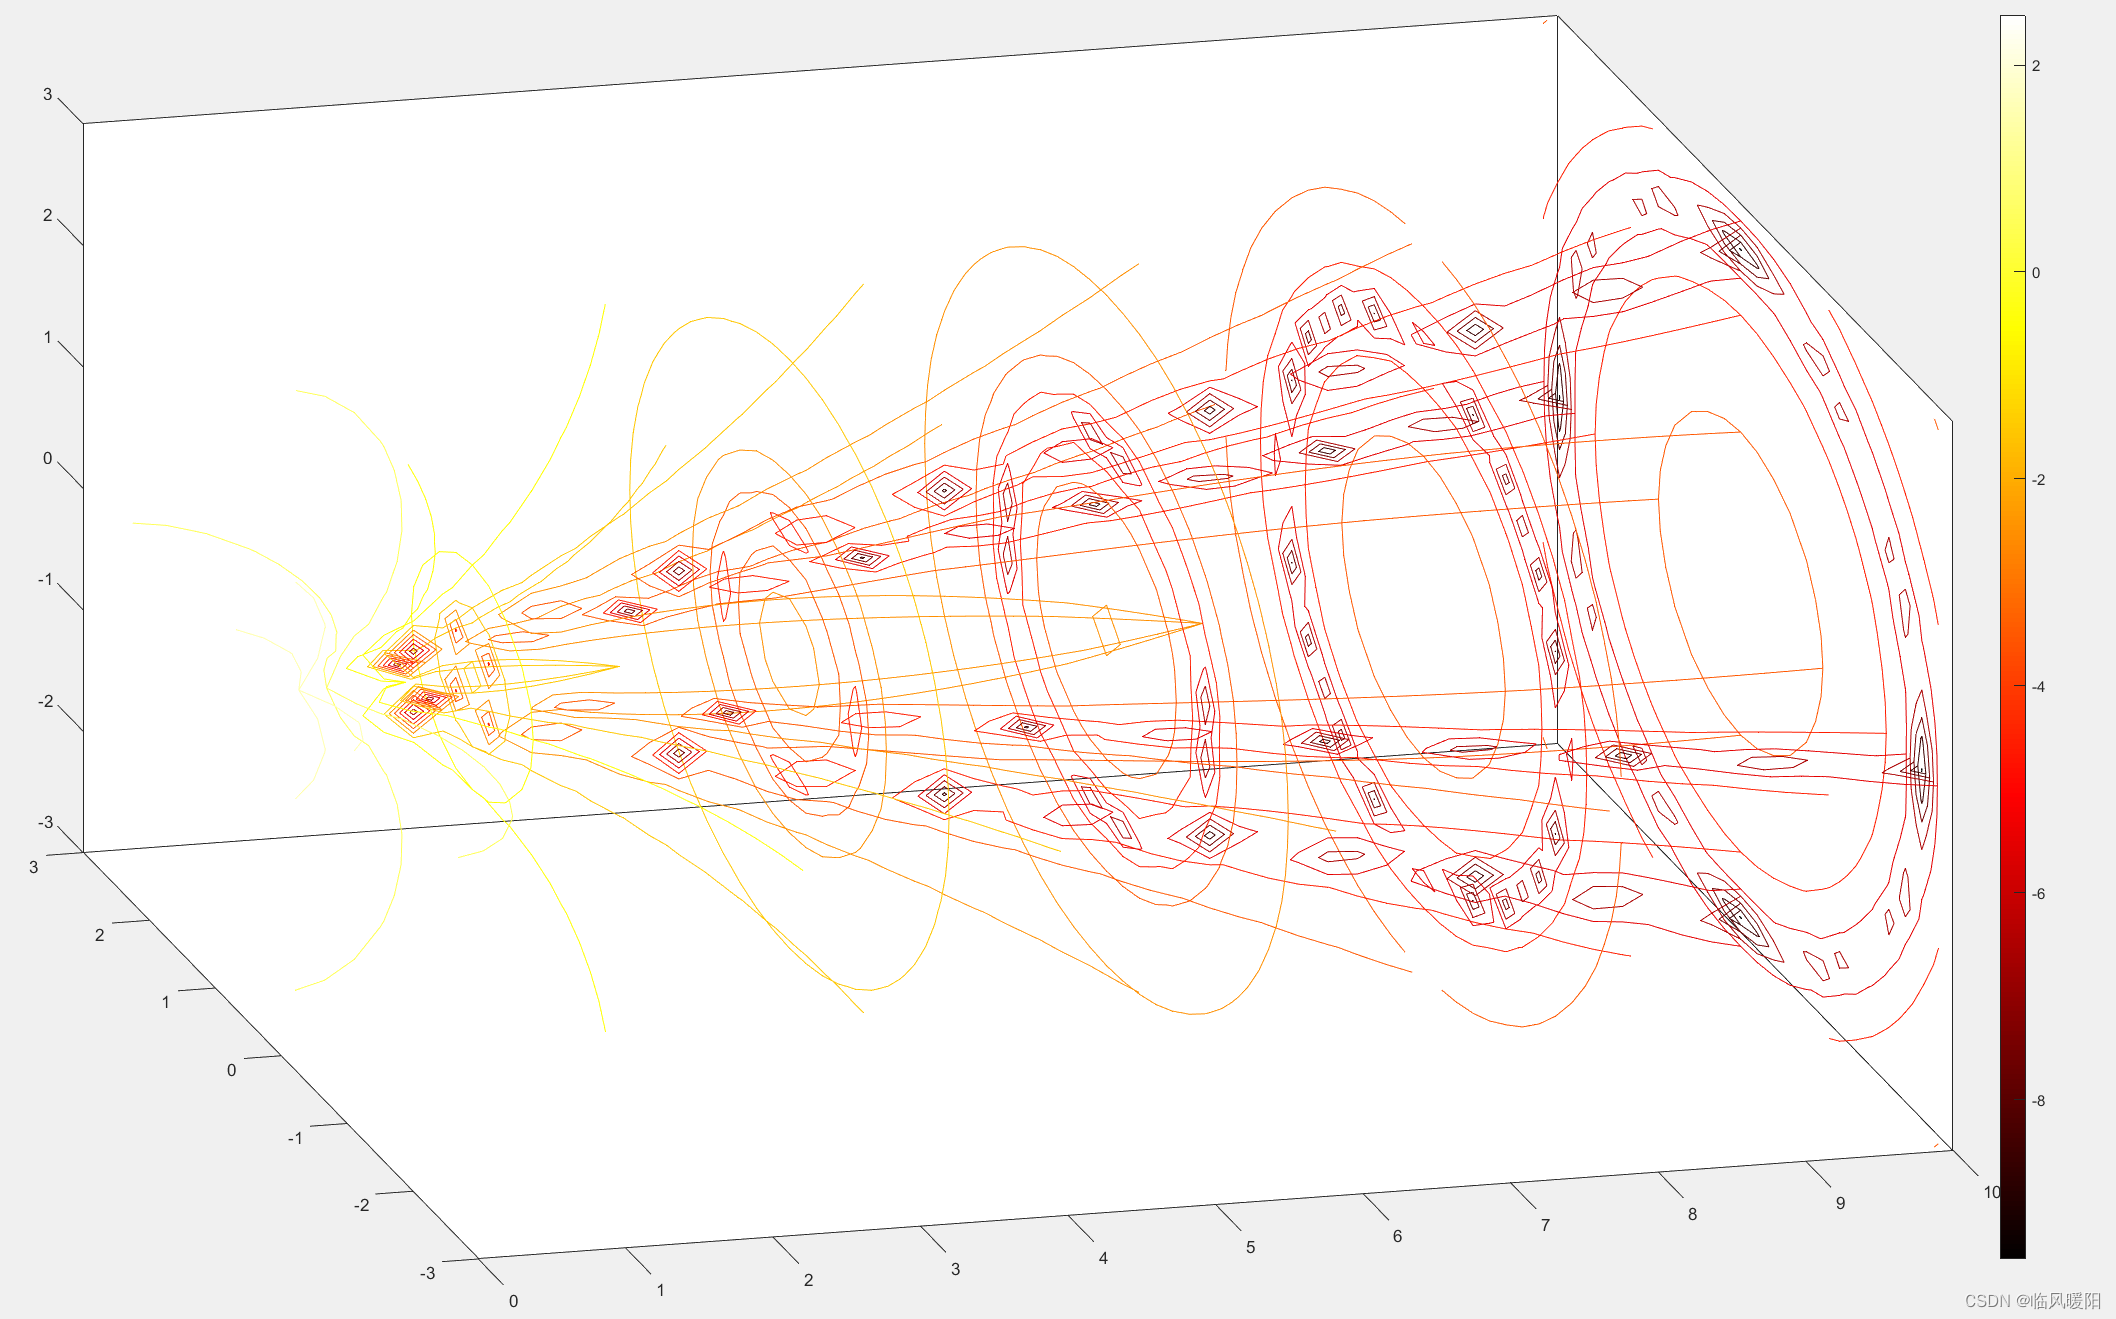
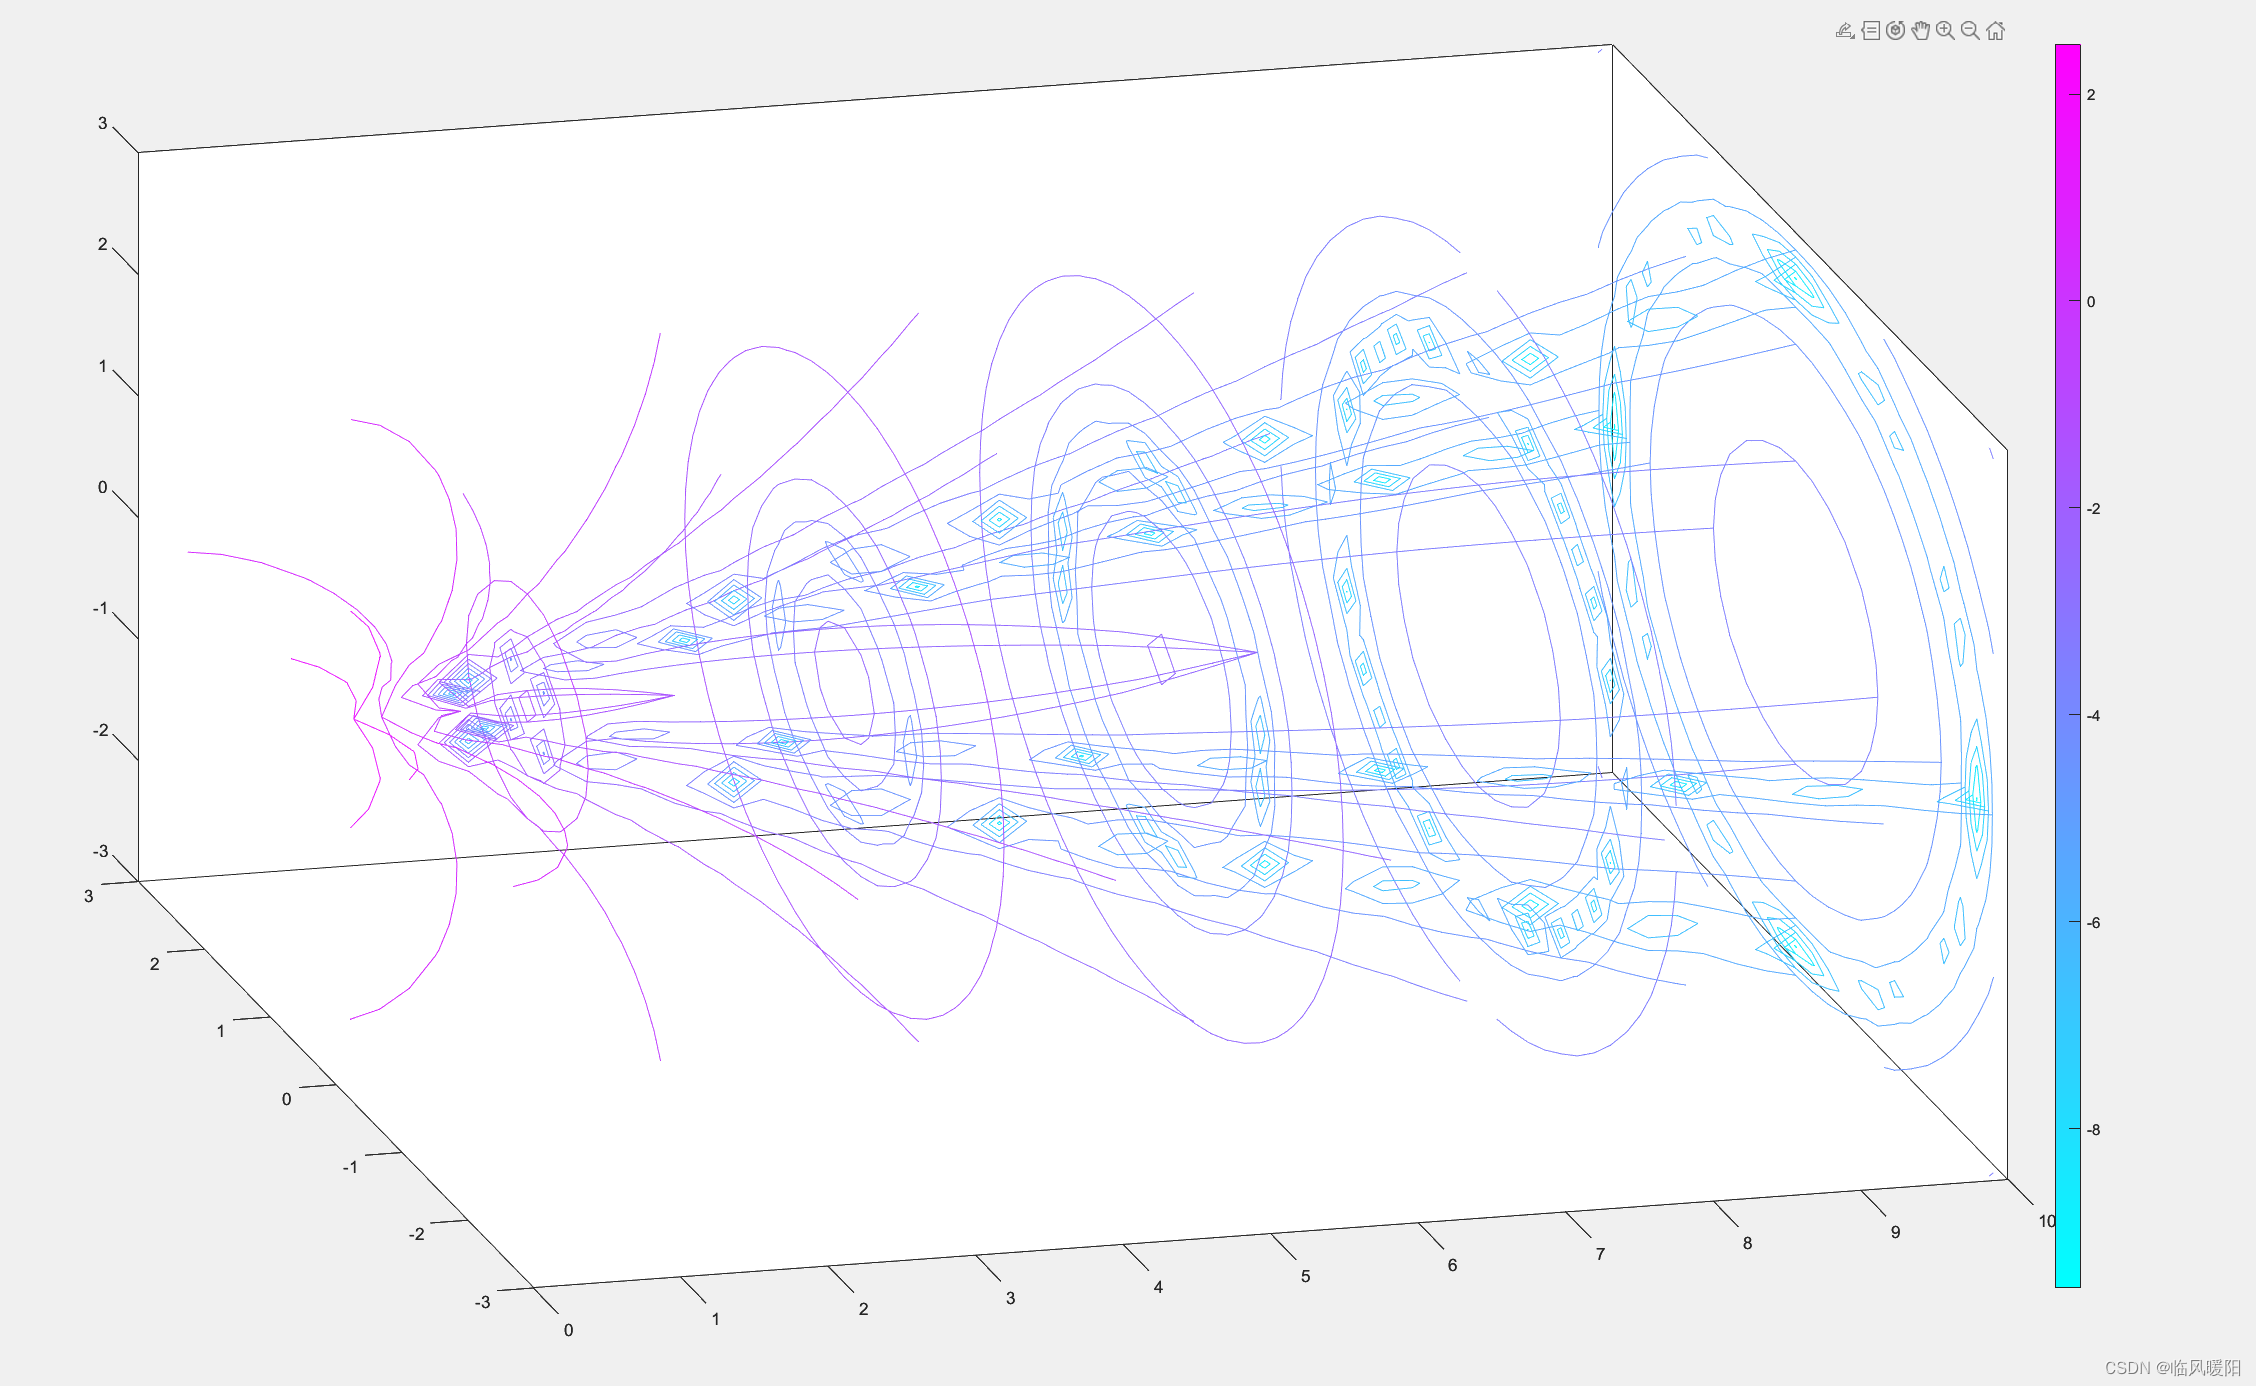
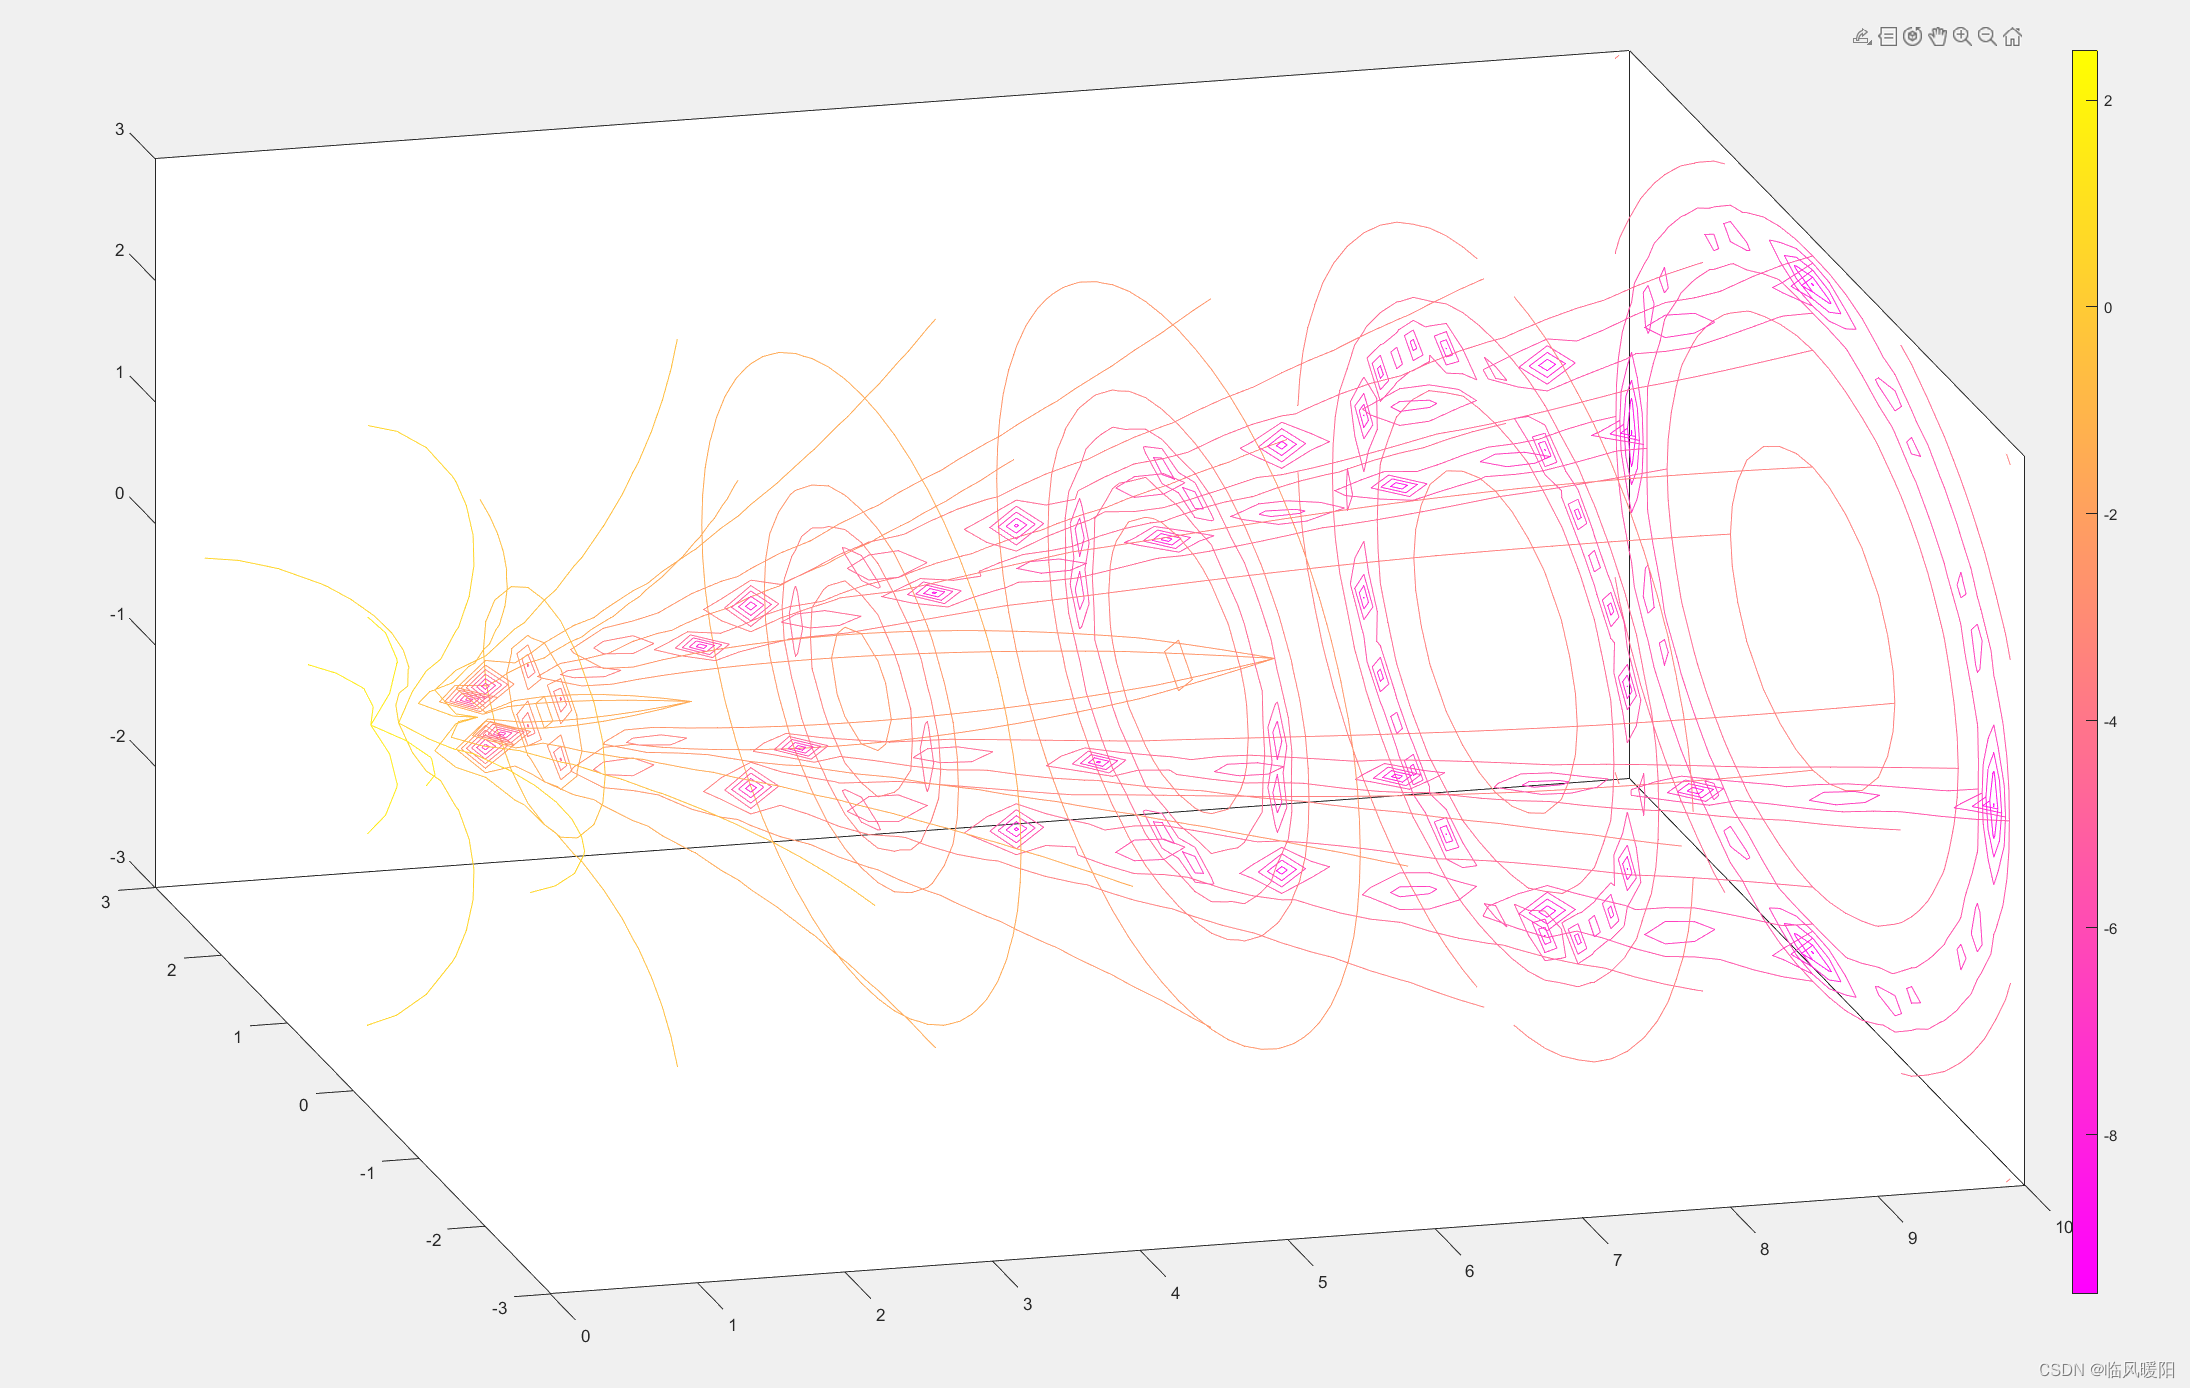
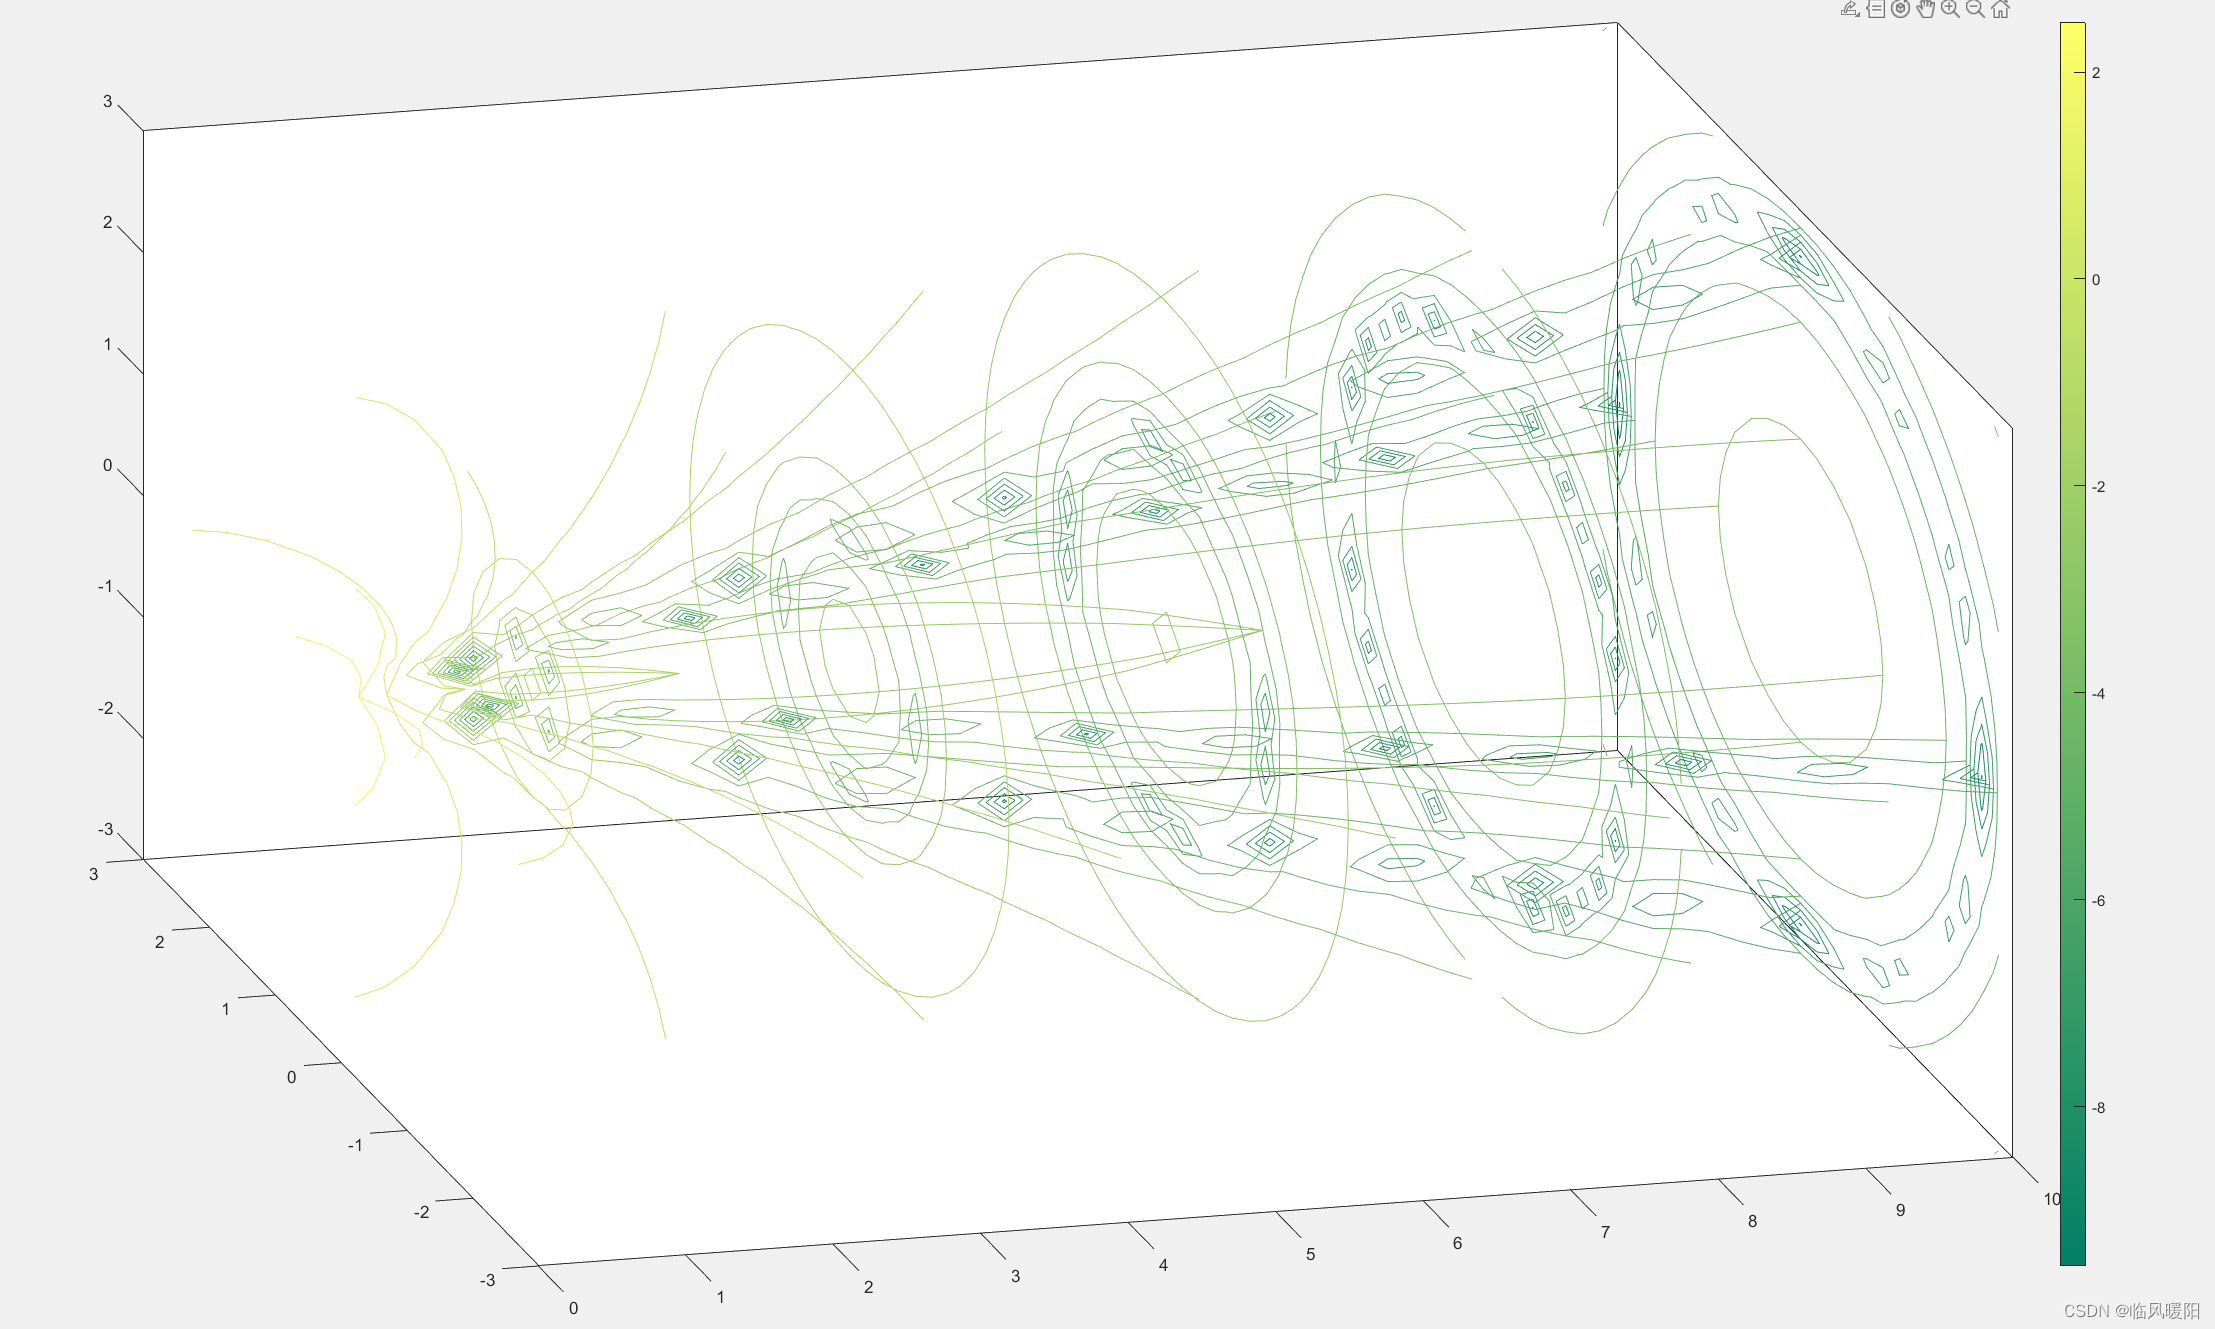
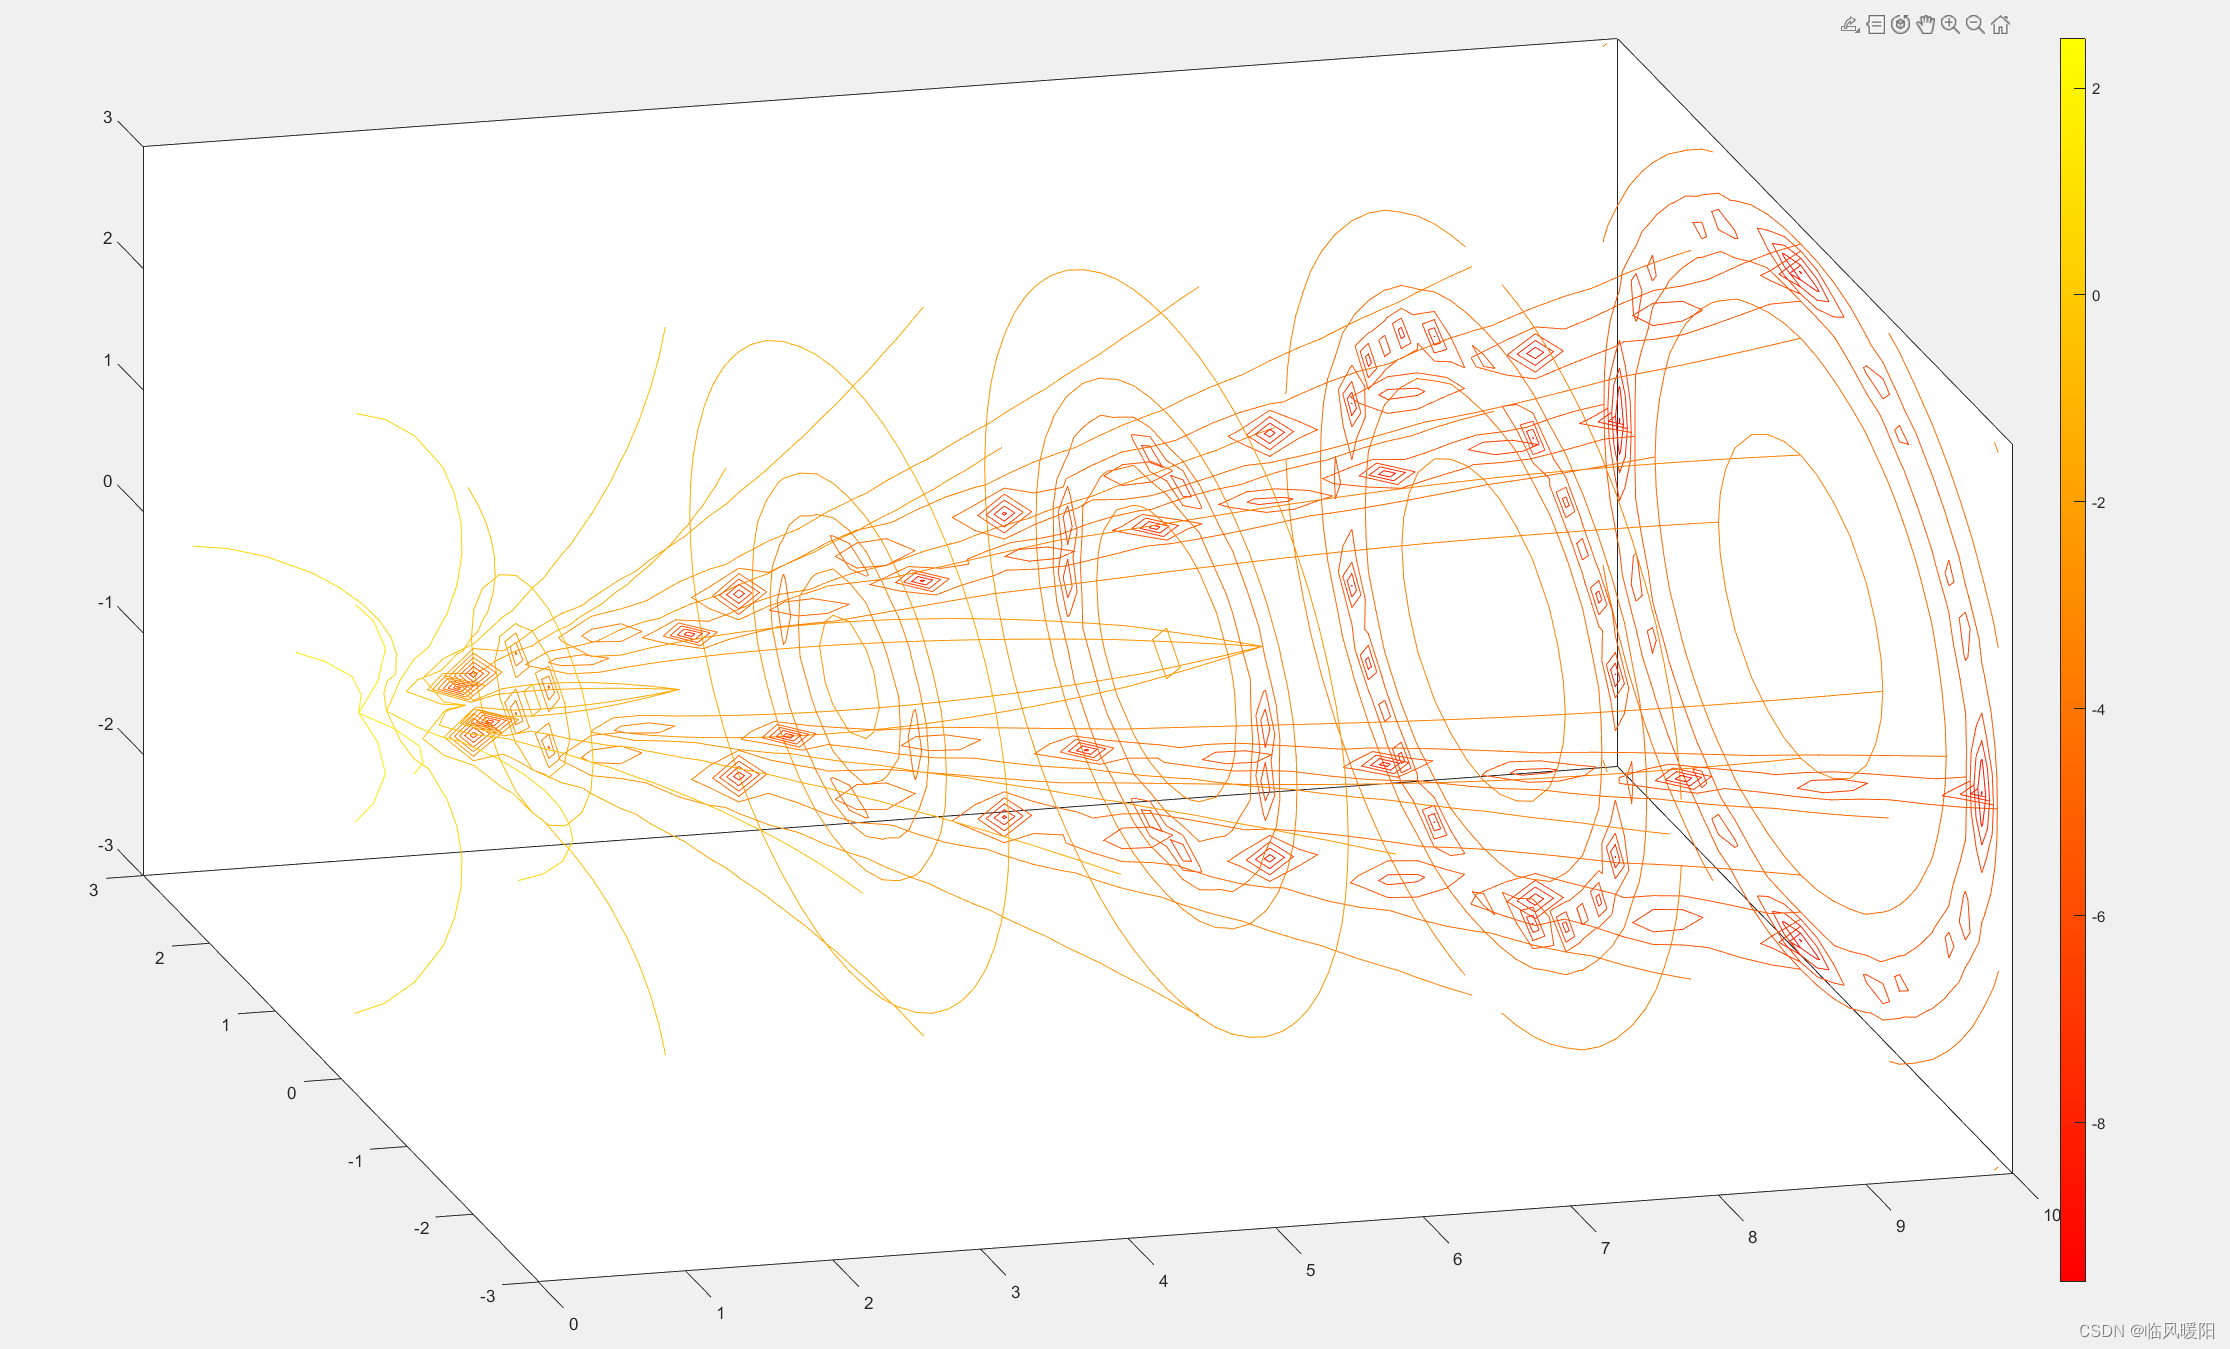
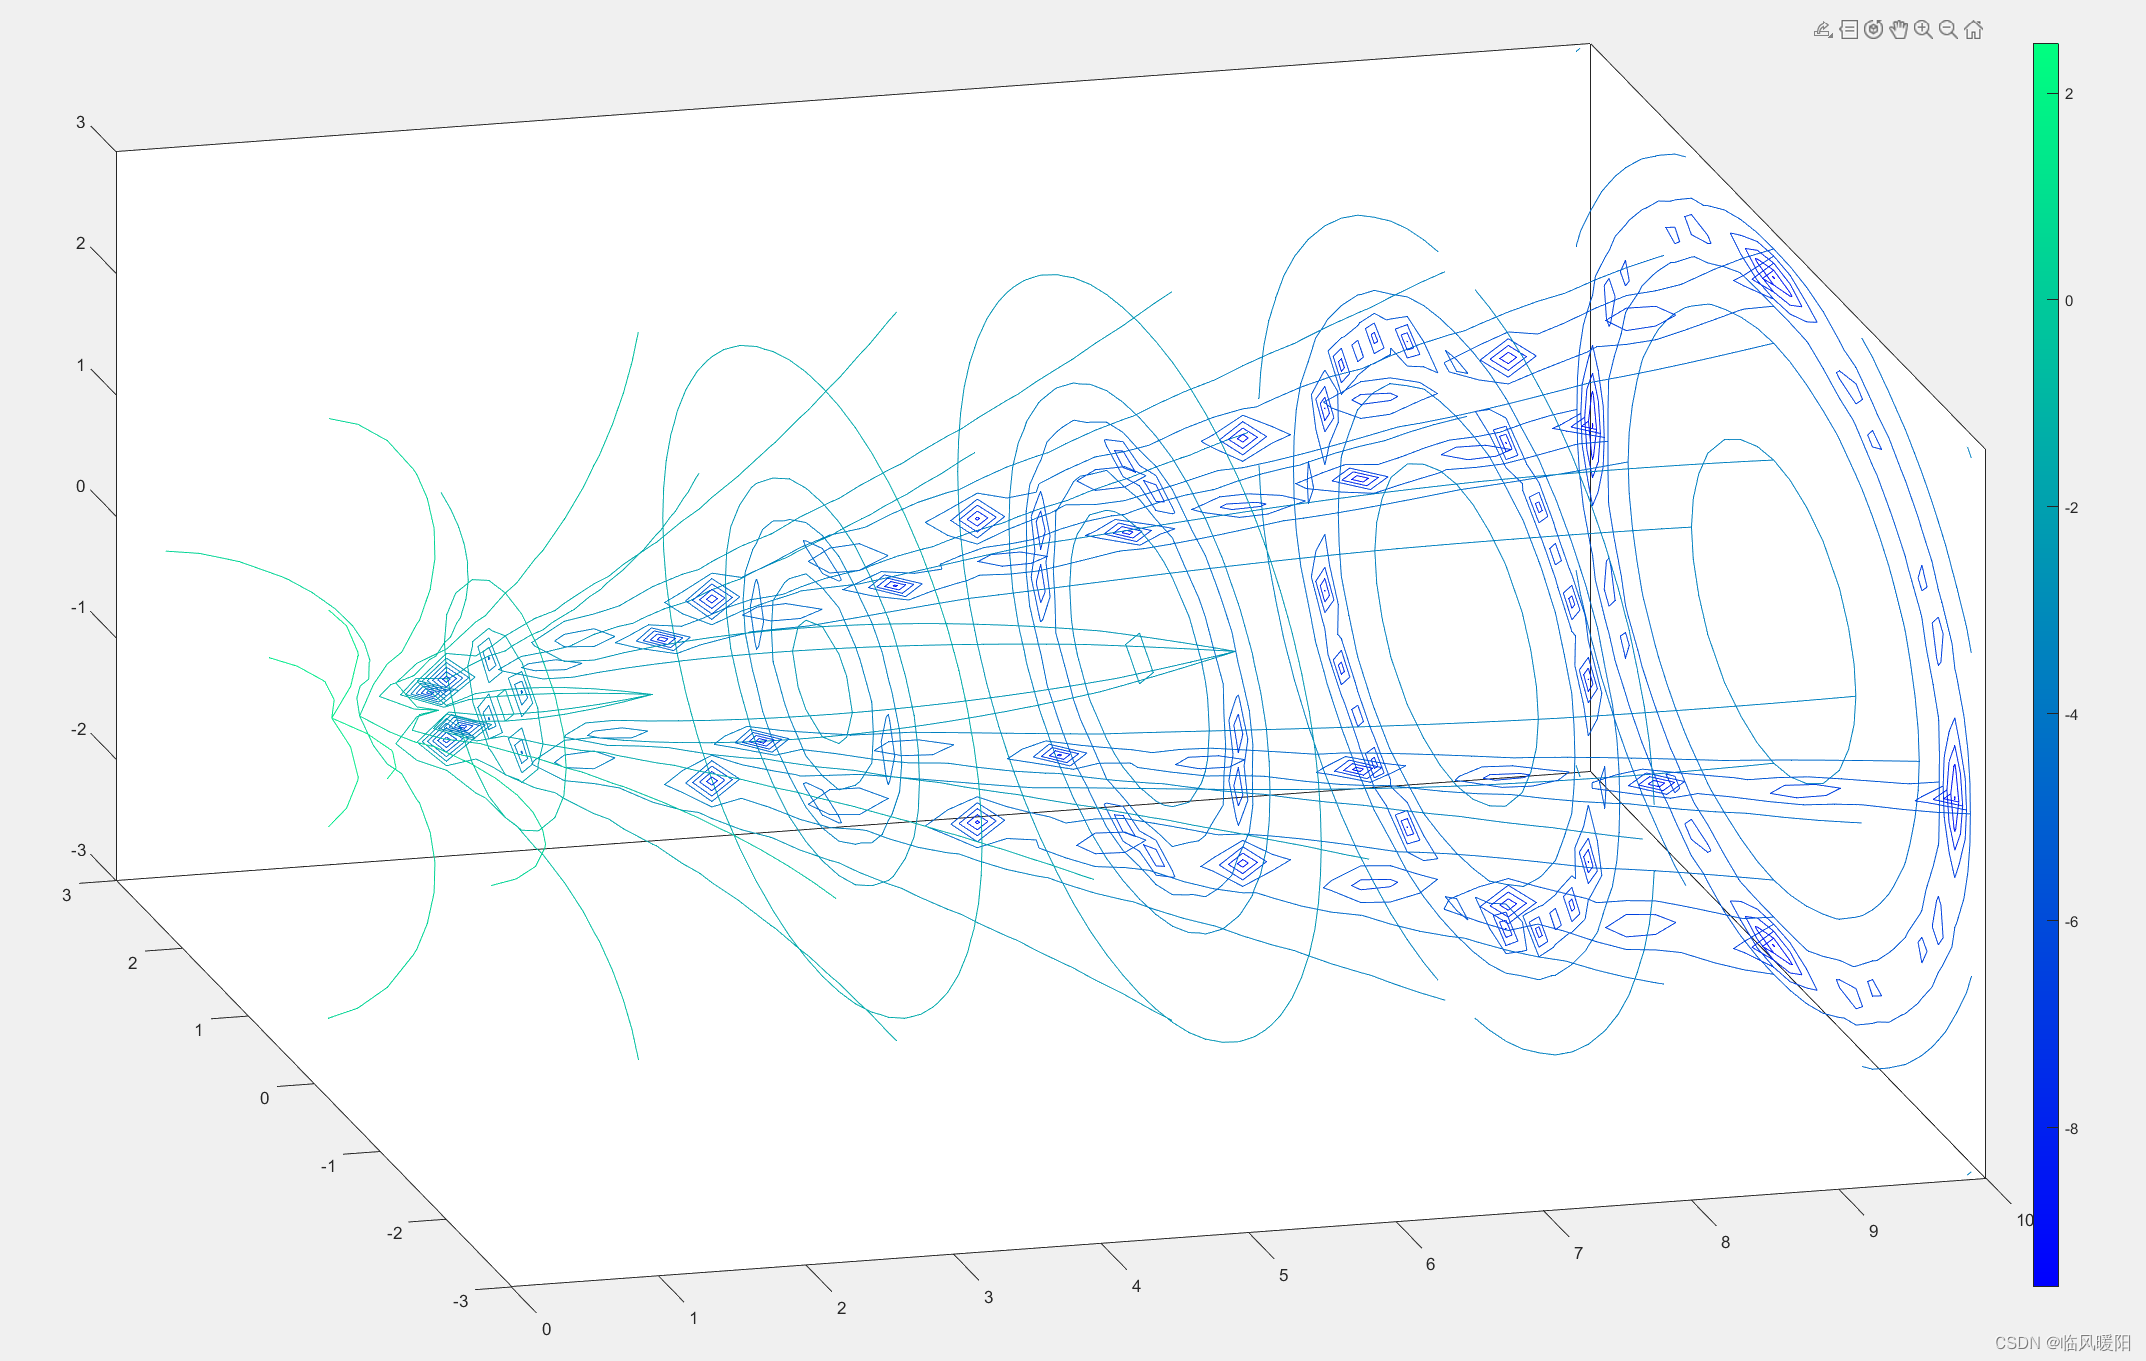
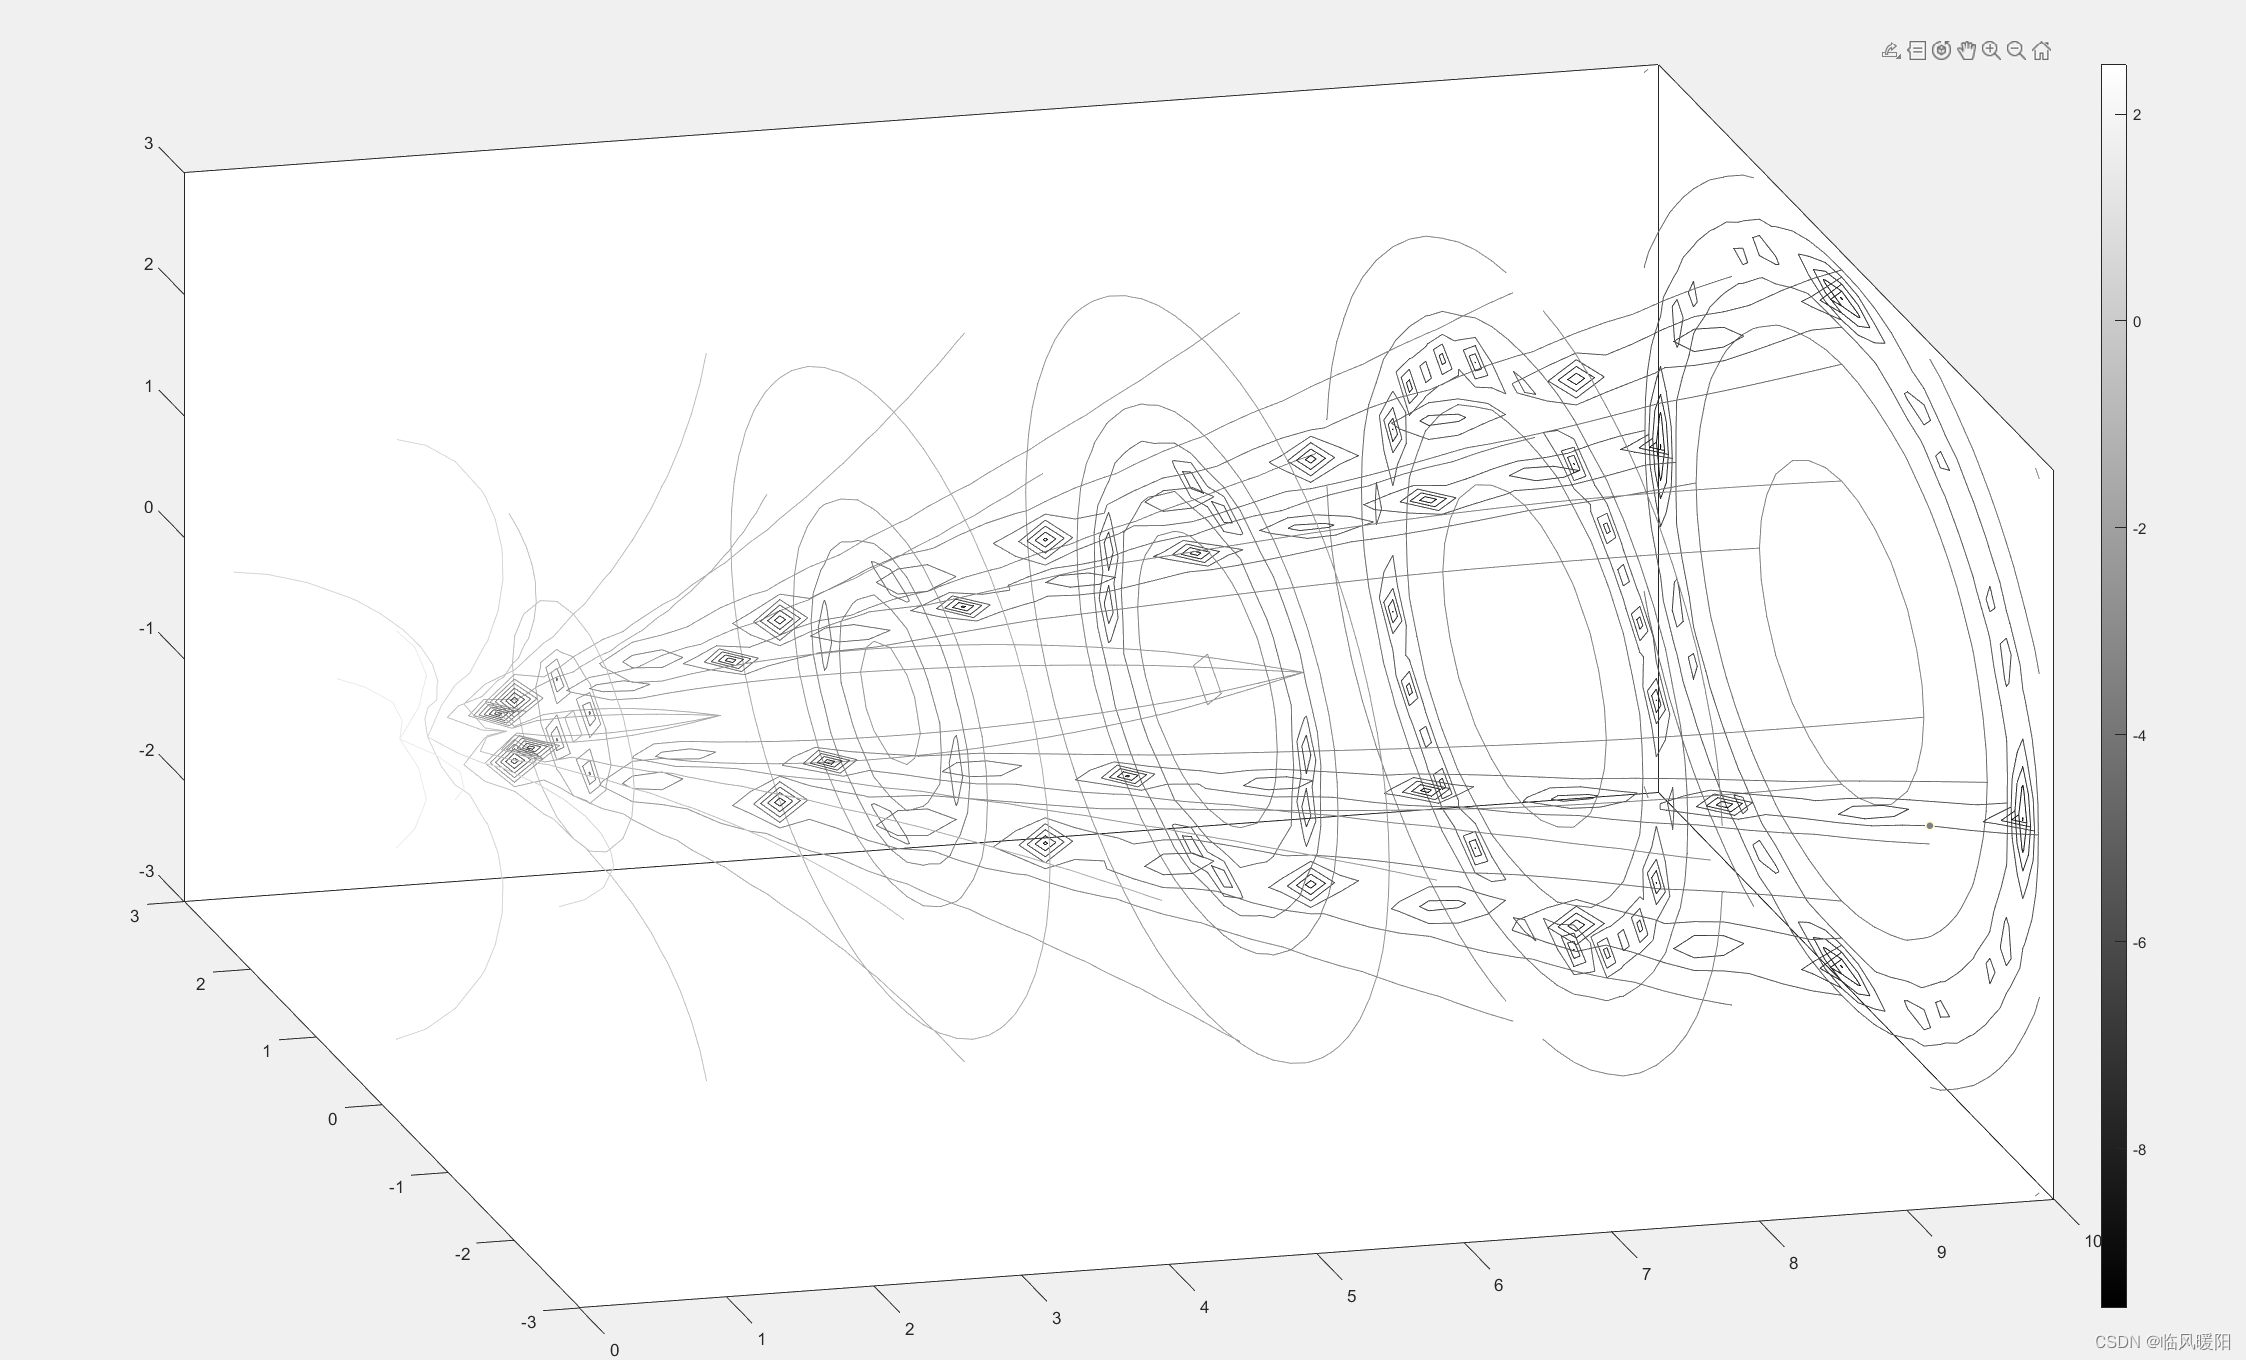
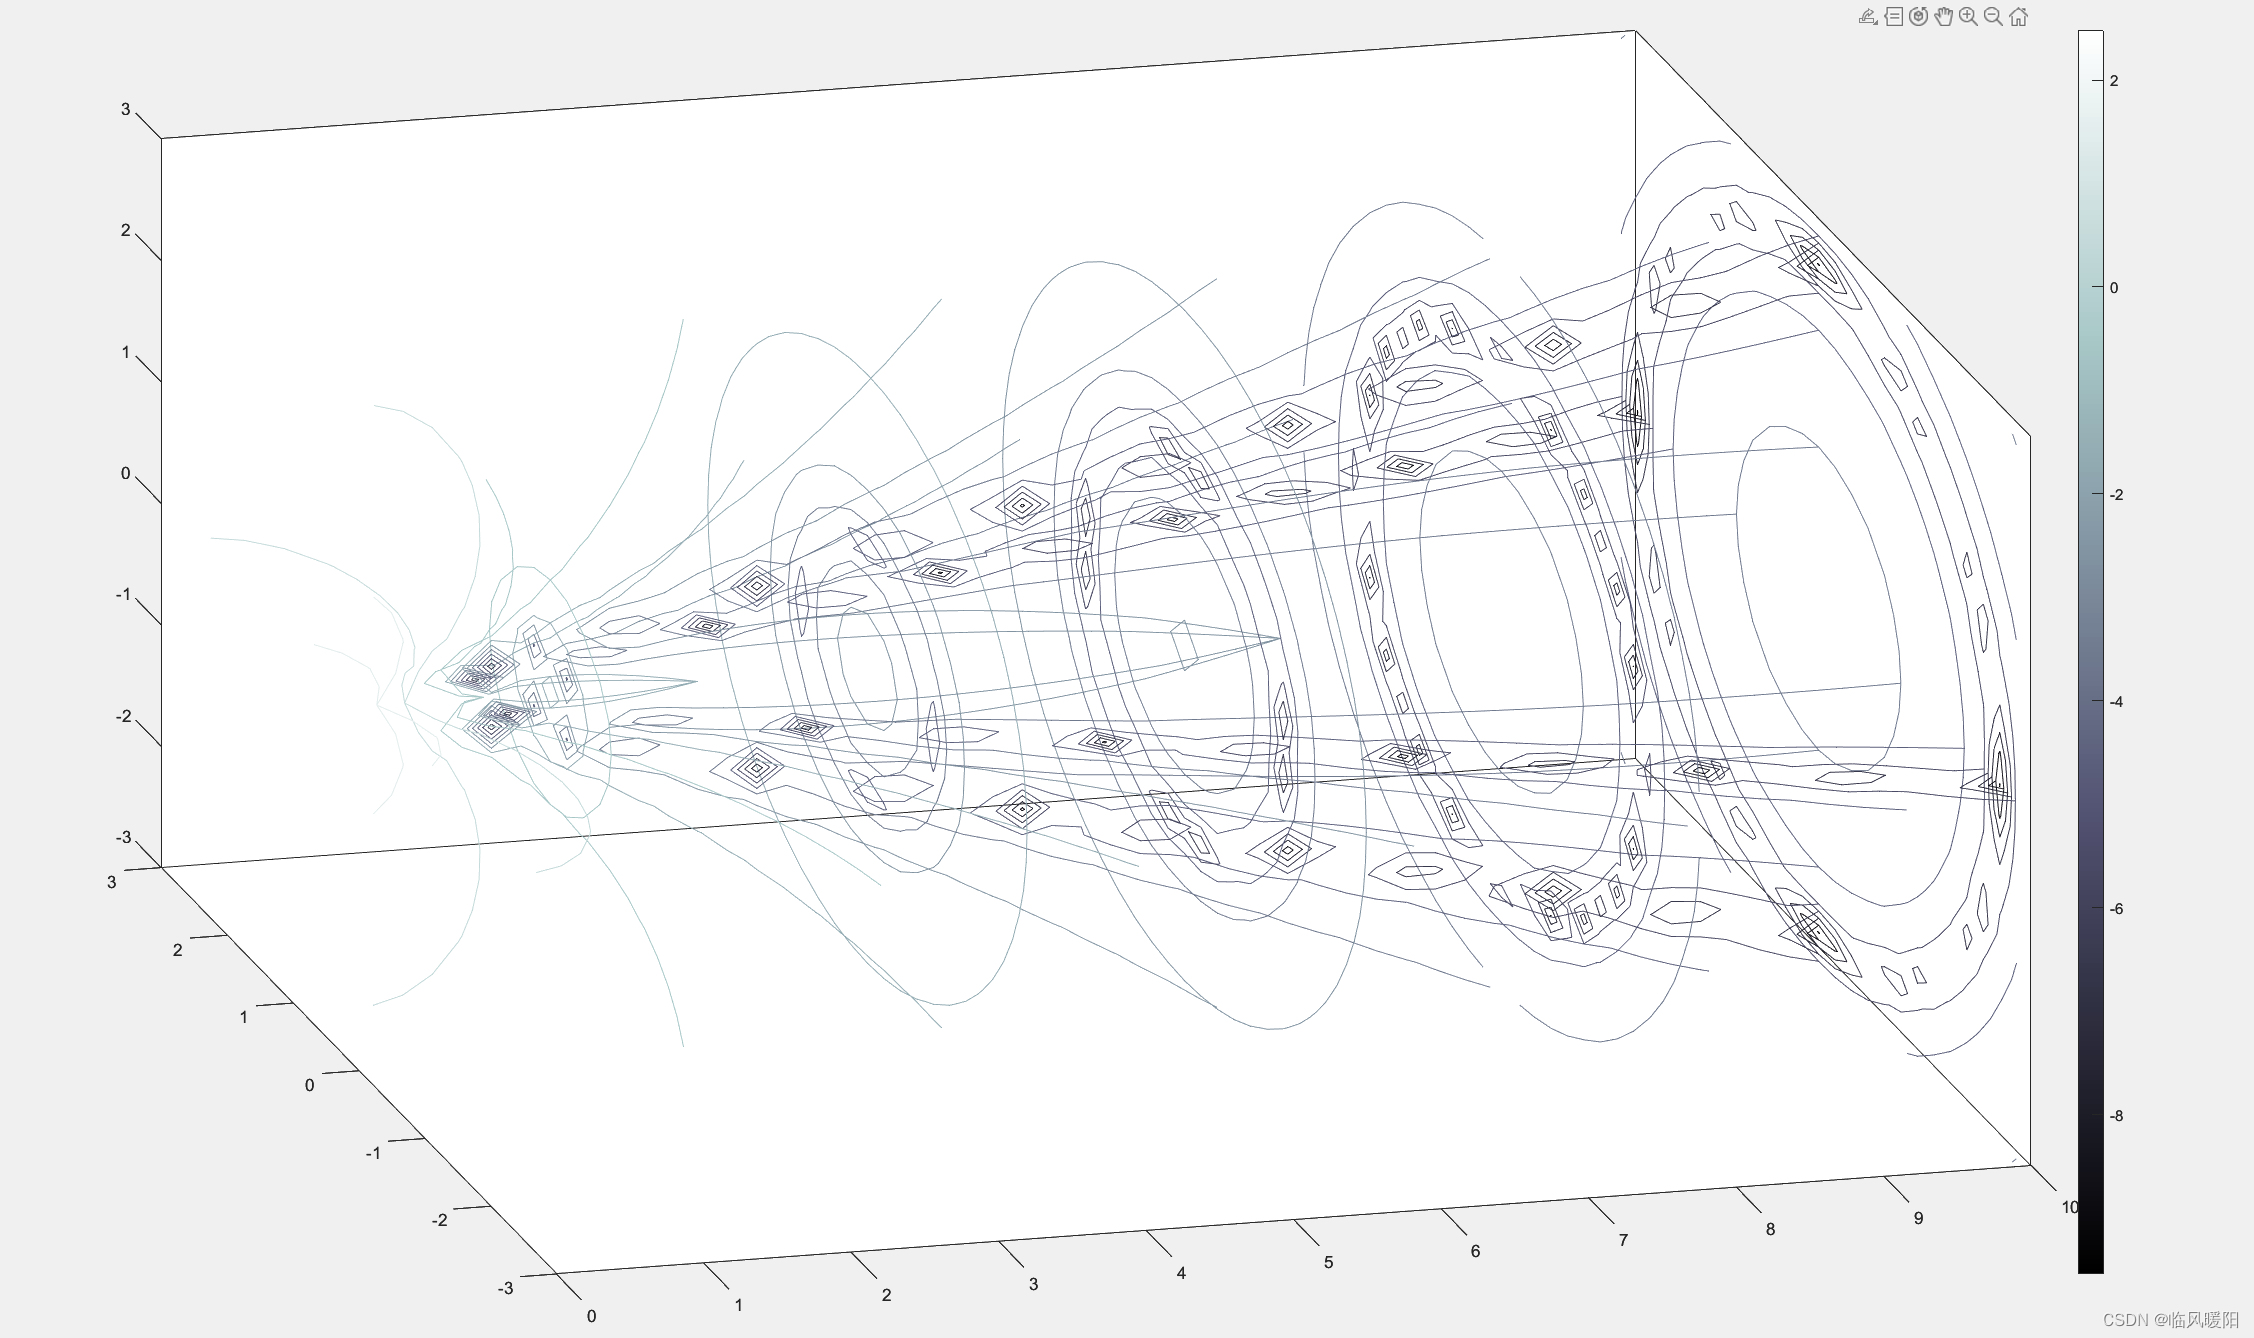
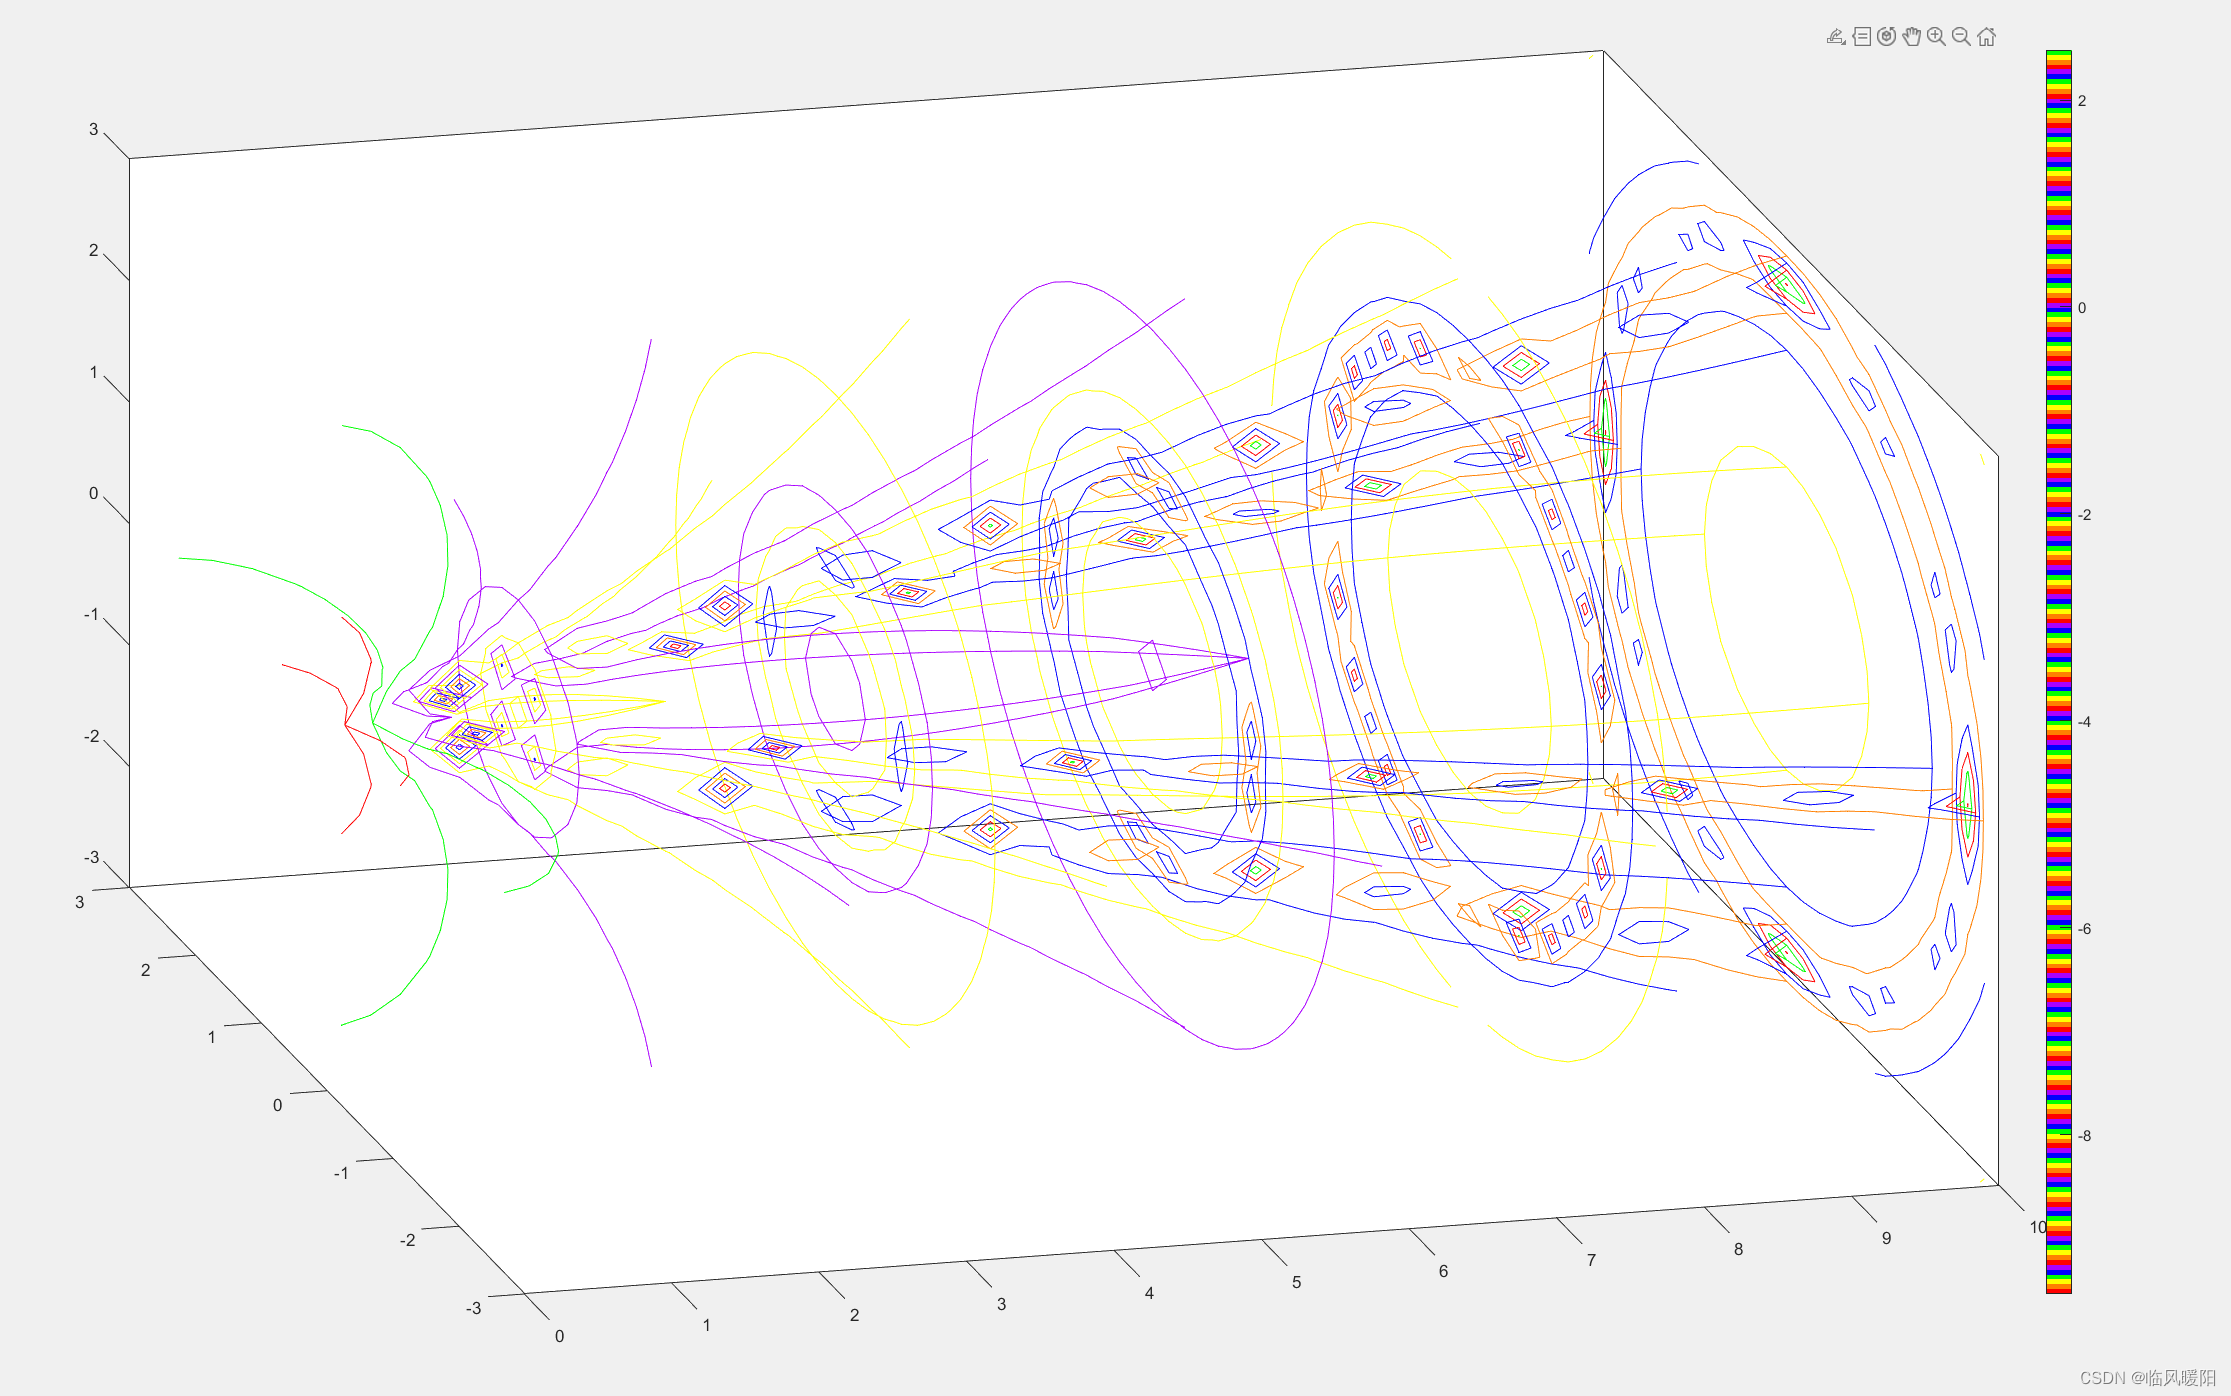
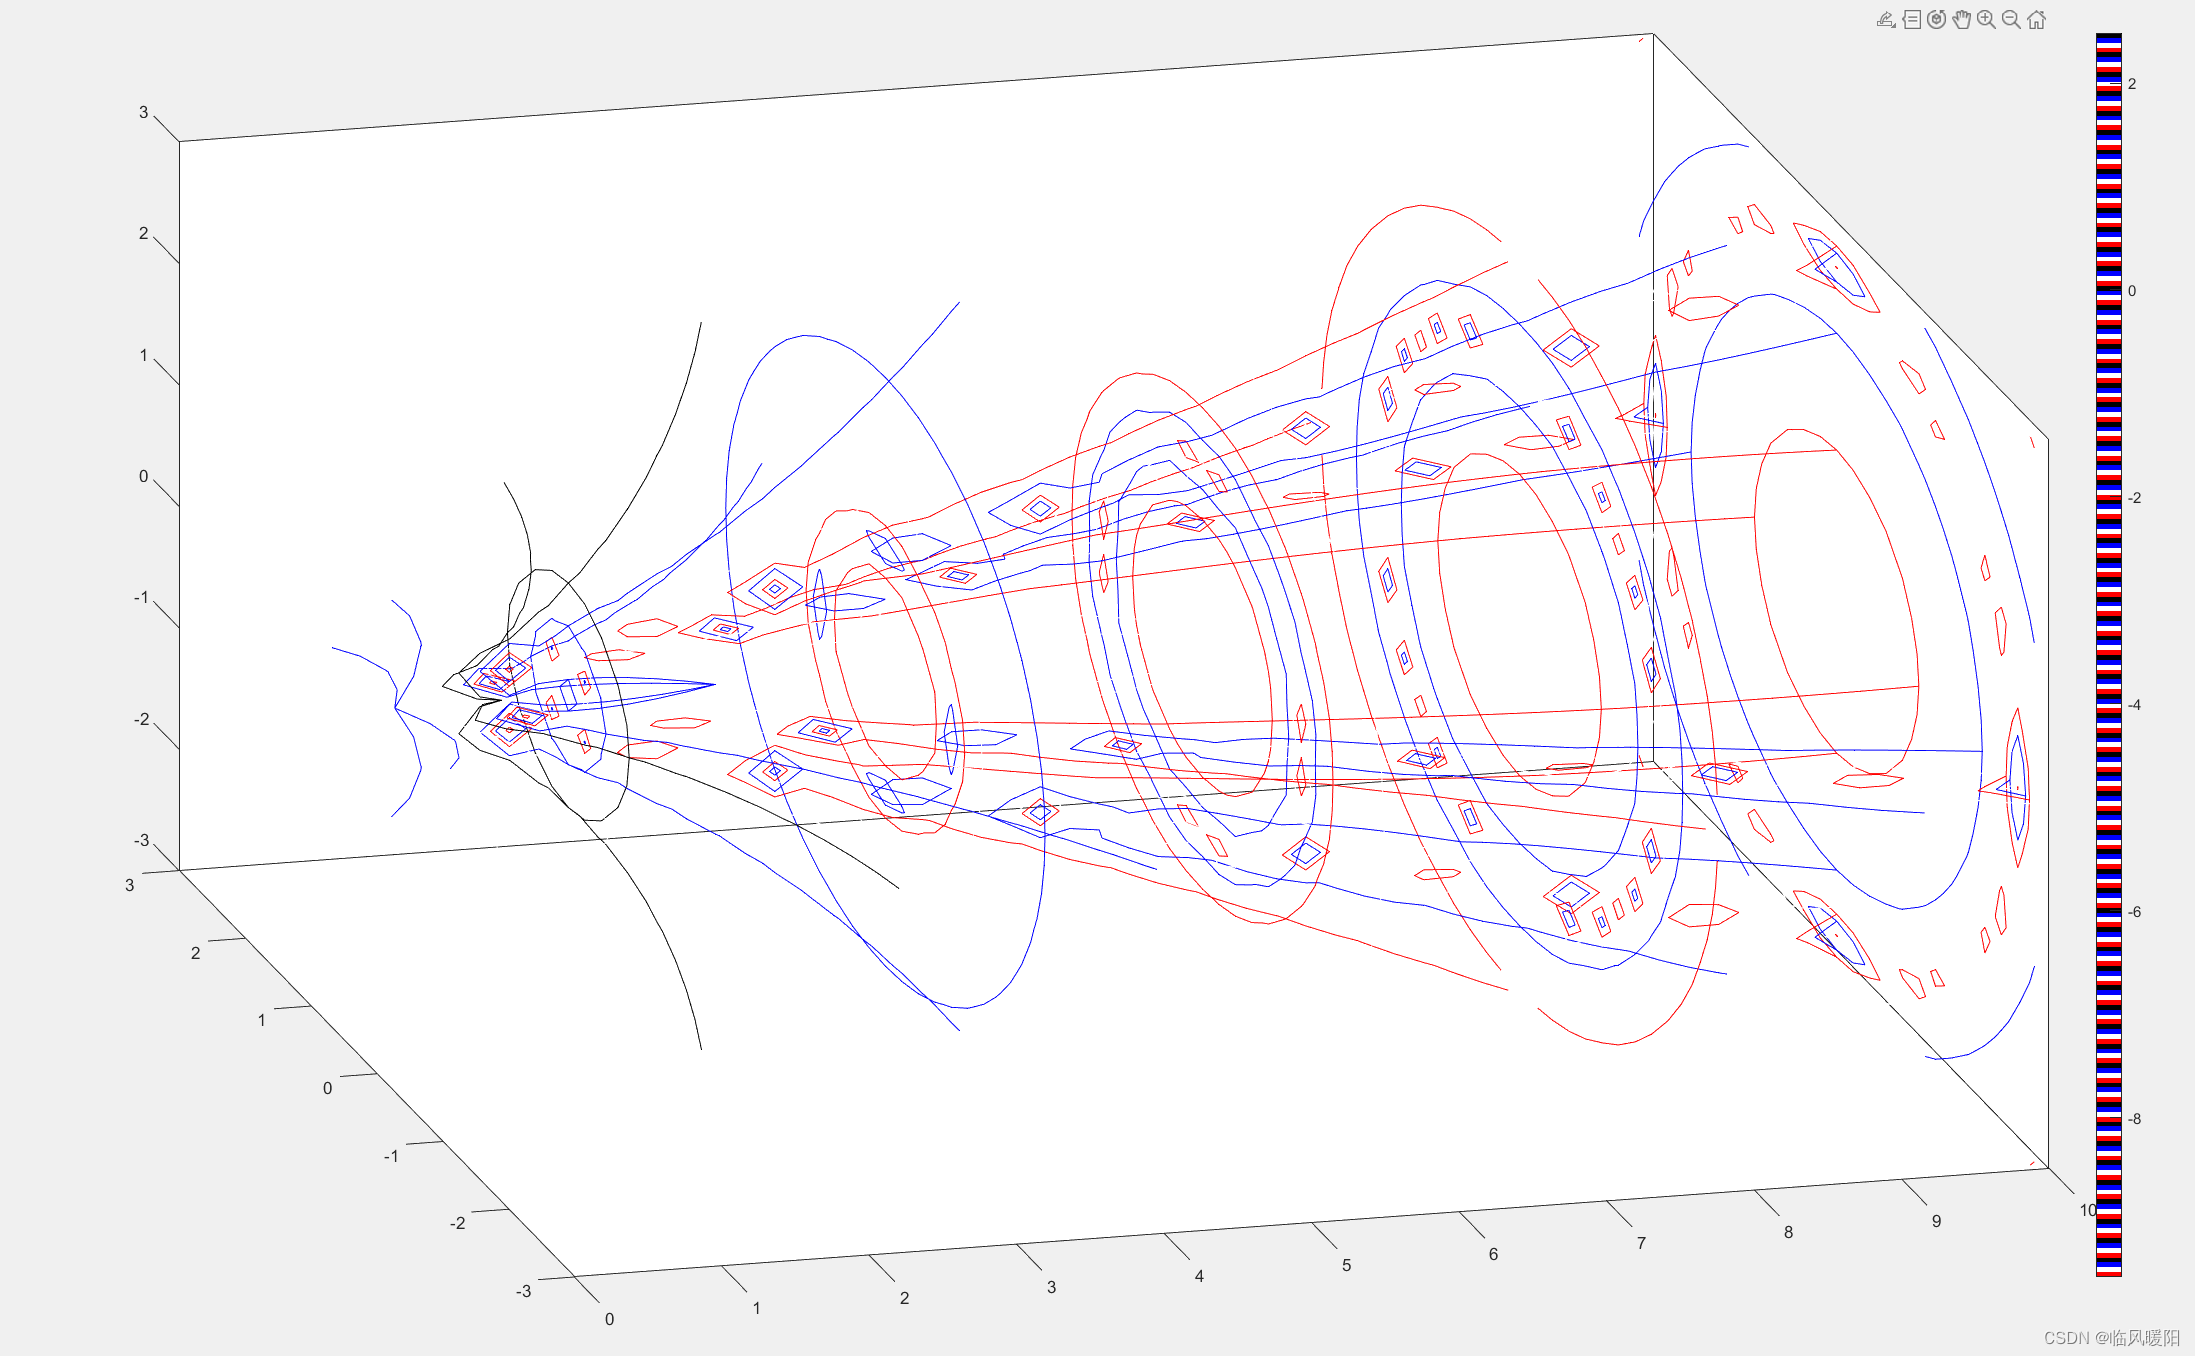
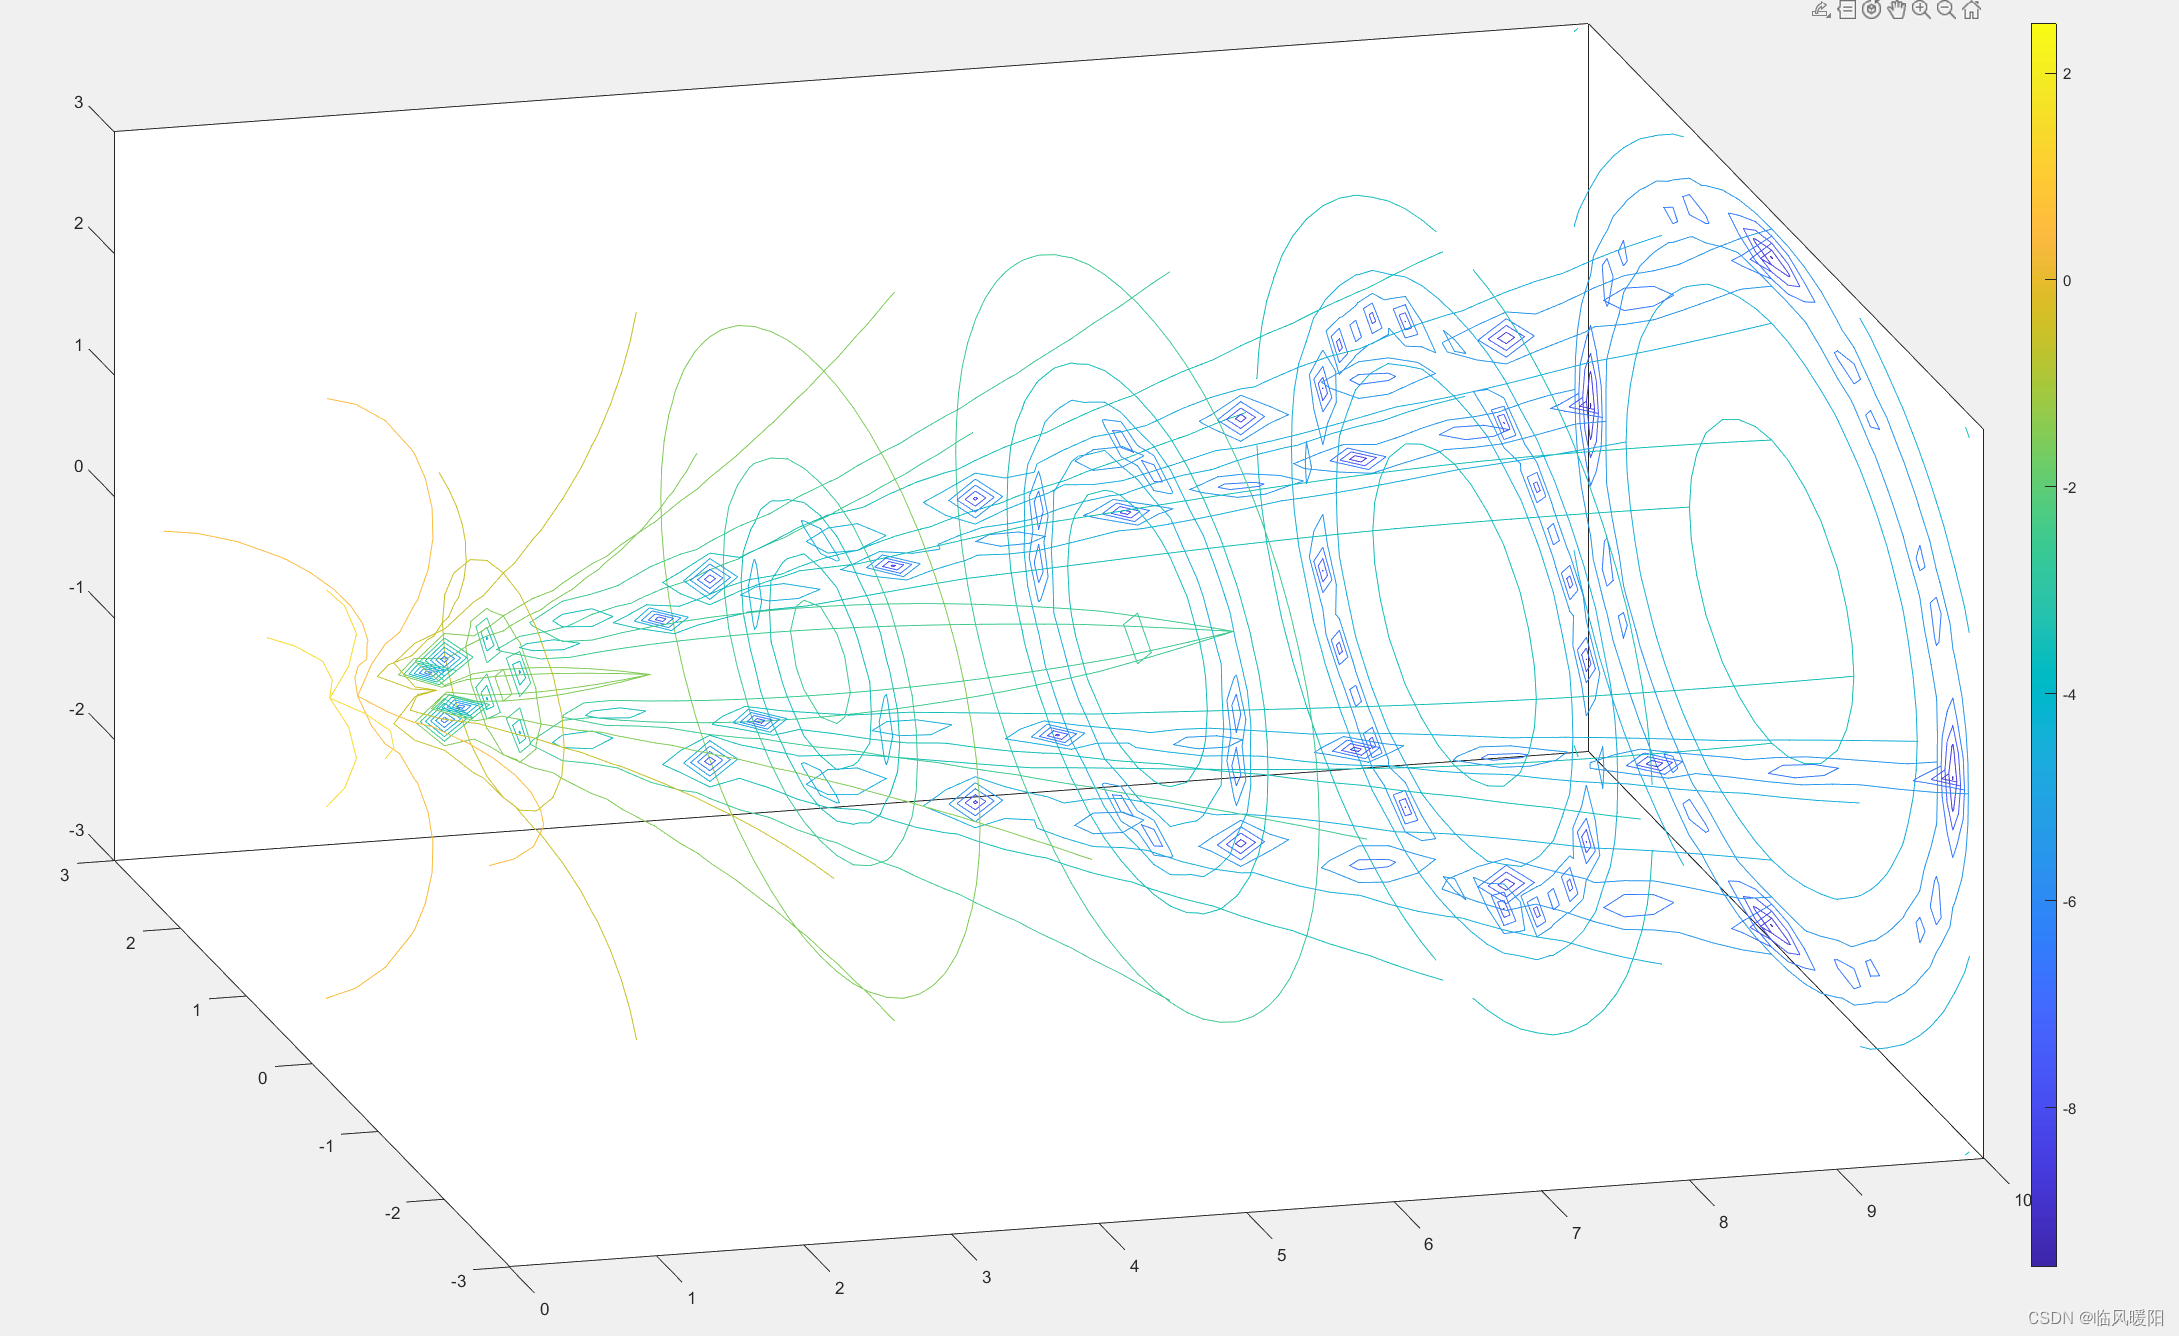
%以下指令用等位线表现射流速度
clf;
v1=min(min(min(V)));
v2=max(max(max(V)));
c1=linspace(v1,v2,15);
contourslice(X,Y,Z,V,s1,s2,s3,c1);
view([-15,30])
colormap parula;
colorbar;box on
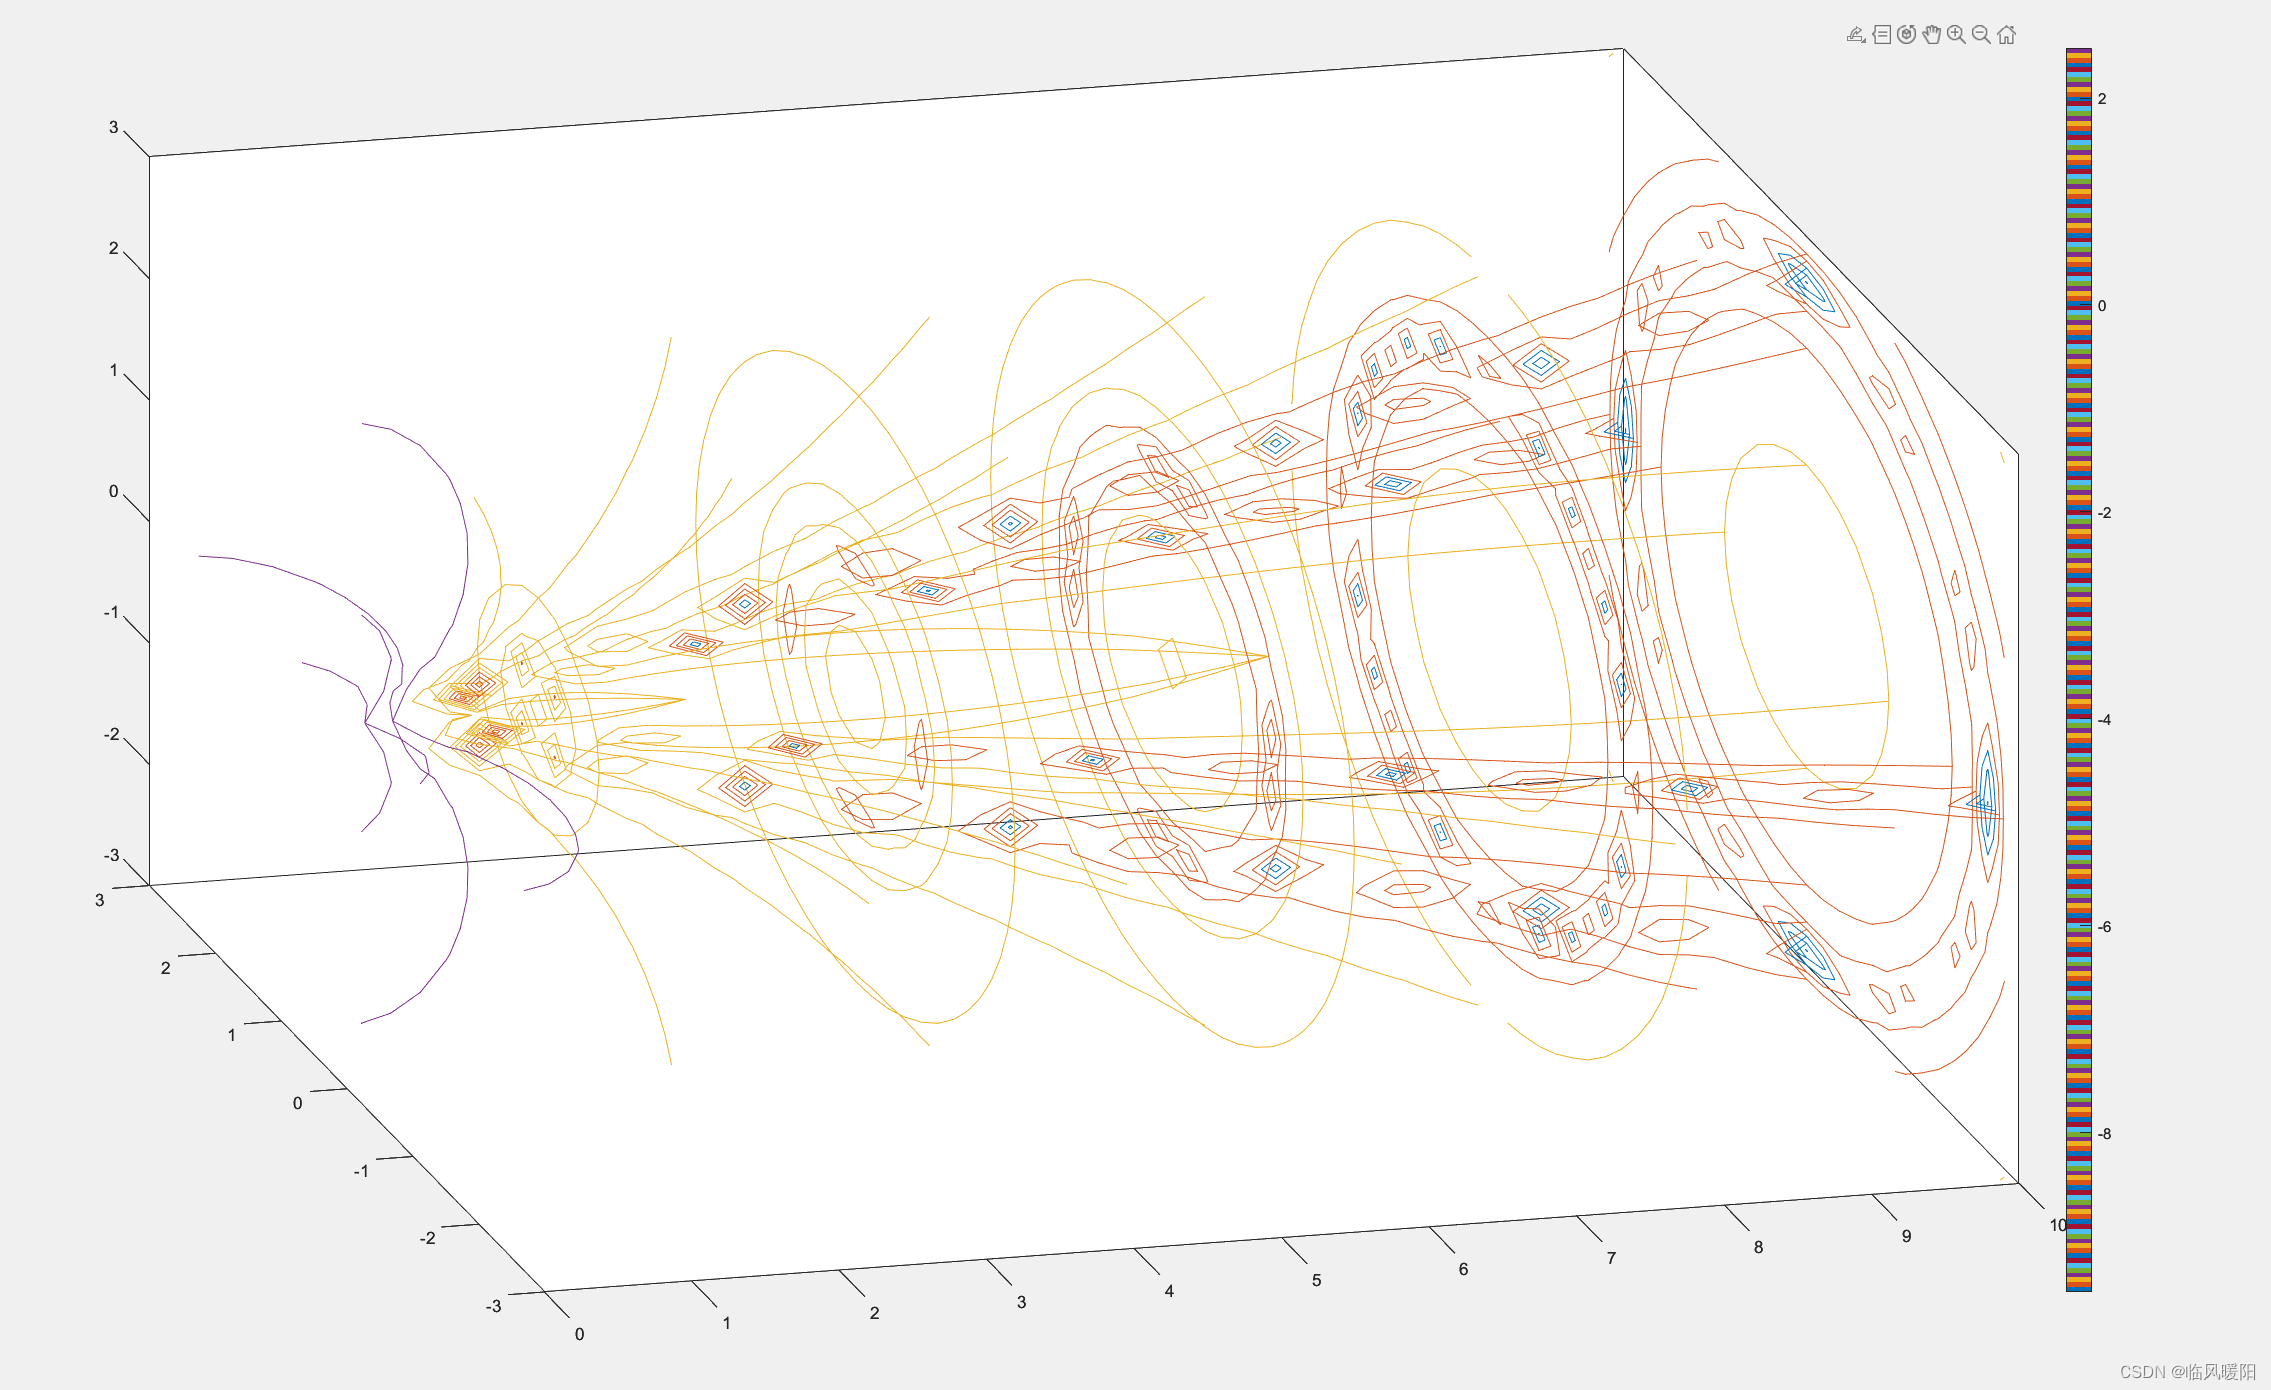
colormap turbo
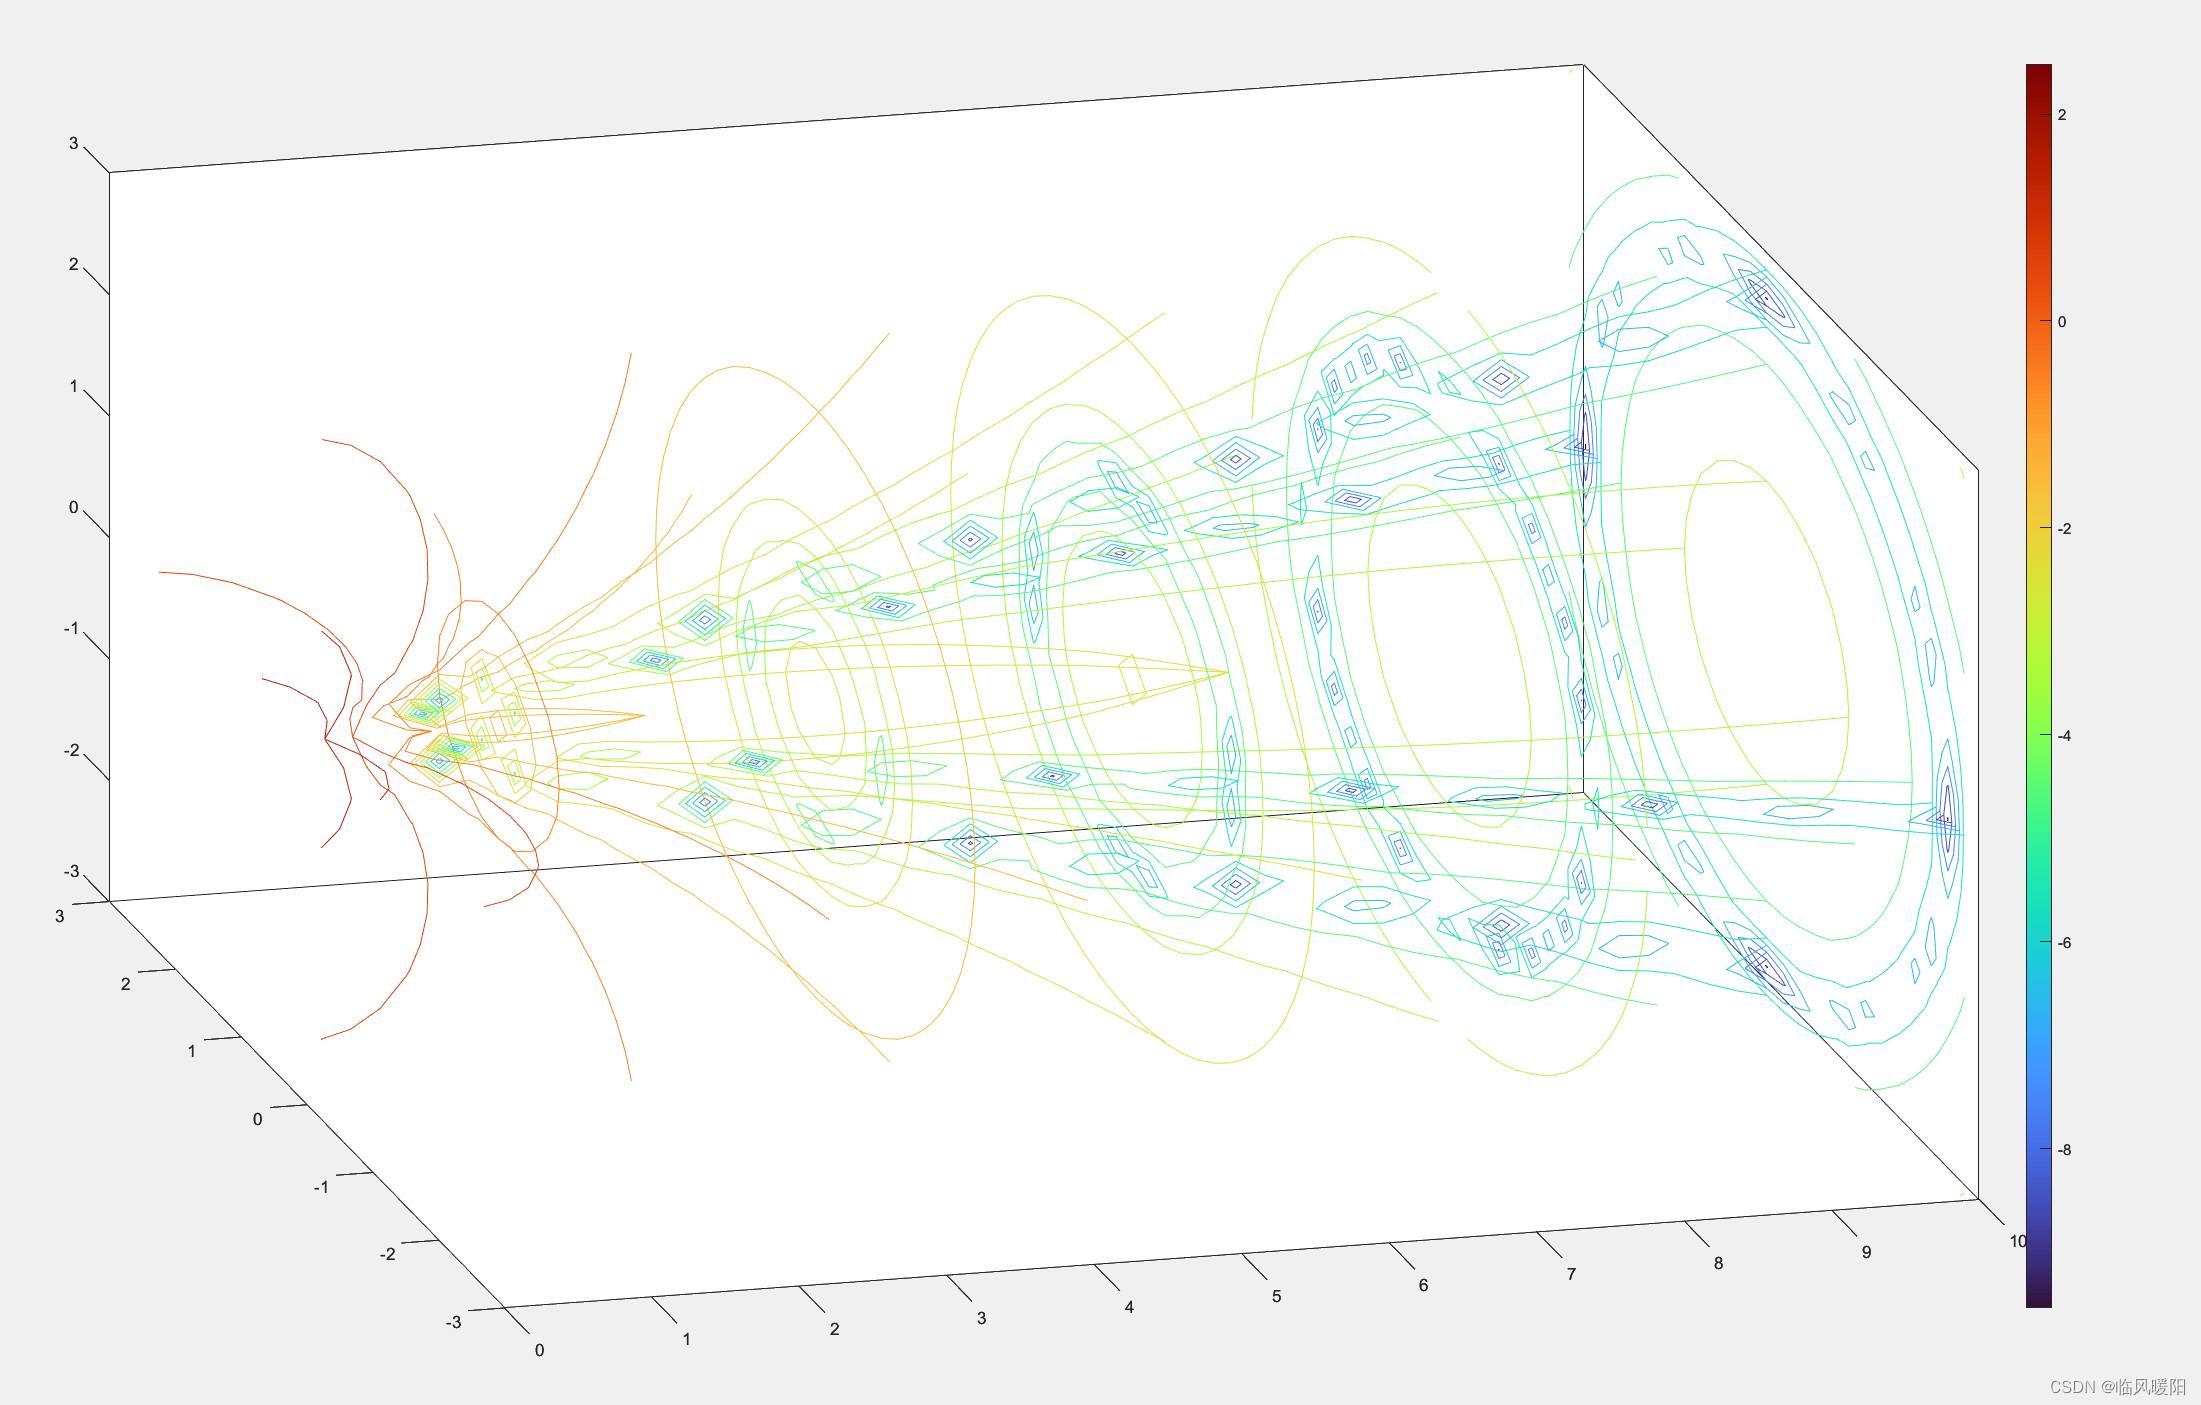
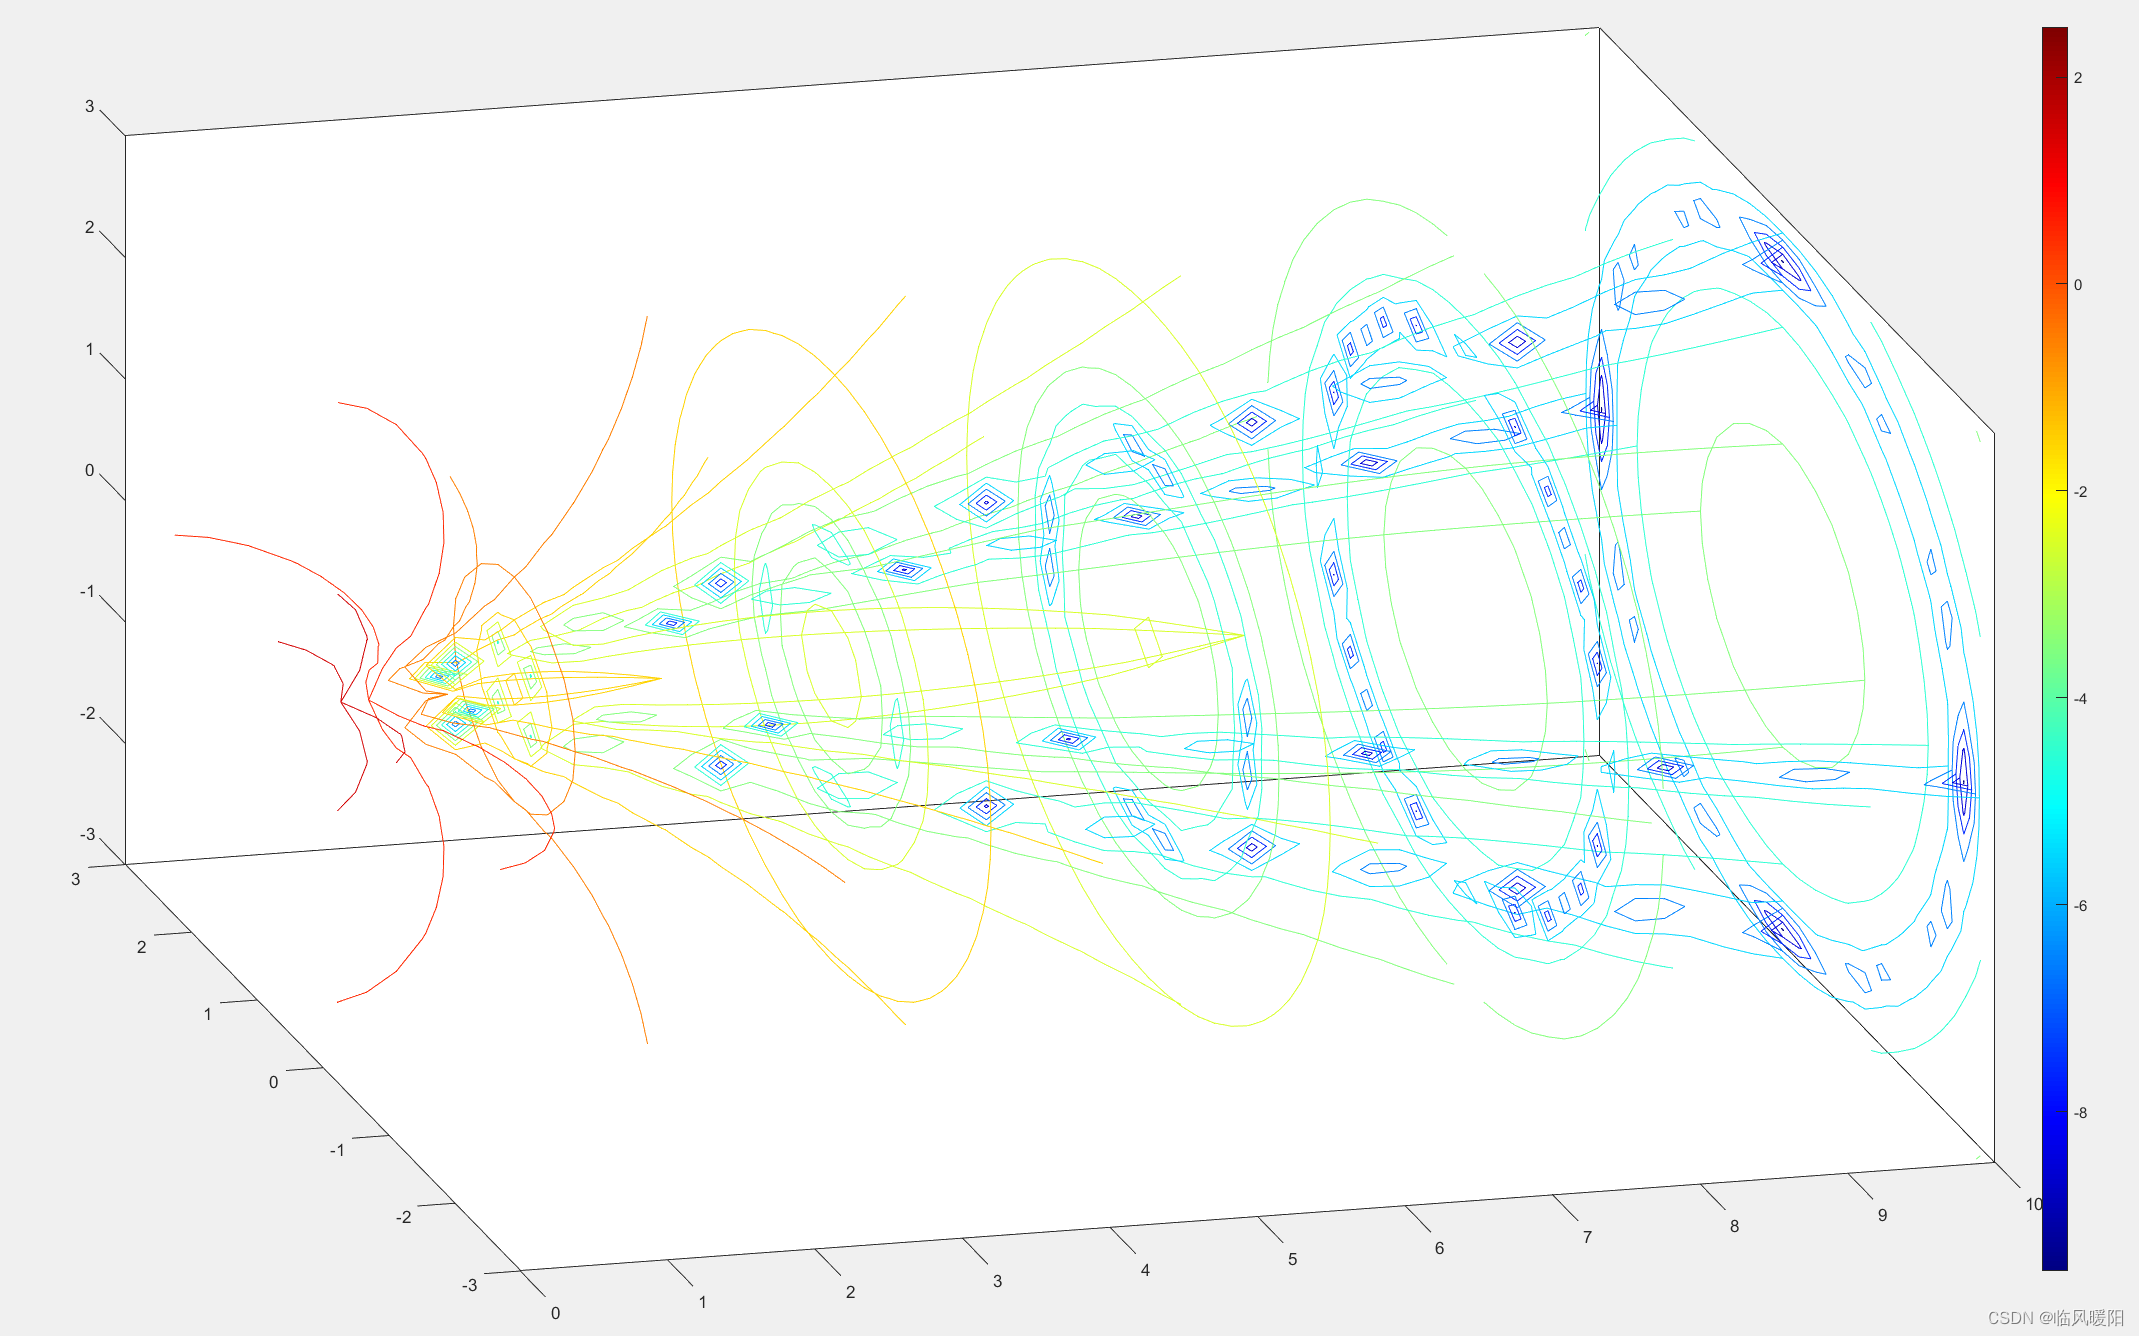
colormap jet
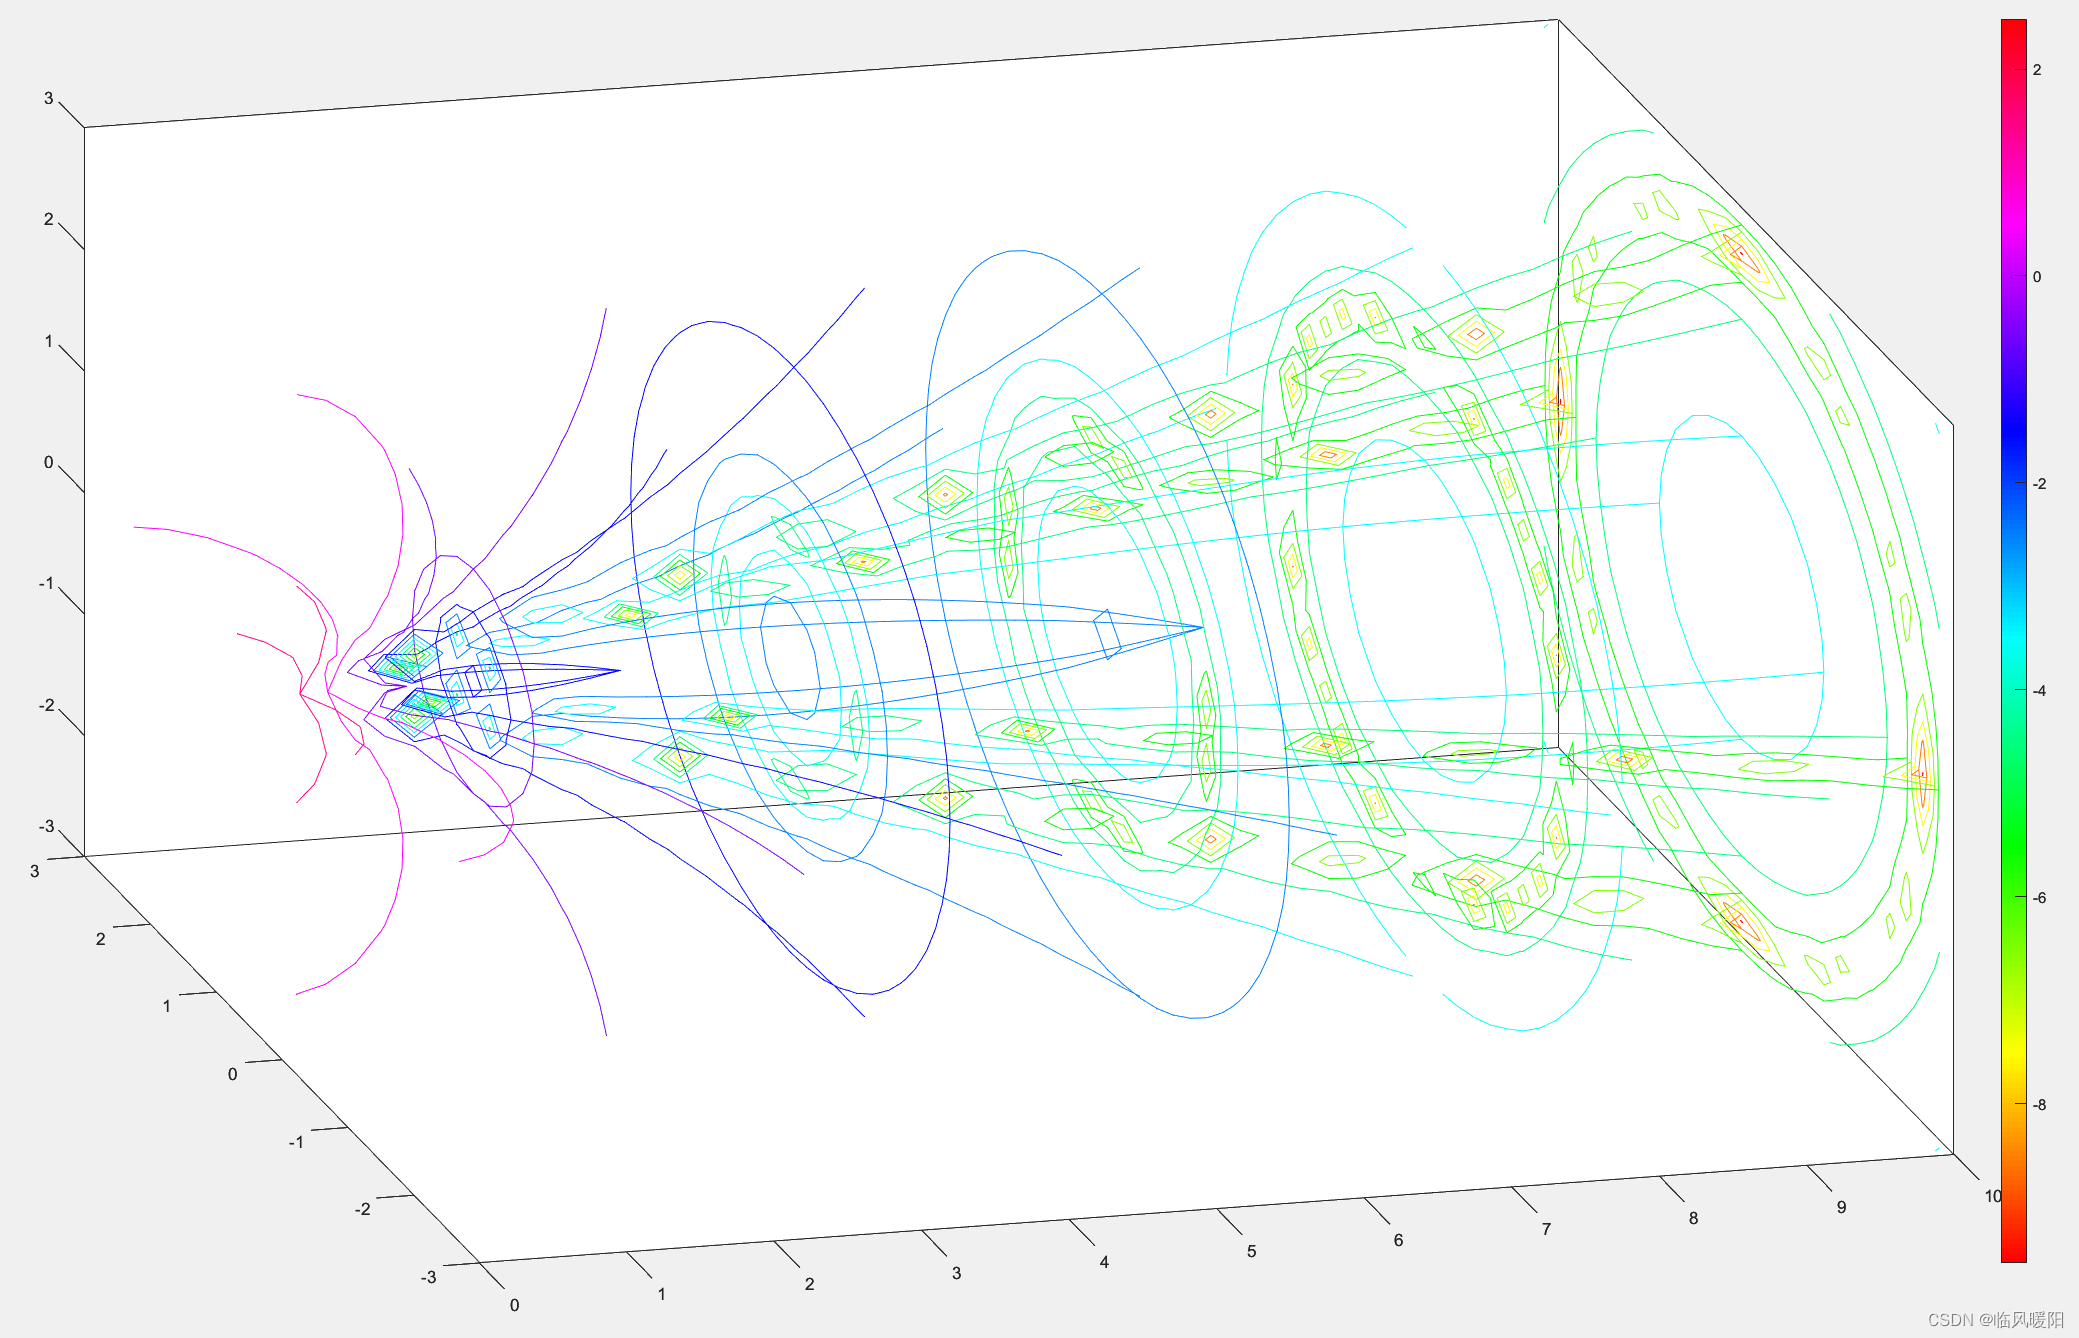
colormap hsv
colormap hot
colormap cool
colormap spring
colormap summer
colormap autumn
colormap winter
colormap gray
colormap bone
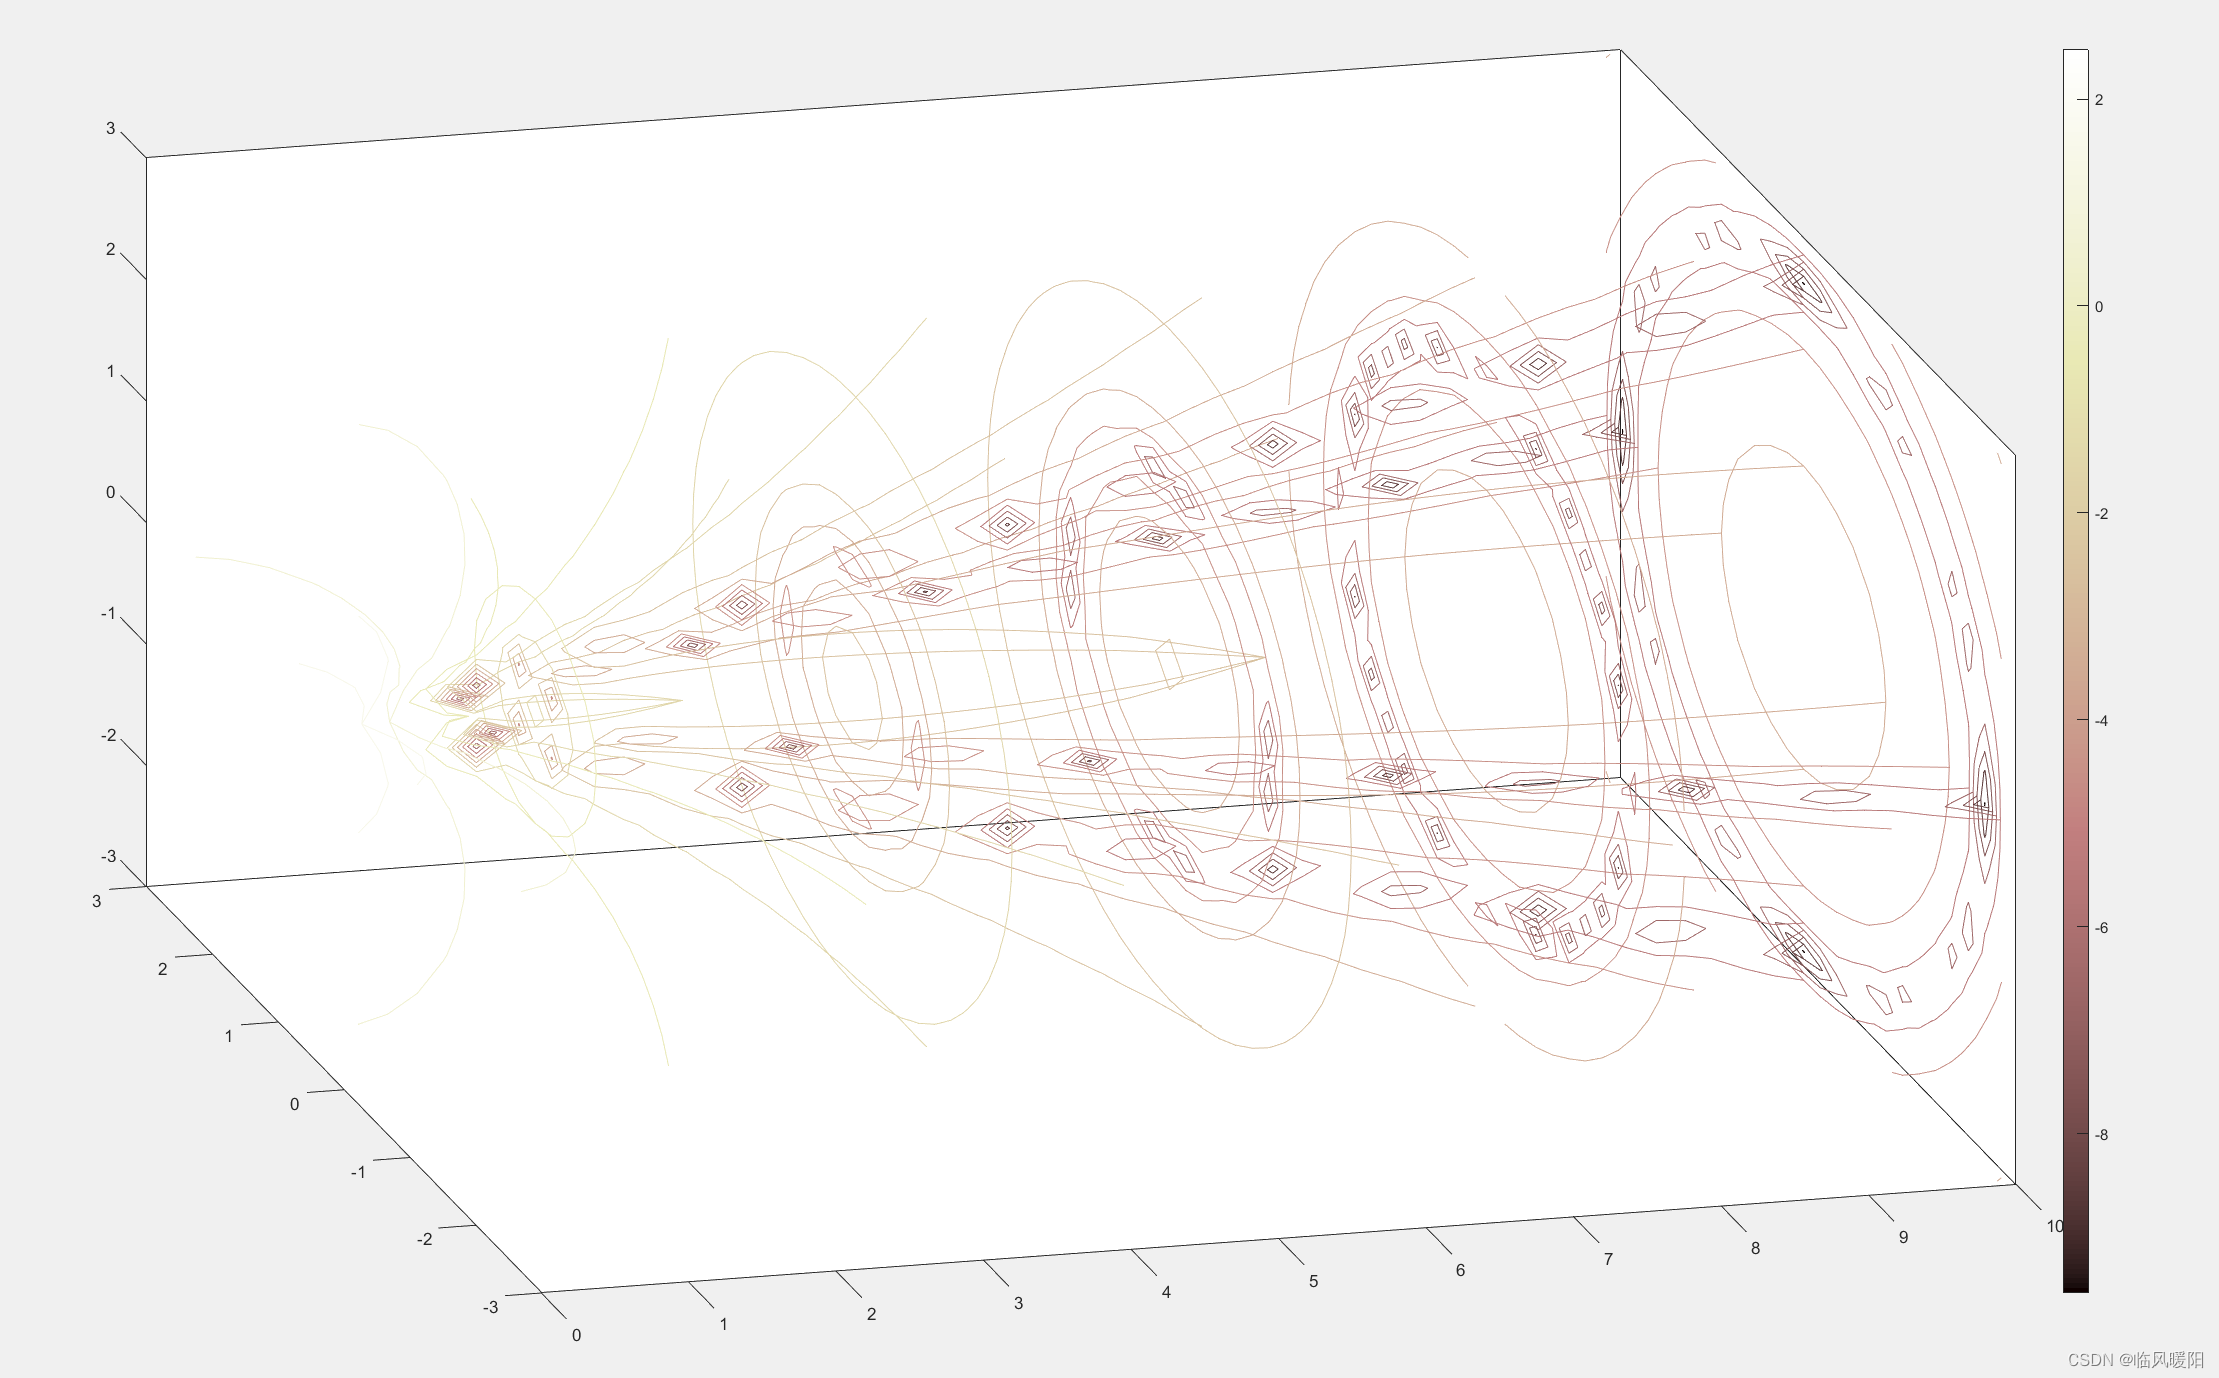
colormap copper
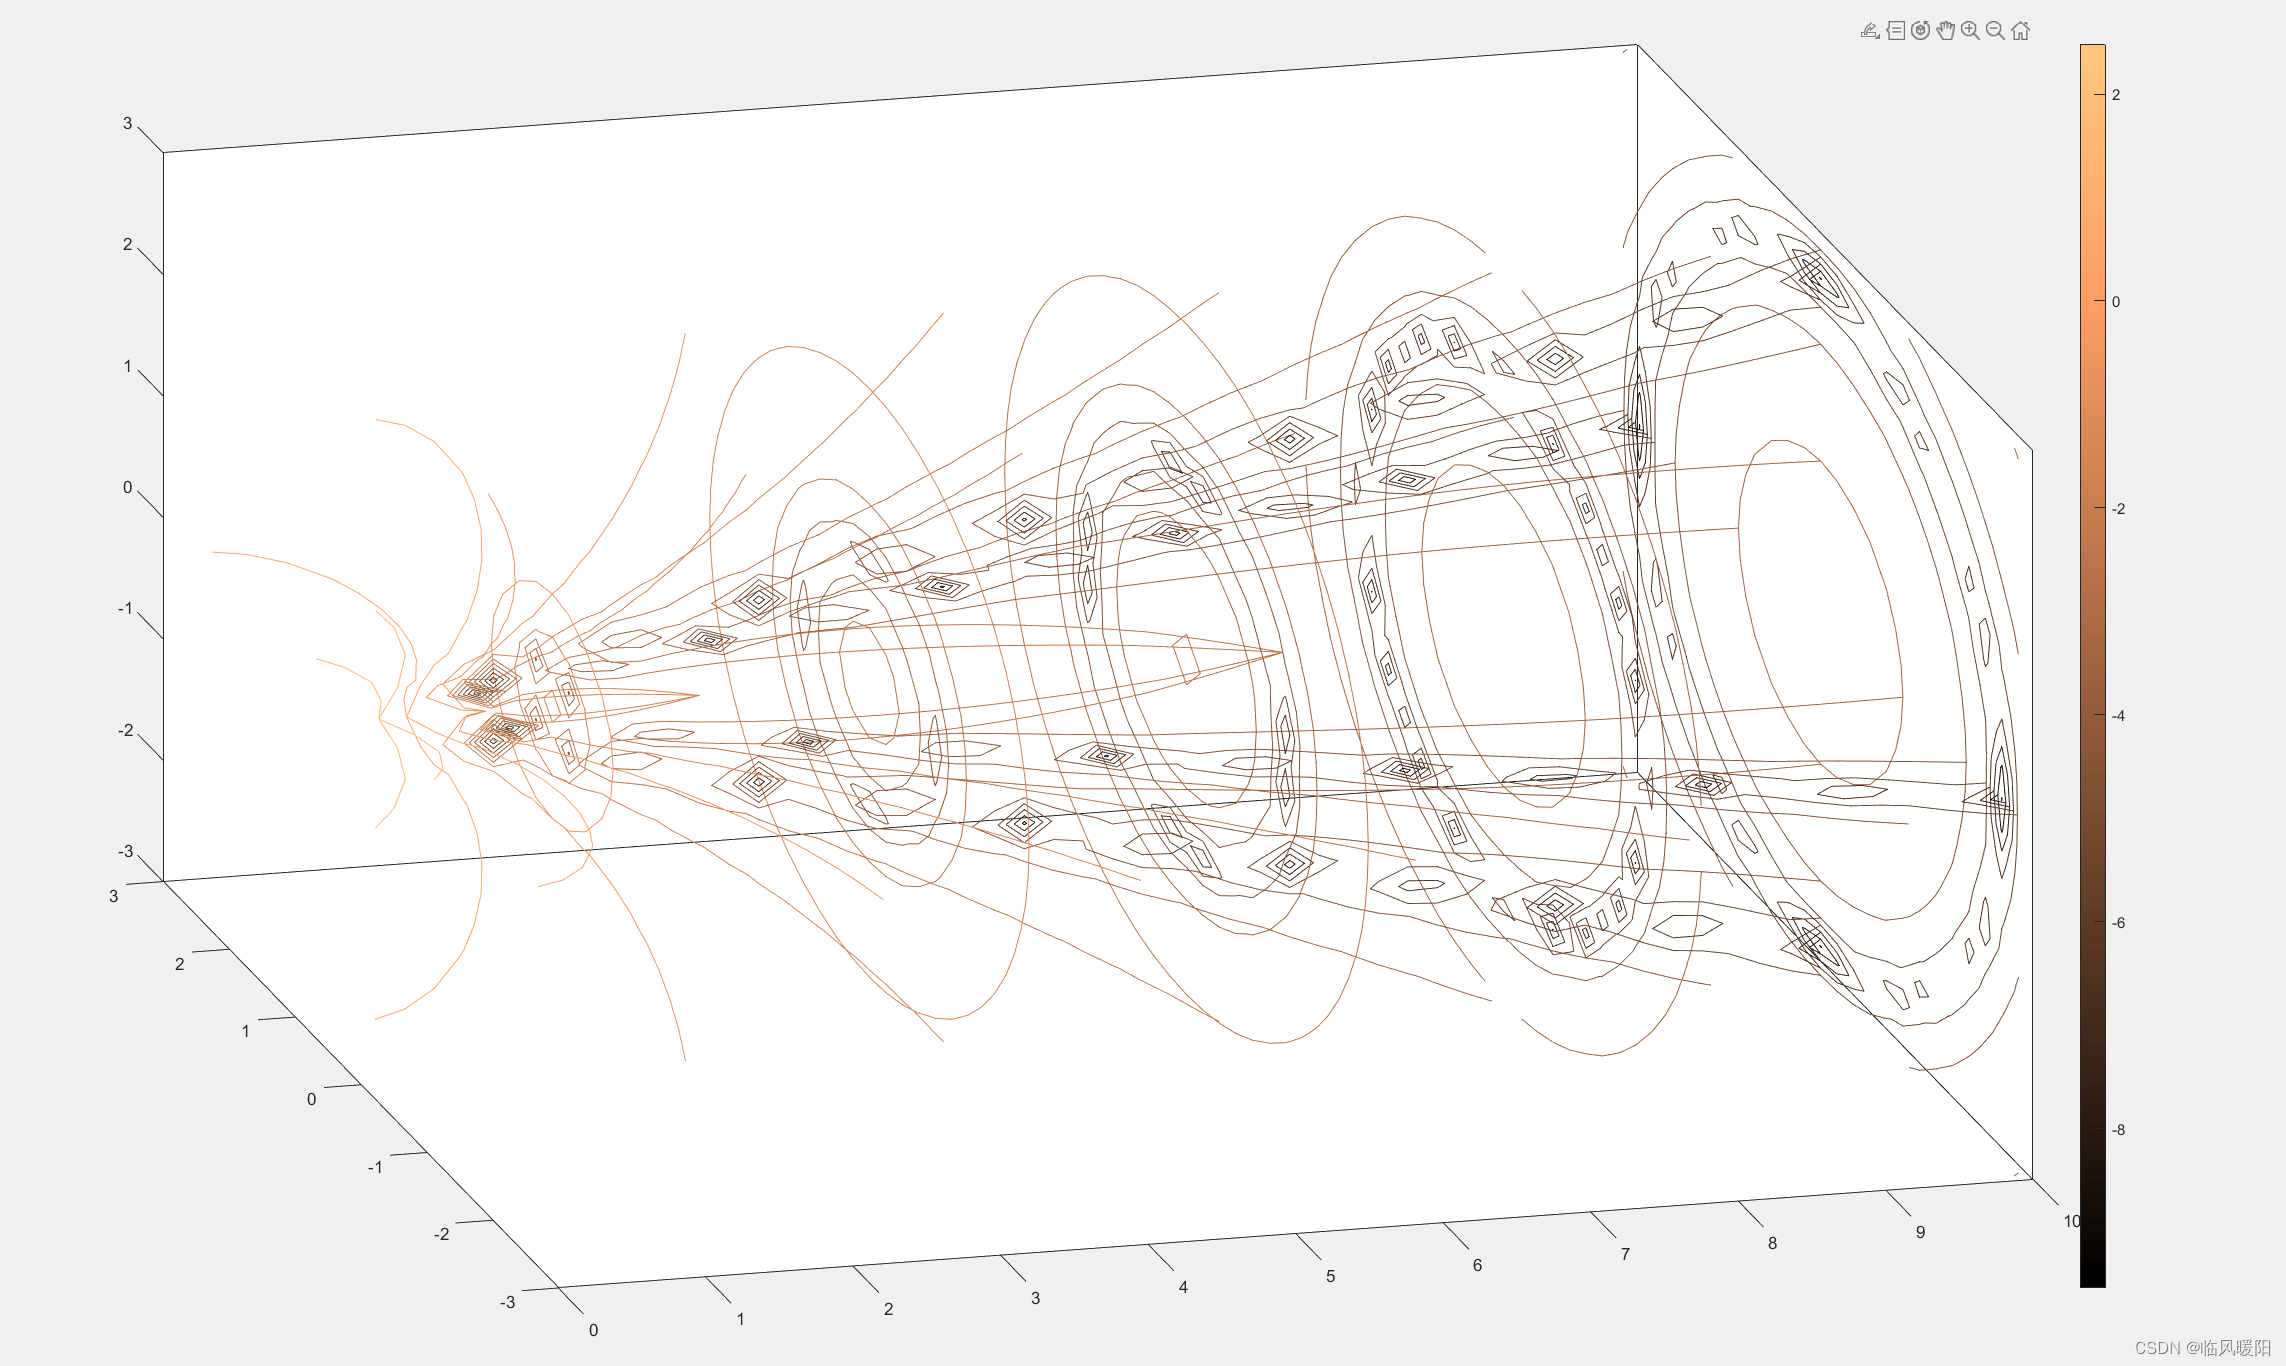
colormap pink
colormap lines
colormap colorcube
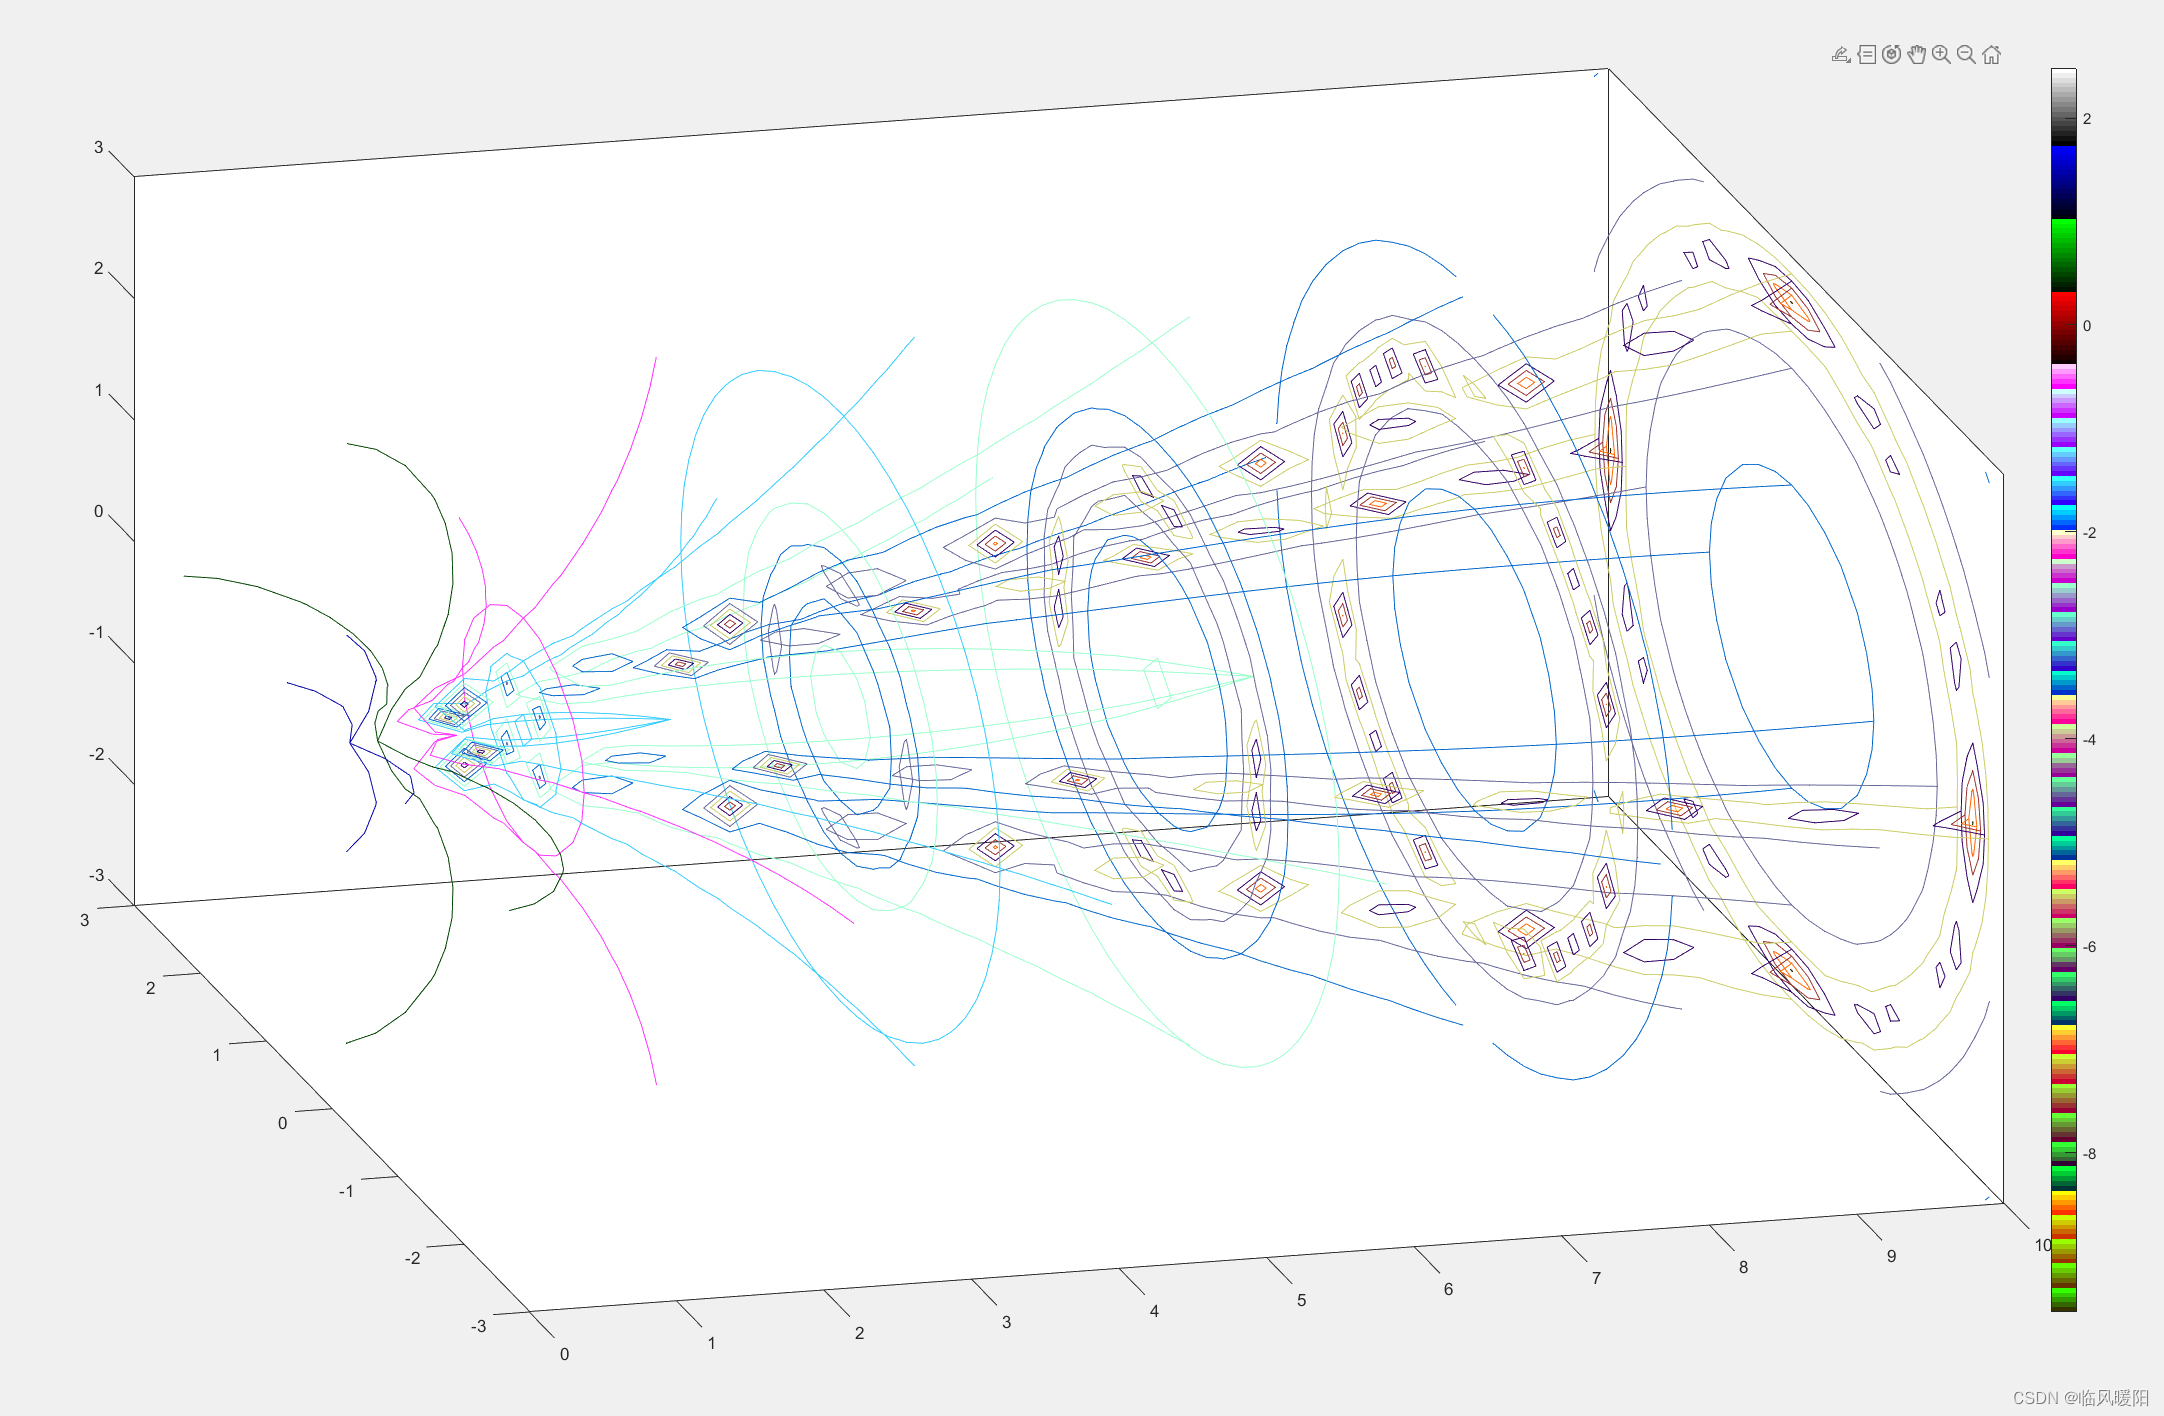
colormap prism
colormap flag
colormap default
开发工具:MATLAB 2022b
微信Alt+A截屏工具