import tensorflow as tf
import numpy as np
import matplotlib.pyplot as plt
#制造数据,加上随机噪声
x_data = np.linspace(-0.5, 0.5, 200)[:,np.newaxis]
noise = np.random.normal(0, 0.02, x_data.shape)
y_data=np.square(x_data)+noise
#定义两层简单的网络
x=tf.placeholder(tf.float32,[None,1])
y=tf.placeholder(tf.float32,[None,1])
w1=tf.Variable(tf.random_normal([1,10]))
b1=tf.Variable(tf.zeros([1,10]))
wx_plus_b1=tf.matmul(x,w1)+b1
l1=tf.nn.tanh(wx_plus_b1)
w2=tf.Variable(tf.random_normal([10,1]))
b2=tf.Variable(tf.zeros([1,1]))
wx_plus_b2=tf.matmul(l1,w2)+b2
predict=tf.nn.tanh(wx_plus_b2)
#损失函数选用SME
loss=tf.reduce_mean(tf.square(y-predict))
#优化函数选取梯度下降法
train=tf.train.GradientDescentOptimizer(0.1).minimize(loss)
with tf.Session() as sess:
predict_y = None
sess.run(tf.global_variables_initializer())
for i in range(2000):
sess.run(train,feed_dict={x:x_data,y:y_data})
#训练完成后,通过模型得到预测的y值
predict_y=sess.run(predict,feed_dict={x:x_data})
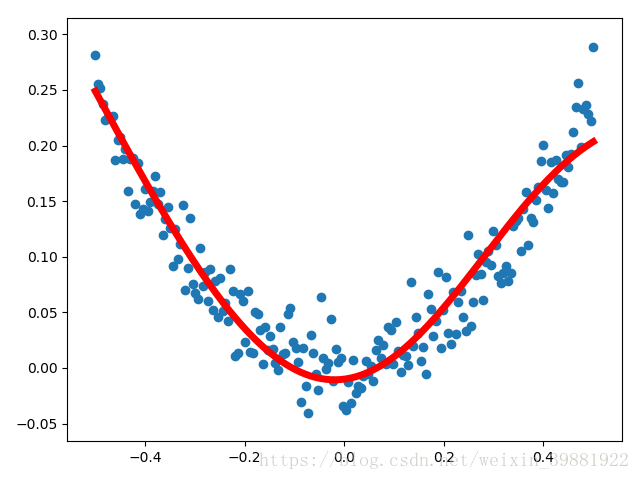
plt.figure()
plt.scatter(x_data,y_data)
plt.plot(x_data,predict_y,'r',lw=5)
plt.show()
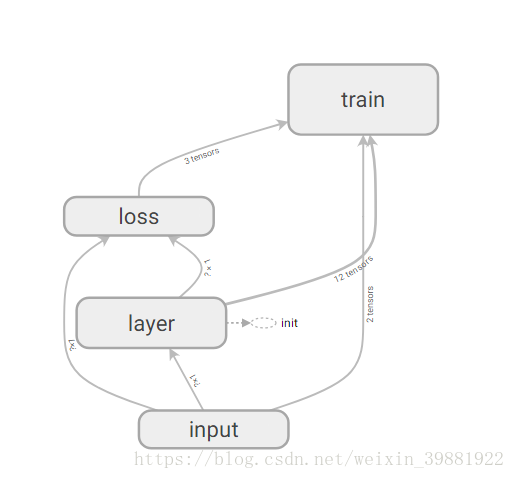
更改代码实现Tensorboard 网络结构绘制
import tensorflow as tf
import numpy as np
import matplotlib.pyplot as plt
#制造数据,加上随机噪声
x_data = np.linspace(-0.5, 0.5, 200)[:,np.newaxis]
noise = np.random.normal(0, 0.02, x_data.shape)
y_data=np.square(x_data)+noise
with tf.name_scope('input'):
#定义两层简单的网络
x=tf.placeholder(tf.float32,[None,1],name='input-x')
y=tf.placeholder(tf.float32,[None,1],name='input-y')
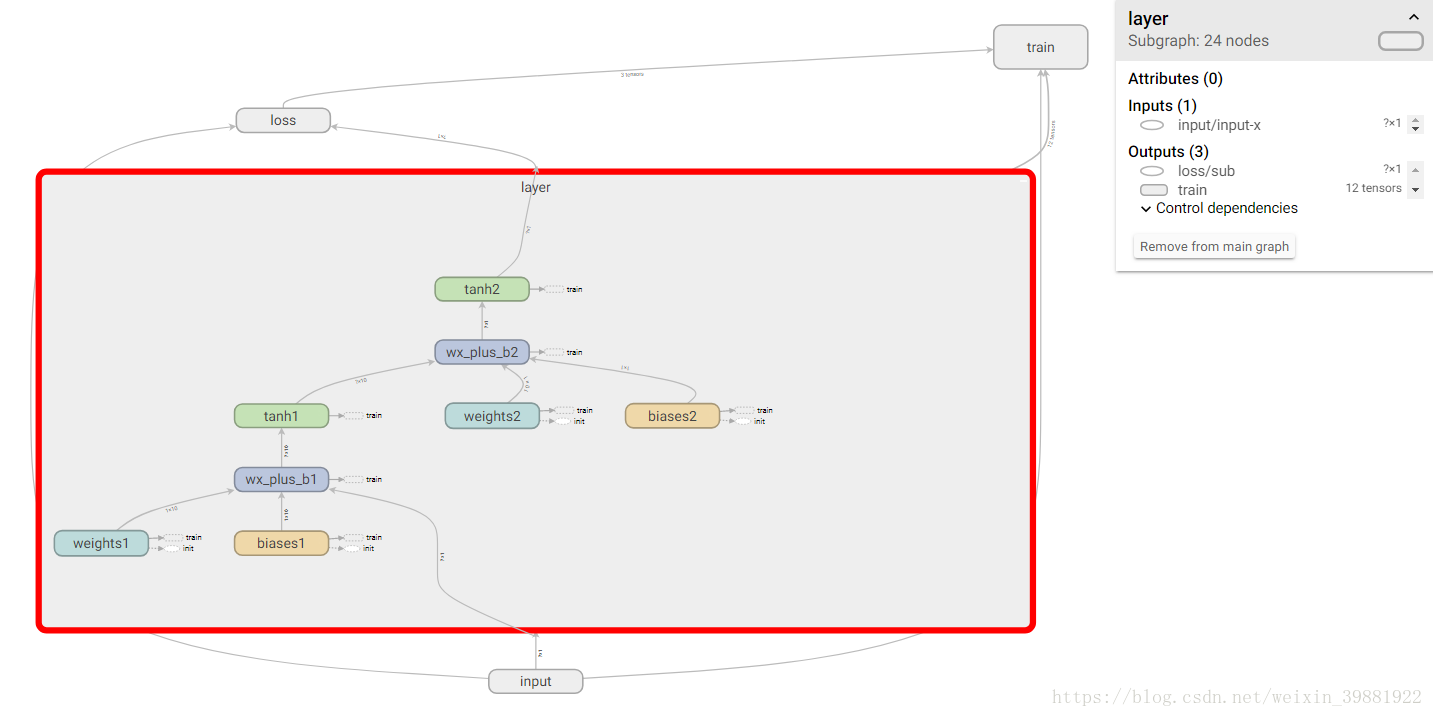
with tf.name_scope('layer'):
with tf.name_scope('weights1'):
w1=tf.Variable(tf.random_normal([1,10]),name='w1')
with tf.name_scope('biases1'):
b1=tf.Variable(tf.zeros([1,10]),name='b1')
with tf.name_scope('wx_plus_b1'):
wx_plus_b1=tf.matmul(x,w1)+b1
with tf.name_scope('tanh1'):
l1=tf.nn.tanh(wx_plus_b1)
with tf.name_scope('weights2'):
w2=tf.Variable(tf.random_normal([10,1]))
with tf.name_scope('biases2'):
b2=tf.Variable(tf.zeros([1,1]))
with tf.name_scope('wx_plus_b2'):
wx_plus_b2=tf.matmul(l1,w2)+b2
with tf.name_scope('tanh2'):
predict=tf.nn.tanh(wx_plus_b2)
with tf.name_scope('loss'):
#损失函数选用SME
loss=tf.reduce_mean(tf.square(y-predict),name='loss')
with tf.name_scope('train'):
#优化函数选取梯度下降法
train=tf.train.GradientDescentOptimizer(0.1).minimize(loss)
with tf.Session() as sess:
sess.run(tf.global_variables_initializer())
writer=tf.summary.FileWriter('logs/',sess.graph)
for i in range(2000):
sess.run(train,feed_dict={x:x_data,y:y_data})
#训练完成后,通过模型得到预测的y值
predict_y=sess.run(predict,feed_dict={x:x_data})
plt.figure()
plt.scatter(x_data,y_data)
plt.plot(x_data,predict_y,'r',lw=5)
plt.show()