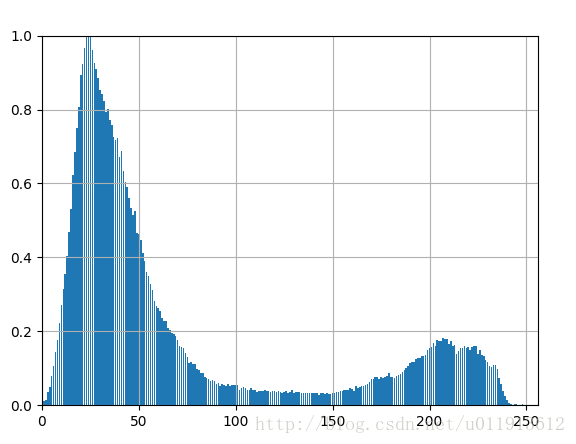
其灰度直方图为:

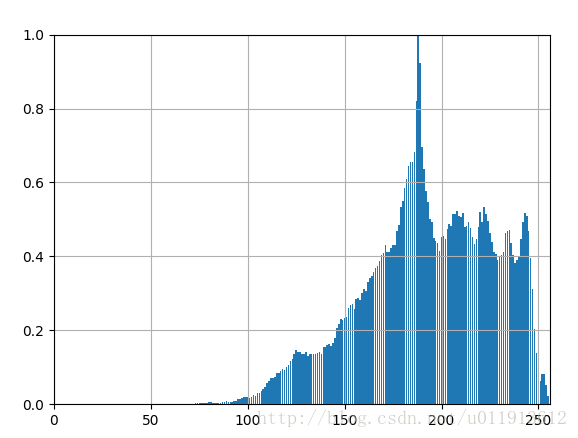
其灰度直方图为:
代码如下:
def calHistogram(img):
if(len(img.shape) != 2):
print("img size error")
return None
histogram = {}
for i1 in range(img.shape[0]):
for i2 in range(img.shape[1]):
if histogram.get(img[i1][i2]) is None:
histogram[img[i1][i2]] = 0
histogram[img[i1][i2]] += 1
#cal max value
maxValue = 0.0
maxKey = -1
for key in histogram:
if histogram[key] > maxValue:
maxValue = histogram[key]
maxKey = key
print(maxValue)
print(maxKey)
# normalize
for key in histogram:
histogram[key] = float(histogram[key]) / maxValue
return histogram
def drawHistoGram(histogram):
pyplot.figure()
#设置x轴的最小值,最大值。y轴的最小值,最大值
pyplot.axis([0, 256, 0, 1])
#显示网格线
pyplot.grid(True)
#key正好就是灰度
keys = histogram.keys()
#value是灰度的像素数量,这里是归一化之后的
values = histogram.values()
#这里正式绘制直方图
pyplot.bar(tuple(keys), tuple(values))
pyplot.show()
def testHistogram():
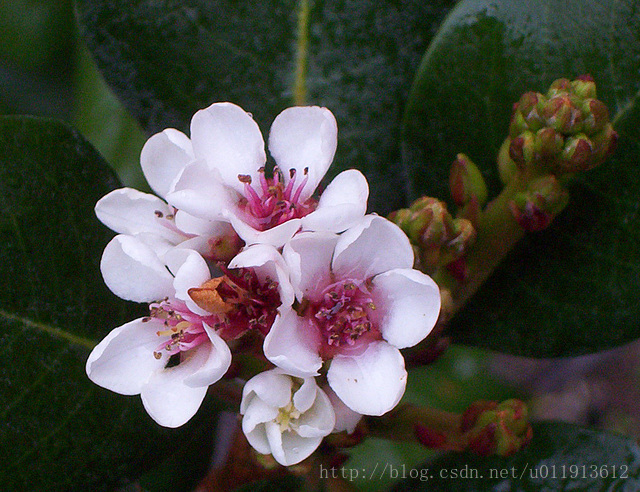
test = cv.imread("test2.jpg")
histogram = calHistogram(test)
drawHistoGram(histogram)
cv.imshow("test",test)
cv.waitKey(0)
testHistogram()