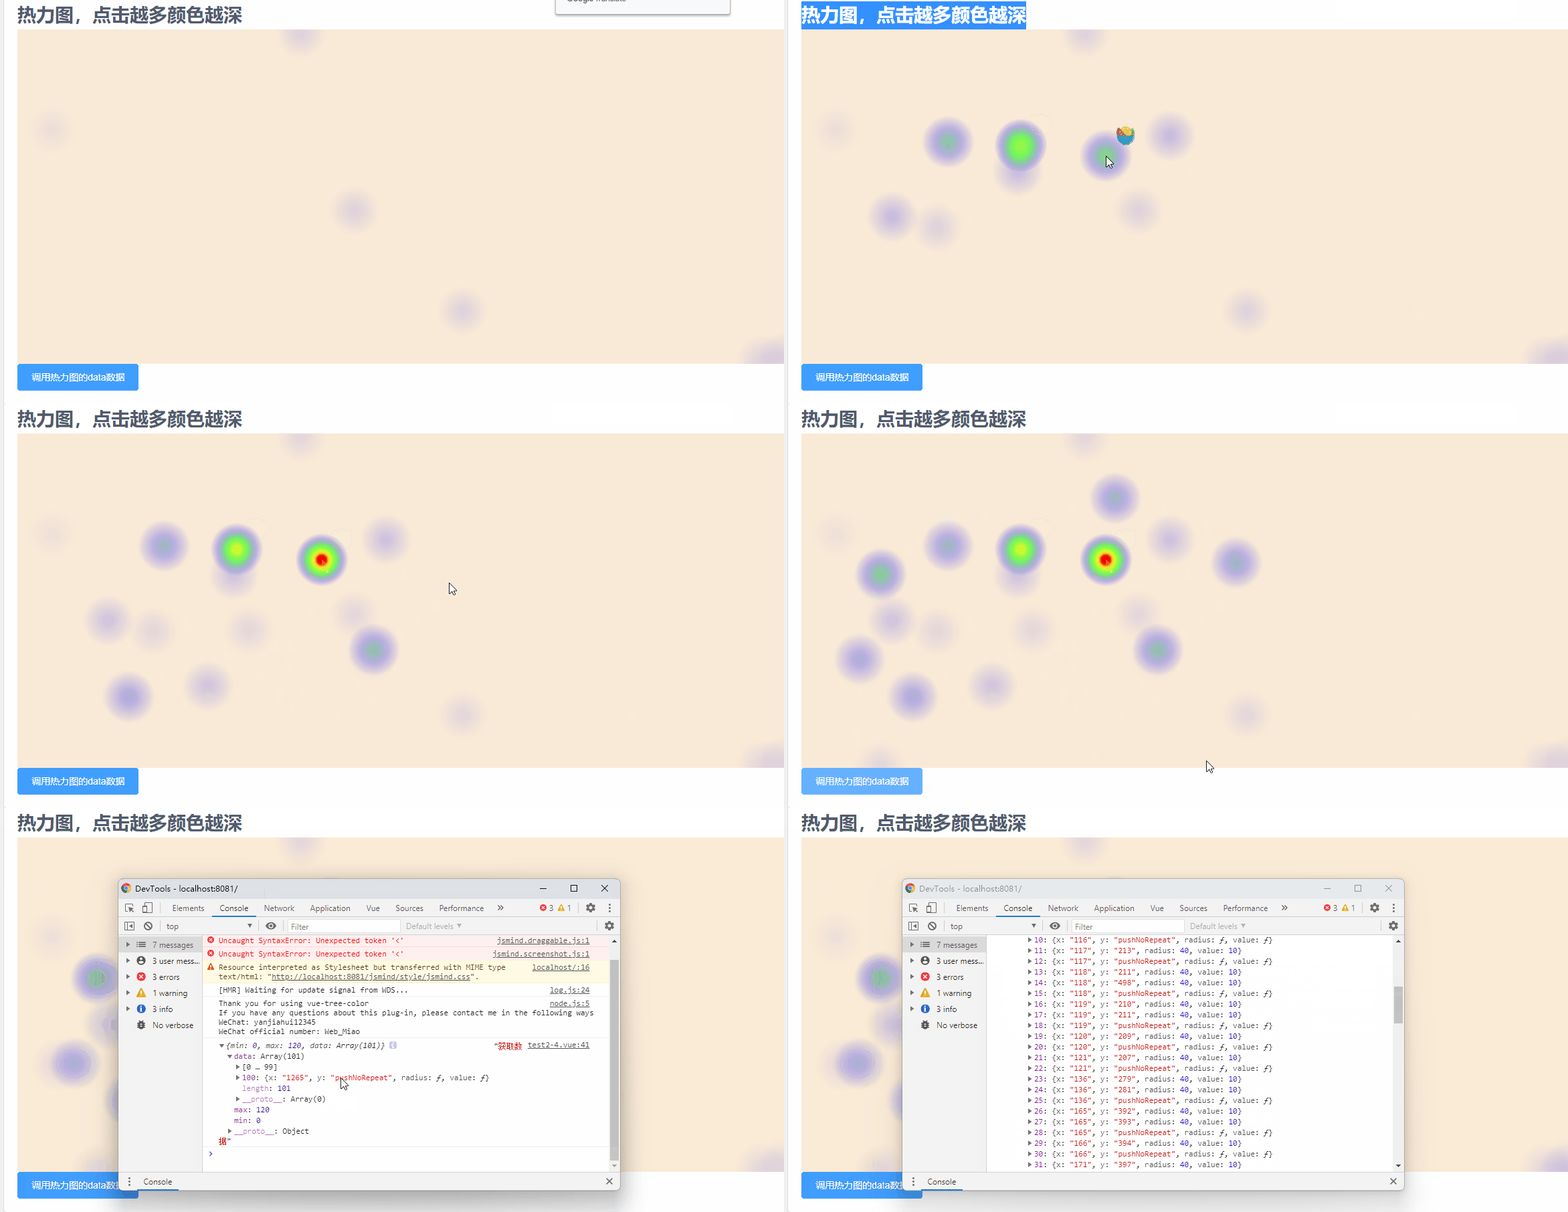
实现效果如下:
点击的次数或者滑动越多,区域的颜色越深

1.下载最新版热力图插件
npm install heatmapjs-vue2.main.js中全局引用
注意!!!只能全局引用,不能局部引用,局部引用就报错显示不出来
import heatmapjsVue from 'heatmapjs-vue'
Vue.use(heatmapjsVue)
3.完整代码
1.ref绑定节点
2.click-drawable:监听的点击事件
3.move-drawable:鼠标滑动也监听
4.draw-value:热力图圆点的大小
5.@change:值改变事件
<template>
    <div class="content-box">
        <div class="container">
          <h1>热力图,点击越多颜色越深</h1>
            <heatmapjs-vue
                ref="headmap"
                class="heatmapjs-container"
                :max="100"
                :min="0"
                :data="data"
                :click-drawable="true"
                :move-drawable="true"
                :draw-value="10"
                @change="heatChange"
            ></heatmapjs-vue>
            <el-button type="primary" @click="handleBtn">调用热力图的data数据</el-button>
        </div>
    </div>
</template>

<script>
export default {
    data() {
        return {
            data: [
                {
                    x: '52',
                    y: '150',
                    radius: 40,
                    value: 5
                }
            ],
        };
    },
    methods: {
        heatChange(arr) {
            this.heatData = arr;
        },
        handleBtn(){
          const res=this.$refs.headmap.getData();
          console.log(res,'获取数据');
        }
    }
};
</script>

<style lang="scss" scoped>
.heatmapjs-container {
    width: 100%;
    height: 500px;
    background-color: antiquewhite;
}
</style>