需求
实现如下效果
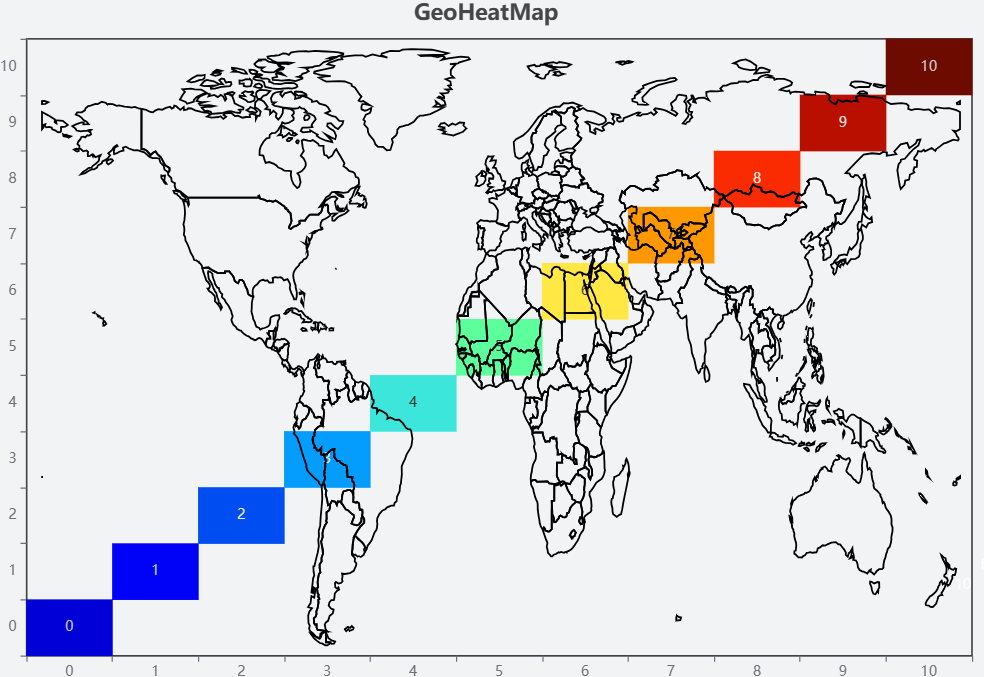
分析
将地图作为背景geo,或在背景中调制贴图
解决
- 附源码
heatmap.vue:
<!--

 - [ ] List item
 * @Description: file content
 * @Version: 2.0
 * @Autor: Hu Kang
 * @Date: 2023-06-12 16:58:58
 * @LastEditors: Hu Kang
 * @LastEditTime: 2023-06-14 16:29:01
 * @FilePath: \src\views\page\echarts\components\GeoHeatMap.vue
-->
<template>
  <div ref="echartsRef" class="content"> </div>
</template>


<script setup lang="ts">
import {


  ref,
  reactive,
  toRefs,
  onMounted,
} from 'vue';
import * as echarts from 'echarts';
import worldMap from '@/assets/resource/map';

echarts.registerMap('world', worldMap);
const echartsData = reactive({


  option: {


    title: {


      top: 20,
      left: 'center',
      text: 'GeoHeatMap'
    },
    geo: [
      {


        map: 'world',
        zoom: 1,
        show: true,
        id: 'geo1',
        selectedMode: false,
        scaleLimit: {


          min: 1,
          max: 100,
        },
        emphasis: {


          disabled: true,
        },
        itemStyle: {


          areaColor: 'rgb(0,0,0,0)',
          borderWidth: 1.5,
          borderColor: 'black',
        },
        tooltip: {


          show: false,
        },
        z: 1000,
        boundingCoords: [
          [-180, 90],
          [180, -90],
        ],
        top: 40,
        height: '95%',
        right: 55,
        width: '85%',
        // regions: [],
        // roam: false, // 禁止移动和缩放
      }
    ],
    grid: {


      top: '8%',
      right: '5%',
      bottom: '13%',
      left: '5%',
      show: true,
      borderWidth: 1,
      borderColor: '#000',
      containLabel: true
    },
    tooltip: {


      show: true,
    },
    xAxis: {


      type: 'category',
      data: [0, 1, 2, 3, 4, 5, 6, 7, 8, 9, 10],
      name: '经度',
      nameGap: 30,
      nameLocation: 'middle',
      nameTextStyle: {


        fontSize: '20px',
      },
      // 格式化x轴
      // axisLabel: {


      // formatter(value: number) {


      //   }
      // }
    },
    yAxis: {


      type: 'category',
      data: [0, 1, 2, 3, 4, 5, 6, 7, 8, 9, 10],
      name: '维度',
      nameGap: 30,
      nameLocation: 'middle',
      nameTextStyle: {


        fontSize: '20px',
      },
      // 格式化x轴
      // axisLabel: {


      // formatter(value: number) {


      //   }
      // }
    },

    visualMap: {


      min: 0,
      max: 10,
      calculable: true,
      realtime: false,
      indicatorSize: '50%',

      orient: 'vertical',
      left: 'right',
      bottom: 'bottom',
      // itemWidth: 15,
      // itemHeight:720,
      inRange: {


        color: [
          '#0100D6',
          '#0000DC',
          '#0002FB',
          '#0226FF',
          '#0057EE',
          '#0082FE',
          '#05A9FE',
          '#4Bc1FE',
          '#33ffc4',
          '#41ffb6',
          '#77ff80',
          '#FFEC65',
          '#FEE310',
          '#FEAE00',
          '#FE6400',
          '#FE3200',
          '#EC0F00',
          '#BC0F00',
          '#980E01',
          '#6D0B00',
        ]
      },
      text: ['begin', 'end'],
      textStyle: {


        color: '#fff'
      },
      outOfRange: {


        color: '#999'
      }
    },
    series: [{


      name: '热力图系列',
      id: 'heatmap',
      type: 'heatmap',
      data: [
        [0, 0, 0],
        [1, 1, 1],
        [2, 2, 2],
        [3, 3, 3],
        [4, 4, 4],
        [5, 5, 5],
        [6, 6, 6],
        [7, 7, 7],
        [8, 8, 8],
        [9, 9, 9],
        [10, 10, 10],
      ],
      label: {


        show: true
      },
      emphasis: {


        itemStyle: {


          shadowBlur: 10,
          shadowColor: 'rgba(0, 0, 0, 0.5)'
        }
      }
    }]
  }

})
const {

     option } = toRefs(echartsData);
const echartsRef = ref<string>();
let echartInstance;
onMounted(() => {


  echartInstance = echarts.init(echartsRef.value, 'macarons');
  echartInstance.setOption(option.value);

});
</script>

<style lang="less" scoped>
.content {


  width: 900px;
  height: 90vh;
}
</style>