0.前言
前一篇用样本数33000在随机和按顺序的情况下进行训练网络,最后在按顺序的情况下得到了95%的准确率和极低的loss值,暂时网络训练到这里,如后期需要再提升精度,只需要增加训练样本即可。
顺带一提,训练完网络之后,保存训练模型的代码是:
pathSaveModel = "./saveModelResult"
if os.path.exists(pathSaveModel):
    pass
else:
    os.mkdir(pathSaveModel)
jsonName = pathSaveModel + "/architecture_" + configName + ".json"
weightName = pathSaveModel +"/weights_" + configName + ".h5"

#logFile.write("jsonName=%s\n" % jsonName)
#logFile.write("weightName=%s\n" % weightName)
#save net
json_string = model.to_json()
open(jsonName,'w').write(json_string)
model.save_weights(weightName)
1.正文
本篇博客用以记载测试该网络可用性的过程,记名为testModel.py的文件,用来实现测试网络的功能。
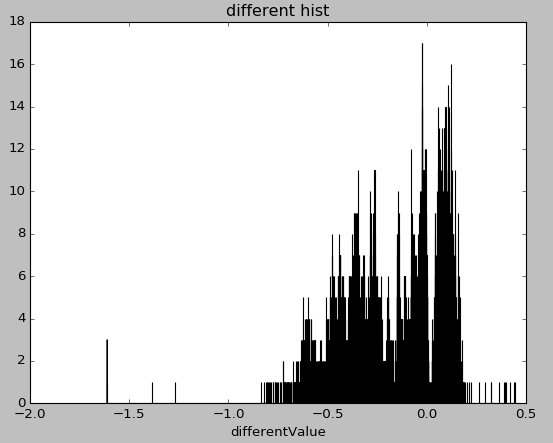
由于目的是为了预测出透视投影变换的内外参数,所以用预测值减去真实的值,画出直方图来表示网络的准确与否。
1.1 随机选择样本进行测试
代码如下:
"""
test the net model, input parameter is sampleNums;
randomFileName: is the list, save the selected file name
testData: save the position message

"""
def testModel(sampleNums, dataFormat):
    print("sampleNums=", sampleNums)
    dataSourceDir = './ResultData/'
    dataLabelDir = './ResultLabel/'
    dataSourceNameLst = os.listdir("./ResultData")
    randomFileName = random.sample(dataSourceNameLst, sampleNums)
    #print(randomFileName)
    randomFileToLabelName = []

    for dataName in randomFileName:
        charTIndex = dataName.index("t")
        charPIndex = dataName.index(".")
        midIndex = dataName[charTIndex+1:charPIndex]
        labelTmpName = 'Result_label' + midIndex + '.csv'
        randomFileToLabelName.append(labelTmpName)

    if dataFormat == 2:
        testData = np.empty((sampleNums, 2, rowColTotalNum))
    elif dataFormat == 1:
        testData = np.empty((sampleNums, rowColTotalNum*2))

    testData_label = np.empty((sampleNums, 5))
    #print(randomFileToLabelName)

    #read the csv file, get the pos
    for fileIterIndex in range(sampleNums):
        #print(fileIterIndex)
        #get sample data
        posXLst = []
        posYLst = []
        with open(dataSourceDir+randomFileName[fileIterIndex], "r") as file:
            reader = csv.reader(file)
            for item in reader:
                itemX = item[0]
                itemY = item[1]
                if itemX[0] == "[" and itemY[0] == "[":
                    itemX = itemX[2:-2]
                    itemY = itemY[2:-2]
                    posXLst.append(float(itemX))
                    posYLst.append(float(itemY))
                else:
                    itemXY = [float(XY) for XY in item]
                    posXLst.append(itemXY[0])
                    posYLst.append(itemXY[1])

        #print("xLst len =", len(posXLst))
        #print("yLst len =", len(posYLst))
        if dataFormat == 2:
            testData[fileIterIndex, 0, :] = posXLst
            testData[fileIterIndex, 1, :] = posYLst
        elif dataFormat == 1:
            posXYLst = []
            for rowColIndex in range(rowColTotalNum):
                posXYLst.append(posXLst[rowColIndex])
                posXYLst.append(posYLst[rowColIndex])
            testData[fileIterIndex, :] = posXYLst
        #print("testData.shape", testData.shape)

        #get label data
        with open(dataLabelDir+randomFileToLabelName[fileIterIndex], "r") as labelFile:
            labelReader = csv.reader(labelFile)
            for item in labelReader:
                #print("item=", item)
                #print("float item=", float(item[0]))
                testData_label[fileIterIndex, 0] = float(item[0])
                testData_label[fileIterIndex, 1] = float(item[1])
                testData_label[fileIterIndex, 2] = float(item[2])
                testData_label[fileIterIndex, 3] = float(item[3])
                testData_label[fileIterIndex, 4] = float(item[4])
        #print(testData_label)

    if dataFormat == 2:
        testData = testData.reshape(sampleNums, 858)
通过以上代码即可加载测试样本,接着使用上文保存的网络模型,进行预测。
#data get done, test model
    model = model_from_json(open('./saveModelResult/samplesNum33000dataFormat1Random0.json').read())
    model.load_weights('./saveModelResult/samplesNum33000dataFormat1Random0.h5')

    predictValueArray = model.predict(testData, verbose=0)
预测出结果之后,进行直方图的绘制。
def plotHist(figName, differLst, binsNum):
    fig = plt.figure(figName)
    plt.title("different hist")
    plt.xlabel("differentValue")
    plt.hist(differLst, bins=binsNum, histtype='bar')
    plt.show()
传入三个值,第一个值是绘制的图片名, 第二个是得到的差的list, 第三个是bins的值,取与样本数一致。
2.结果展示
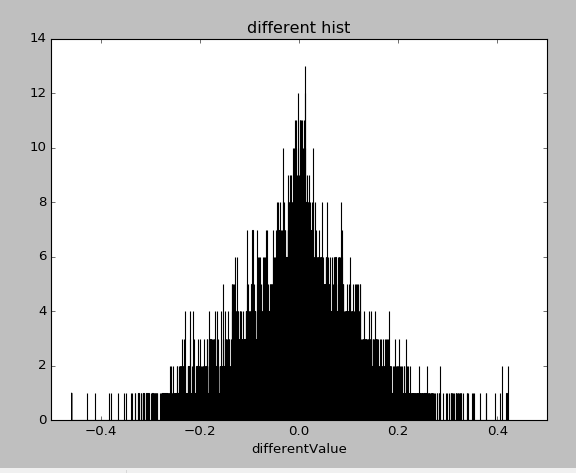
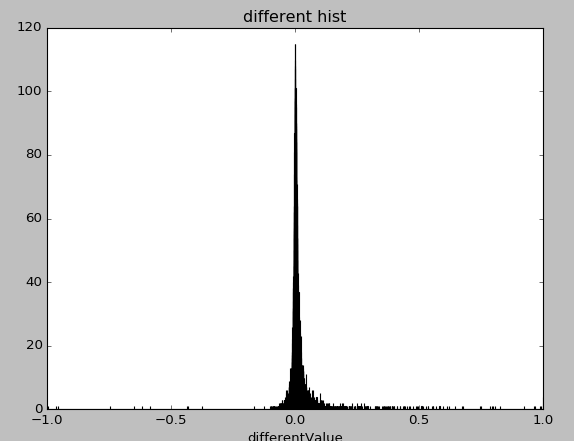
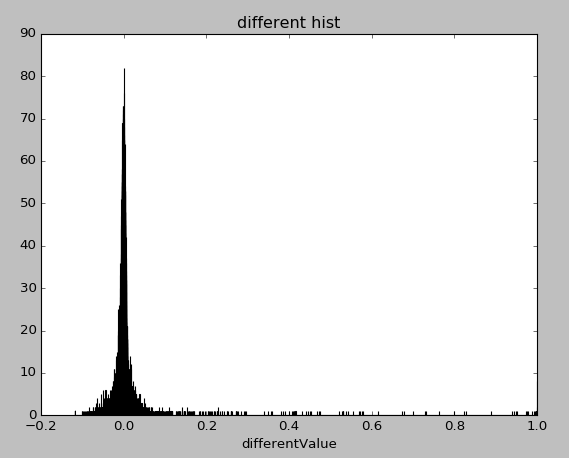
测试样本数为11000,pitch, roll, heading, dx, dy 依次结果如下:
扫描二维码关注公众号,回复:
1570245 查看本文章


3.后期任务
以上实现了神经网络预测,测试网络。接下来的任务就是根据预测到的5个值,以及进网络的变形坐标值, 逆映射到世界坐标,然后统计偏差值。
任务总结:
1)找寻透视投影变换的逆变换资料
2)进行编程,实现逆变换的功能
3)编写计算偏置的代码,画出直方图或者其他来可视化最后的结果
预期两天时间完成,白天要练车,好烦啊。。。。