 **1.  设置两个series,一个series正常显示圆环图,另外一个圆环图设置背景图,通过label的富文本自定义样式来设置背景图
            - 设置第二个圆环:
                 - 在data中设置value为100%,
                 - 设置label的自定义富文本,并设置文字居中显示,位置居中显示
                         - 关于背景图的宽高设置,通过echarts获取画布的大小,根据看图得知位置偏左,width/2 - (减去grid.left,自行调整)
                 - 并把当前(第二个)圆环图的层级设置低一点,例如:z:1,圆环图默认的层级是2,所以第二个层级设置成1
2.  想要缩放的时候依旧保持原来不变,  通过监听浏览器窗口大小变化事件,把option在设置一遍
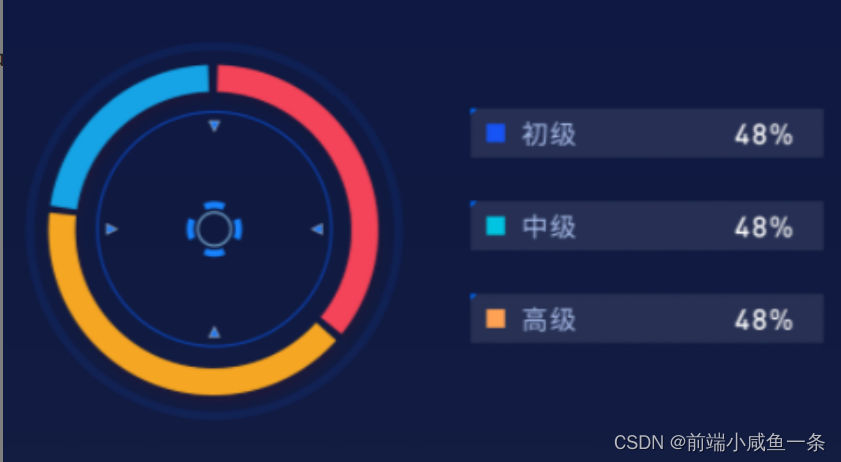
原图:
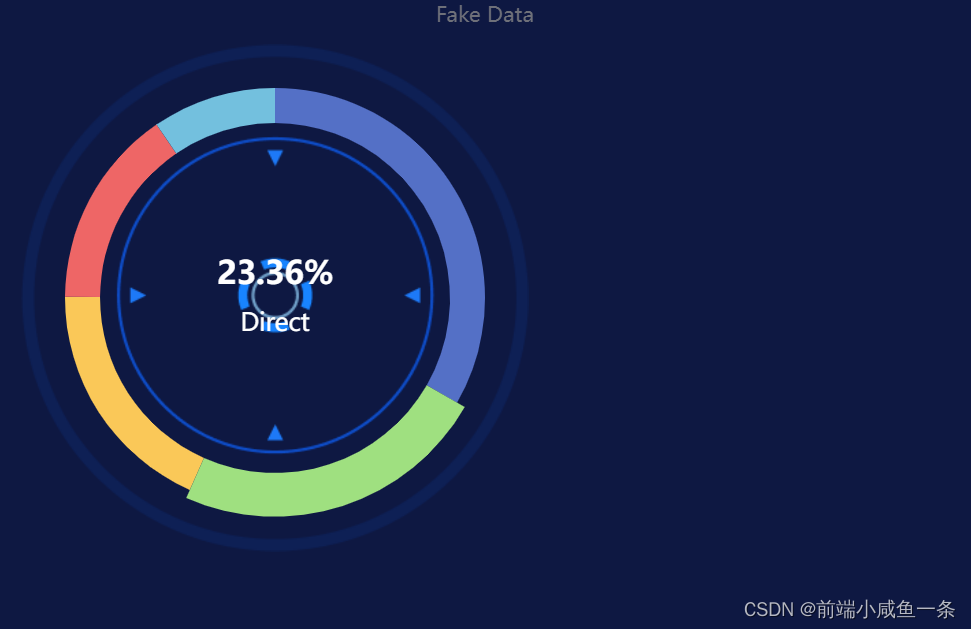
demo图:

核心代码:
 {


                    type: 'pie',
                    center: ['30%', '50%'],
                    radius: ['60%', '60%'],
                    hoverAnimation:false,
                    silent:true
                    data: [{


                        value: 100,
                        z: 1,
                        label: {


                            show: true,
                            position: 'center',
                            formatter: () => {


                                return `{bg|}`
                            },
                            rich: {


                                bg: {


                                    left: 'center',
                                    width: (width / 2)-10,
                                    height: (width / 2)-10,
                                    backgroundColor: {


                                        image: './pie-center-bg.png'
                                    }
                                }
                            }
                        }

                    }],data: [{


                        value: 100,
                        z: 1,
                        label: {


                            show: true,
                            position: 'center',
                            formatter: () => {


                                return `{bg|}`
                            },
                            rich: {


                                bg: {


                                    left: 'center',
                                    width: (width / 2)-10,
                                    height: (width / 2)-10,
                                    backgroundColor: {


                                        image: './pie-center-bg.png'
                                    }
                                }
                            }
                        }

                    }],


}
完整代码:
<!DOCTYPE html>
<html lang="en">

<head>
    <meta charset="UTF-8">
    <meta name="viewport" content="width=device-width, initial-scale=1.0">
    <title>Document</title>
    <script src="https://cdn.bootcdn.net/ajax/libs/echarts/5.4.2/echarts.common.js"></script>
    <!-- <script src="./node_modules/requirejs/re"></script> -->
    <script src="https://cdn.bootcdn.net/ajax/libs/require.js/2.3.6/require.js"></script>
    <script type="text/javascript" src="https://requirejs.org/docs/release/2.3.6/r.js"></script>

</head>

<body>
    <div id="echarts01" style="width: 600px;height: 400px;background-color: #0e1842;"></div>
    <script>

        const echartDom = document.getElementById('echarts01')
        const mychart = echarts.init(echartDom)
        const data = [
            {

     value: 1048, name: 'Search Engine' },
            {

     value: 735, name: 'Direct' },
            {

     value: 580, name: 'Email' },
            {

     value: 484, name: 'Union Ads' },
            {

     value: 300, name: 'Video Ads' }
        ]

        const width = mychart.getWidth()
        option = {


            title: {


                text: 'Referer of a Website',
                subtext: 'Fake Data',
                left: 'center'
            },
            grid: {


                bottom: '10px',
                left: '10px',
            },
            series: [
                {


                    type: 'pie',
                    center: ['30%', '50%'],
                    radius: ['50%', '60%'],
                    data: data,
                    emphasis: {


                        label: {


                            show: true
                        }
                    },
                    z:10,
                    backgroundColor:'transparent',
                    label: {


                        show: false,
                        color: '#fff',
                        position: 'center',
                        formatter: (params) => {


                            return `{num|${

      params.percent}%}\n\n{name|${

      params.name}}`
                        },
                        rich: {


                            color: '#fff',
                            name: {


                                fontSize: 14,
                            },
                            num: {


                                fontSize: 18,
                                fontWeight: 'bolder',
                            }
                        }
                    }
                },
                {


                    type: 'pie',
                    center: ['30%', '50%'],
                    radius: ['60%', '60%'],
                    hoverAnimation:false,//鼠标经过的动画
                    animation:false,
                    selectedMode:false,
                    silent:true, //不响应和触发鼠标事件
                    tooltip: {


                        show: false
                    },
                    itemStyle:{


                        normal:{


                            label:{

    show:false},
                            labelLine:{

    show:false},
                            color:'rgba(255,144,0,0.4)'
                        }
                    },
                    data: [{


                        value: 100,
                        z: 1,
                        label: {


                            show: true,
                            position: 'center',
                            formatter: () => {


                                return `{bg|}`
                            },
                            rich: {


                                bg: {


                                    left: 'center',
                                    width: (width / 2)-10,
                                    height: (width / 2)-10,
                                    backgroundColor: {


                                        image: './pie-center-bg.png'
                                    }
                                }
                            }
                        }

                    }],
                }

            ]
        };

        mychart.setOption(option)

        function resizeEcharts() {


            mychart.setOption(option)
        }
        window.addEventListener('resize', resizeEcharts)
    </script>
</body>

</html>