安装地图(中国省份地图、城市地图等等) pyecharts 版本 '1.9.1'
!pip install echarts-countries-pypkg
!pip install echarts-china-provinces-pypkg
!pip install echarts-china-cities-pypkg
!pip install echarts-china-counties-pypkg
!pip install echarts-china-misc-pypkg
!pip install echarts-united-kingdom-pypkg
输入数据
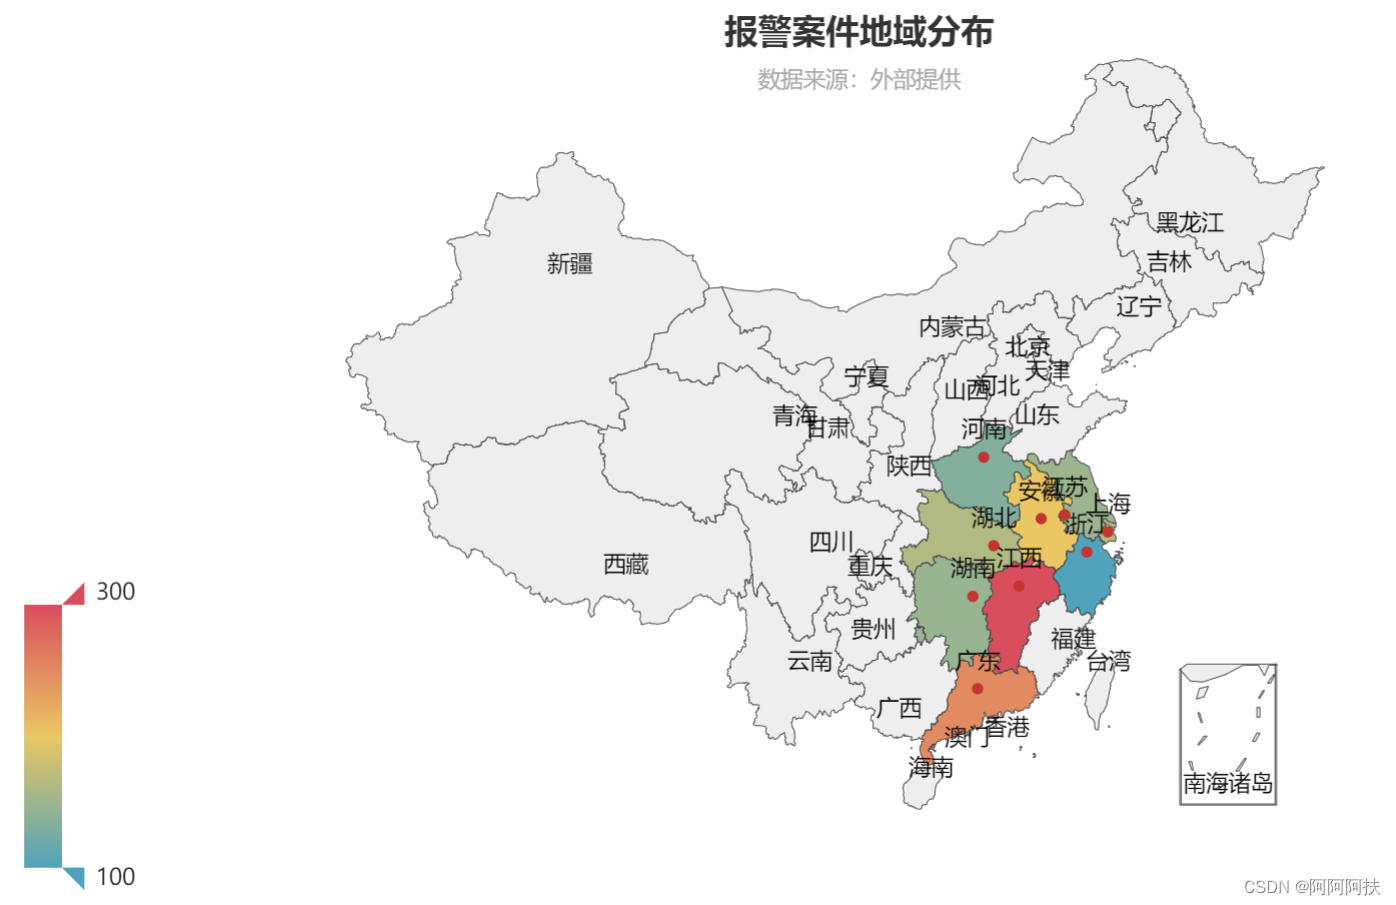
from pyecharts.charts import Map
from pyecharts import options as opts

data=[('浙江', 100), ('江苏', 150), ('上海', 166), ('湖南', 147),
      ('安徽', 200), ('广东', 250), ('湖北', 163), ('河南', 133),
     ('江西', 300)]
_max = 4000
_min = 20

map_ = Map()
map_.add("", data, maptype="china", zoom=1)
map_.set_global_opts(

    title_opts=opts.TitleOpts(title="报警案件地域分布",
                              subtitle="数据来源:外部提供",
                              pos_right="center",
                              pos_top="5%"),

    visualmap_opts=opts.VisualMapOpts(max_=_max,
                                      min_=_min
                                     ),
    )
map_.render("region_all.html")
绘制结果 生成一个网页,鼠标移动可以显示各个省份的具体信息