绘图
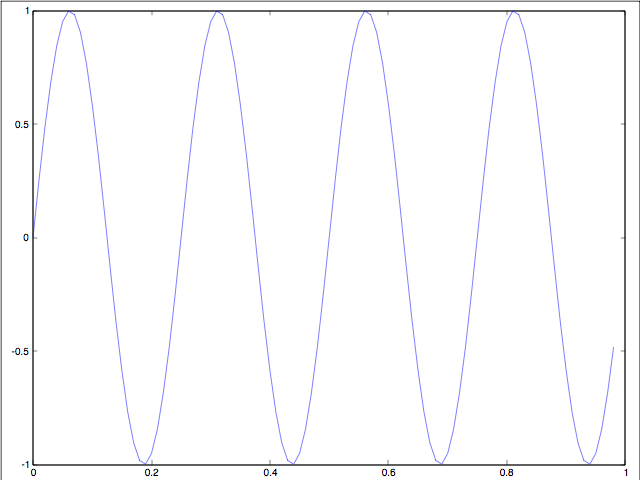
>> t=[0:0.01:0.98];
>> y1 = sin(2*pi*4*t);
>> plot(t,y1);
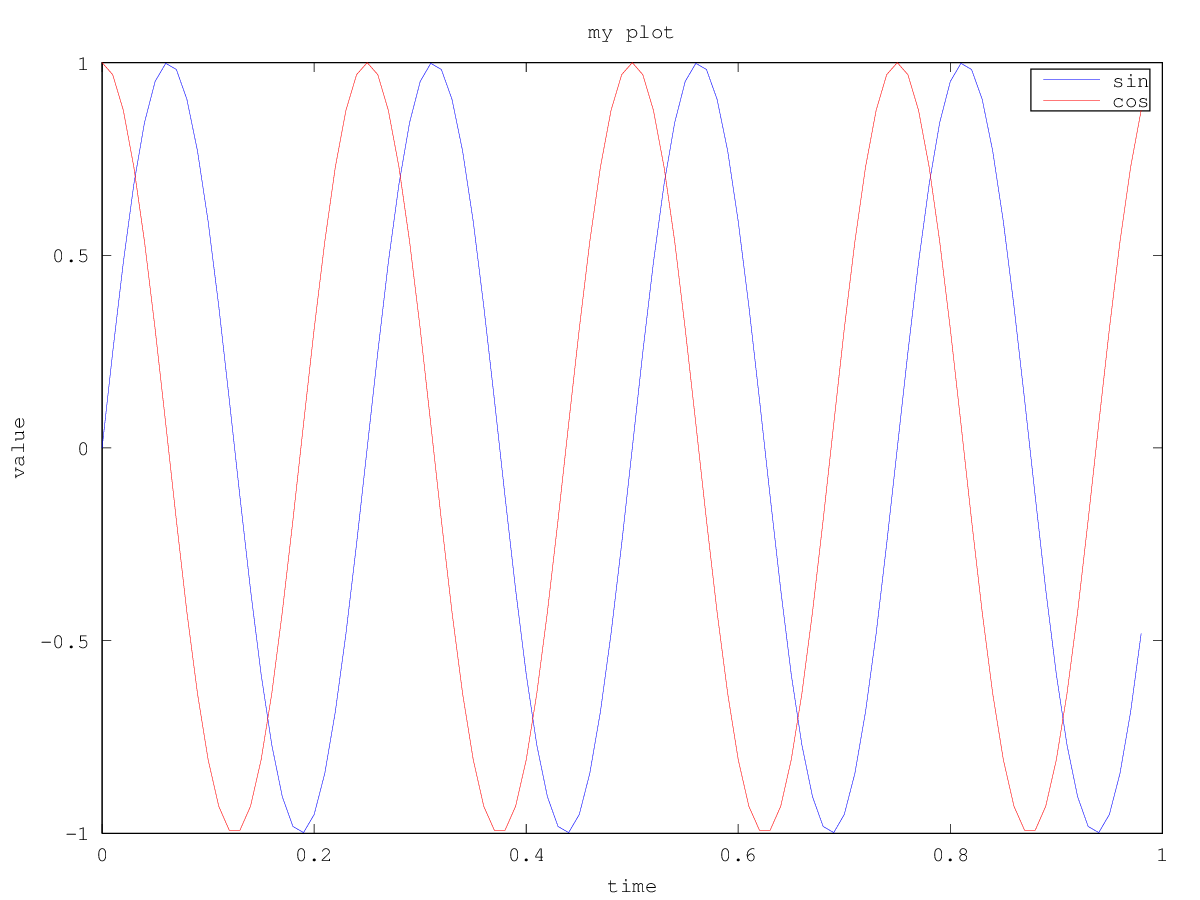
>> y2 = cos(2*pi*4*t);
>> plot(t, y1);
>> hold on; % hold on函数 的功能是将 新的图像绘制在 旧的之上>> plot(t, y2, 'r'); %r代表红色>> xlabel('time') %标记X轴即水平轴>> ylabel('value') >> legend('sin', 'cos') %用这个命令 legend('sin', 'cos') 将这个 图例放在右上方 表示这两条曲线表示的内容>> title('my plot')>> print -dpng 'myplot.png' %输出
>> close %最后关掉图片
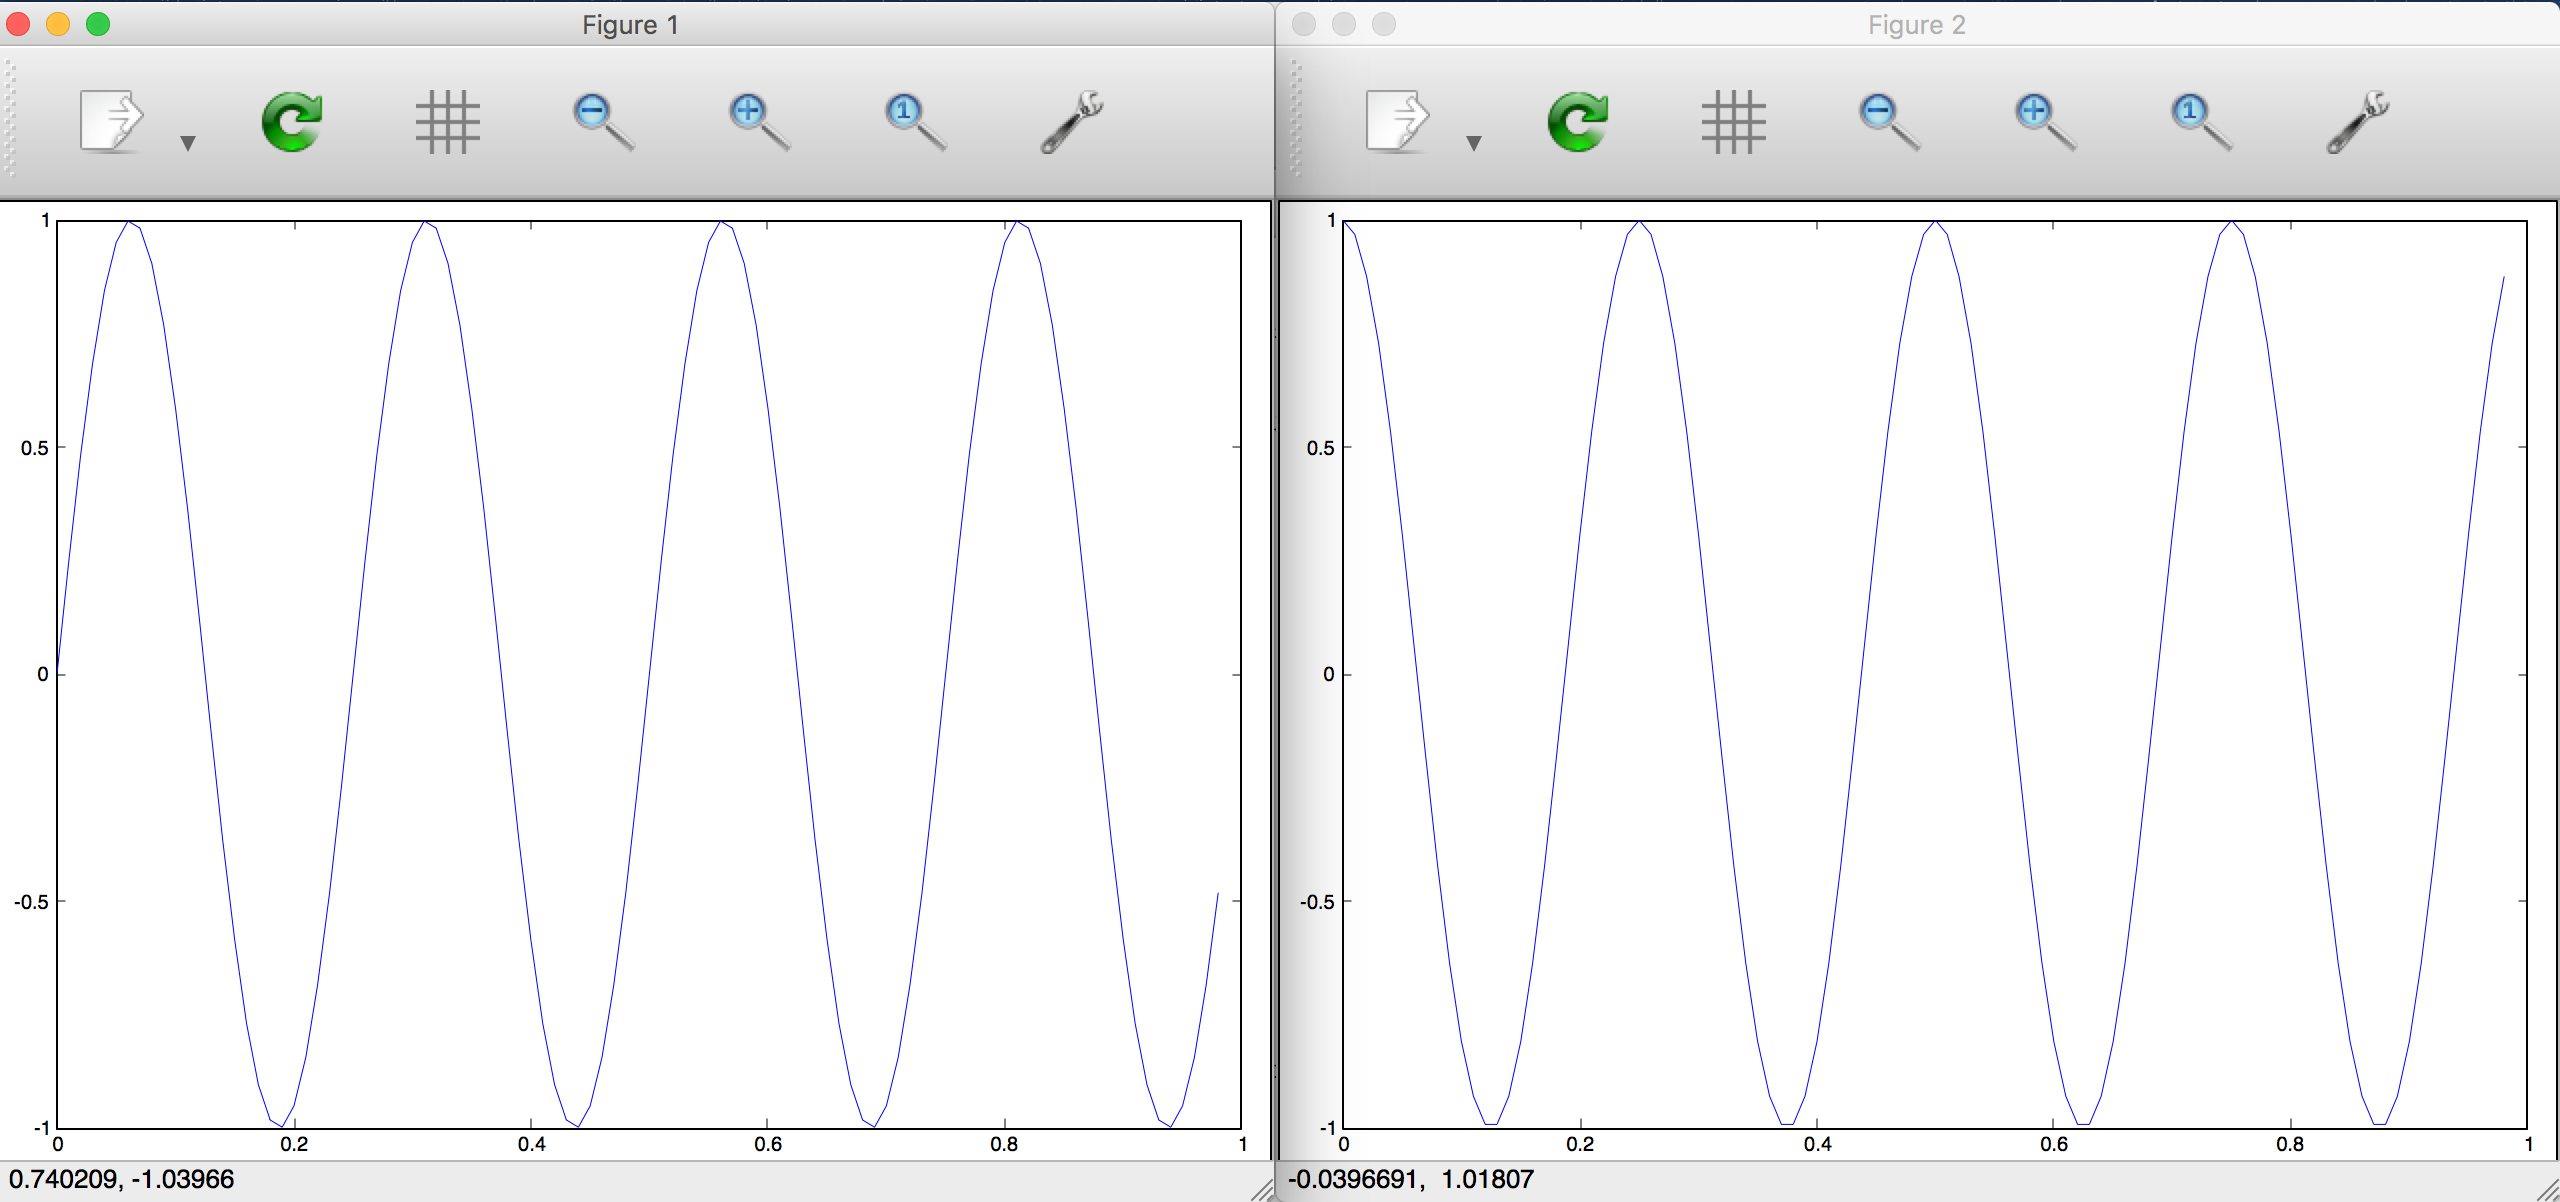
>> figure(1); plot(t, y1); %为图像标号,这样可以开启多个窗口
>> figure(2); plot(t, y2);
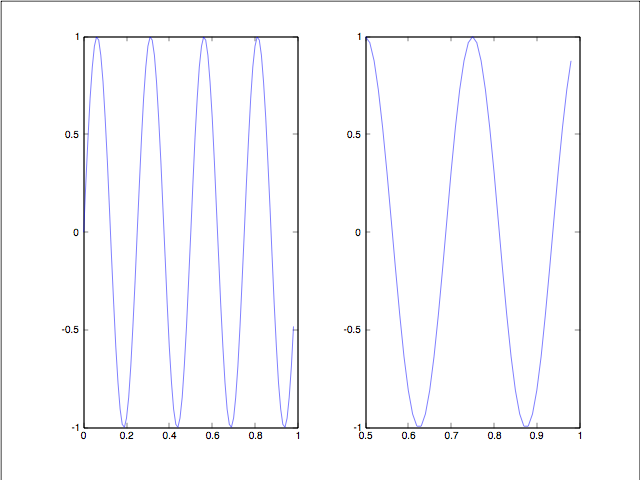
>> subplot(1,2,1);  %它将图像 分为一个 1*2的格子 也就是前两个参数 然后它使用 第一个格子 也就是最后一个参数1的意思
>> plot(t, y1);
>> subplot(1,2,2);
>> plot(t, y2);
>> axis([0.5 1 -1 1])  %可以 改变轴的刻度 比如改成 也就是设置了 右边图的x轴 和y轴的范围 具体而言 它将 右图中的横轴 的范围调整至0.5到1 竖轴的范围为 -1到1
>> clf;  %清除 一幅图像
>> A = magic(5);
>> imagesc(A)  % 一个5*5的彩色格图 不同的颜色对应 A矩阵中的不同值

>> imagesc(A), colorbar, colormap gray; %在同一时间运行三个命令 运行imagesc然后运行 colorbar 然后运行colormap gray 它生成了 一个颜色图像 一个灰度分布图 并在 右边也加入一个颜色条 所以这个颜色条 显示不同深浅的颜色所对应的值
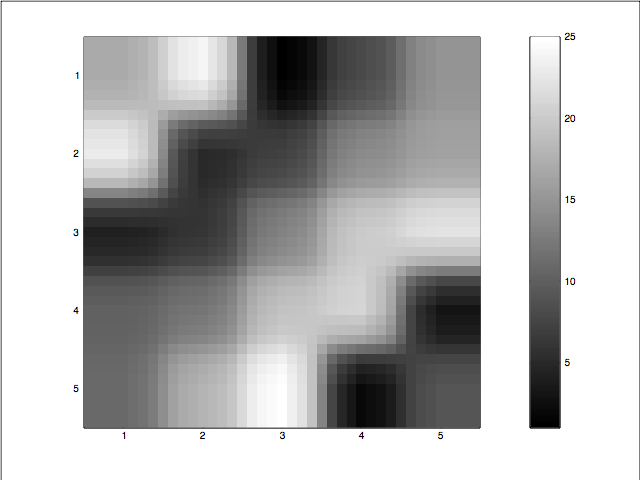
>> A
A =
   17   24    1    8   15
   23    5    7   14   16
    4    6   13   20   22
   10   12   19   21    3
   11   18   25    2    9
可以自己对这些值进行对照
使用逗号连接函数调用,或者更便捷的方式 将多条命令写在同一行中 代表同时执行这些命令
参考资料
https://www.coursera.org/learn/machine-learning/