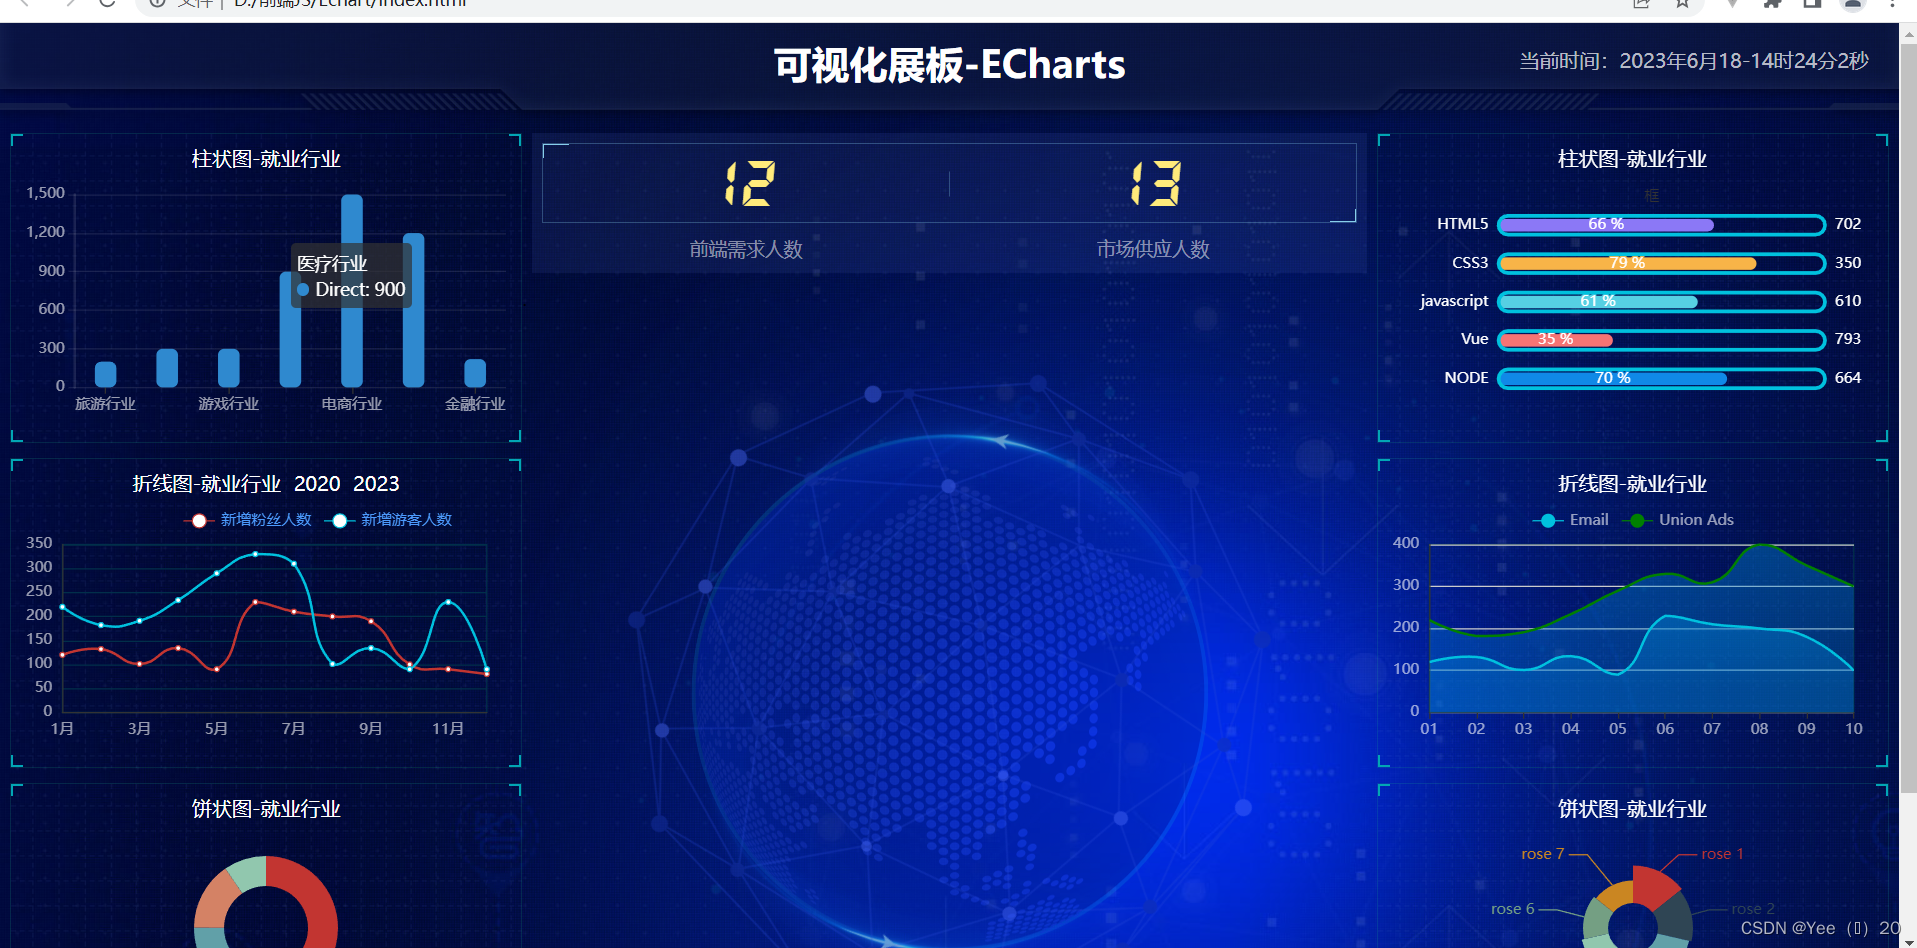
介绍:这个小项目是用来echart以及jQuery
HTML源码
<!DOCTYPE html>
<html lang="en">

<head>
    <meta charset="UTF-8">
    <meta http-equiv="X-UA-Compatible" content="IE=edge">
    <meta name="viewport" content="width=device-width, initial-scale=1.0">
    <title>Echart可视化</title>
    <link rel="stylesheet" href="./css/index.css">
</head>

<body>
    <header>
        <h1>可视化展板-ECharts</h1>
        <div class="showTime">当前时间为:2020年3月17-0时54分14秒</div>
    </header>
    <section class="minbox">
        <div class="column">
            <div class="panel">
                <div class="bar">
                    <h2>柱状图-就业行业</h2>
                    <div class="chart"></div>
                </div>
                <div class="panel-footer"></div>
            </div>
            <div class="panel">
                <div class="line1">
                    <h2>折线图-就业行业<a id="" href="javascript:;">2020</a><a href="javascript:;">2023</a></h2>

                    <div class="chart"></div>
                </div>
                <div class="panel-footer"></div>
            </div>
            <div class="panel">
                <div class="pie1">
                    <h2>饼状图-就业行业</h2>
                    <div class="chart"></div>
                </div>
                <div class="panel-footer"></div>
            </div>
        </div>
        <div class="column">
            <!-- no模块 -->
            <div class="no">
                <div class="no-hd">
                    <ul>
                        <li>12</li>
                        <li>13</li>
                    </ul>
                </div>
                <div class="no-bd">
                    <ul>
                        <li>前端需求人数</li>
                        <li>市场供应人数</li>
                    </ul>
                </div>
            </div>
            <!-- 地图模块 -->
            <div class="map">
                <div class="map-img"></div>
                <div class="mapbg1"></div>
                <div class="mapbg2"></div>
                .
            </div>

        </div>
        <div class="column">
            <div class="panel">
                <div class="bar2">
                    <h2>柱状图-就业行业</h2>
                    <div class="chart"></div>
                </div>
                <div class="panel-footer"></div>
            </div>
            <div class="panel">
                <div class="line2">
                    <h2>折线图-就业行业</h2>
                    <div class="chart"></div>
                </div>
                <div class="panel-footer"></div>
            </div>
            <div class="panel">
                <div class="pie2">
                    <h2>饼状图-就业行业</h2>
                    <div class="chart"></div>
                </div>
                <div class="panel-footer"></div>
            </div>
        </div>
    </section>
</body>
<script>
    var t = null;
    t = setTimeout(time, 1000);//開始运行
    function time() {
        clearTimeout(t);//清除定时器
        dt = new Date();
        var y = dt.getFullYear();
        var mt = dt.getMonth() + 1;
        var day = dt.getDate();
        var h = dt.getHours();//获取时
        var m = dt.getMinutes();//获取分
        var s = dt.getSeconds();//获取秒
        document.querySelector(".showTime").innerHTML = '当前时间:' + y + "年" + mt + "月" + day + "-" + h + "时" + m + "分" + s + "秒";
        t = setTimeout(time, 1000); //设定定时器,循环运行
    }
</script>
<script src="./js/flexible.js"></script>
<script src="./js/echarts.min.js"></script>
<script src="./js/jquery.js"></script>
<script src="./js/index.js"></script>

</html>
JS
// 利用立即执行函数,这样可以解决命名冲突的问题
(function () {
var myEchart = echarts.init(document.querySelector(".bar .chart"))
var option = {
color: ["rgb(47,137,207)"],
tooltip: {
trigger: 'axis',
axisPointer: {
type: 'shadow'
}
},
grid: {
left: '0%',
top: "10px",
right: '0%',
bottom: '4%',
// 刻度标签
containLabel: true
},
xAxis: [
{
type: 'category',
data: ['旅游行业', '教育培训', '游戏行业', '医疗行业', '电商行业', '社交行业', '金融行业'],
axisTick: {
alignWithLabel: true
},
// 修改刻度标签样式
axisLabel: {
color: "rgba(255,255,255,.6)",
fontSize: "12"
},
// 不显示x轴样式
axisLine: {
show: false
}
}
],
yAxis: [
{
type: 'value',
axisLabel: {
color: "rgba(255,255,255,.6)",
fontSize: '12'
},
axisLine: {
lineStyle: {
color: "rgba(255,255,255,.1)",
// 修改y轴大小
width: 2
}
},
// y轴分割线样式设置
splitLine: {
lineStyle: {
color: "rgba(255,255,255,.1)"
}
}
},
],
series: [
{
name: 'Direct',
type: 'bar',
// 柱子宽度
barWidth: '35%',
data: [200, 300, 300, 900, 1500, 1200, 220],
// 修改柱子样式
itemStyle: {
// 给他设置圆角
barBorderRadius: 5
}
}
]
};
myEchart.setOption(option);
// 添加一个监听器,屏幕发生变化,则柱形图也变化
window.addEventListener("resize", function () {
myEchart.resize();
})
})();
// 第二个柱状图
(function () {
// 颜色数组
var mycolor = ["#1089E7", "#F57474", "#56D0E3", "#F8B448", "#8B78F6"];
var myEchart = echarts.init(document.querySelector(".bar2 .chart"));
var option = {
tooltip: {
trigger: 'axis',
axisPointer: {
type: 'shadow'
}
},
legend: {},
grid: {
top: '10%',
left: '22%',
bottom: '10%',
// containLabel: true
},
xAxis: {
show: false
},
yAxis: [{
type: 'category',
data: ['NODE', 'Vue', 'javascript', 'CSS3', 'HTML5'],
axisLabel: {
color: "white",
},
axisLine: {
show: false
},
axisTick: {
show: false
}
},
{
type: 'category',
data: ['664', '793', '610', '350', '702'],
axisLabel: {
color: "white",
},
axisLine: {
show: false
},
axisTick: {
show: false
}
}],
series: [
{
type: 'bar',
yAxisIndex: 0,
data: [70, 35, 61, 79, 66],
itemStyle: {
barBorderRadius: 20,
// barBorder: "2px solid blue"
},
barWidth: 10,
yAxisIndex: 0,
barCategoryGap: 50,
label: {
show: true,
position: "inside",
formatter: "{c} %"
},
color: function (params) {
return mycolor[params.dataIndex]
}
},
{
type: 'bar',
name: '框',
data: [100, 100, 100, 100, 100],
barWidth: 15,
yAxisIndex: 1,
itemStyle: {
color: "none",
borderColor: "#00c1de",
barBorderRadius: 20,
borderWidth: 3
},
}
]
};
myEchart.setOption(option);
window.addEventListener("resize", function () {
myEchart.resize();
})
})();
// 第一个折线图
(function () {
var yearData = [
{
year: '2020',
data: [[120, 132, 101, 134, 90, 230, 210, 200, 190, 100, 90, 80], [220, 182, 191, 234, 290, 330, 310, 101, 134, 90, 230, 90]]
},
{
year: '2023',
data: [[100, 90, 80, 230, 130, 203, 201, 231, 201, 200, 199, 90], [120, 180, 200, 150, 100, 90, 80, 300, 200, 190, 100, 200]]
}
];
var MyEchart = echarts.init(document.querySelector(".line1 .chart"))
var option = {
tooltip: {
trigger: 'axis'
},
// 图例组件
legend: {
data: ['新增粉丝人数', '新增游客人数'],
// 文字颜色
textStyle: {
color: '#4c9bfd'
},
right: '10%',
},
grid: {
left: '0%',
top: "30px",
right: '4%',
bottom: '4%',
// 刻度标签
containLabel: true,
show: true,
// 边框颜色
borderColor: "#012f4a"
},
xAxis: {
type: 'category',
boundaryGap: false,
data: ['1月', '2月', '3月', '4月', '5月', '6月', '7月', '8月', '9月', '10月', '11月', '12月'],
axisLabel: {
color: "rgba(255,255,255,.6)",
},
axisTick: {
show: false
}
},
yAxis: {
type: 'value',
axisLabel: {
color: "rgba(255,255,255,.6)",
},
axisTick: {
show: false
},
splitLine: {
lineStyle: {
color: "#012f4a"
}
}
},
series: [
{
name: '新增粉丝人数',
type: 'line',
// stack: 'Total',stack为是否数据层叠
// smooth设置是否为平滑显示
smooth: true,
data: yearData[0].data[0]
},
{
name: '新增游客人数',
type: 'line',
smooth: true,
// stack: 'Total',
data: yearData[0].data[1],
itemStyle: {
color: '#00c1de'
}
}
]
};
MyEchart.setOption(option);
$(".panel .line1 h2").on("click", 'a', function () {
$(this).siblings().css("color", "white");
$(this).css("color", "red");
option.series[0].data = yearData[$(this).index()].data[0];
option.series[1].data = yearData[$(this).index()].data[1];
// 要重新渲染一次
MyEchart.setOption(option);
});
window.addEventListener("resize", function () {
MyEchart.resize();
})
})();
// 第二个折线图
(function () {
var myEchart = echarts.init(document.querySelector(".panel .line2 .chart"));
var option = {
tooltip: {
trigger: 'axis',
axisPointer: {
// type: 'cross',
label: {
backgroundColor: '#6a7985'
}
}
},
legend: {
data: ['Email', 'Union Ads'],
textStyle: {
color: "rgba(255,255,255,.6)"
}
},
grid: {
left: '0%',
top: "30px",
right: '4%',
bottom: '4%',
// 刻度标签
containLabel: true,
show: true,
// 边框颜色
borderColor: "#012f4a"
},
xAxis: [
{
type: 'category',
boundaryGap: false,
data: ['01', '02', '03', '04', '05', '06', '07', '08', '09', '10'],
axisLabel: {
color: "rgba(255,255,255,.6)"
}
}
],
yAxis: [
{
type: 'value',
axisLabel: {
color: "rgba(255,255,255,.6)"
},
axisTick: {
show: false,
}
}
],
series: [
{
name: 'Email',
type: 'line',
smooth: true,
showSymbol: false,
areaStyle: {
color: new echarts.graphic.LinearGradient(
0,
0,
0,
1,
[
{
offset: 0,
color: "rgba(1,132,213,0.6)"
},
{
offset: 0.8,
color: "rgba(1,132,213,0.4)"
}
],
false
),
shadowColor: "rgba(0,0,0,.1)"
},
symbol: 'circle',
symbolSize: 8,
itemStyle: {
color: '#00c1de',
borderColor: "rgba(221, 220, 107, .1) ",
borderWidth: 12,
},
emphasis: {
focus: 'series'
},
data: [120, 132, 101, 134, 90, 230, 210, 200, 180, 100]
},
{
name: 'Union Ads',
type: 'line',
smooth: true,
symbol: 'circle',
symbolSize: 8,
showSymbol: false,
itemStyle: {
color: 'green',
borderColor: "rgba(221,220,107,.1)",
borderWidth: 12,
},
areaStyle: {
color: new echarts.graphic.LinearGradient(
0,
0,
0,
1,
[
{
offset: 0,
color: "rgba(1,132,213,0.6)"
},
{
offset: 0.8,
color: "rgba(1,132,213,0.4)"
}
],
false
),
shadowColor: "rgba(0,0,0,.1)"
},
emphasis: {
focus: 'series'
},
data: [220, 182, 191, 234, 290, 330, 310, 400, 350, 300]
}
]
};
myEchart.setOption(option);
window.addEventListener("resize", function () {
myEchart.resize();
})
})();
(function () {
var myEchart = echarts.init(document.querySelector(".pie1 .chart"));
var option = {
tooltip: {
trigger: 'item'
},
legend: {
bottom: '0%',
left: 'center',
itemWidth: 10,
itemHeight: 10,
textStyle: {
color: "rgba(255,255,255,.6)",
fontSize: '12'
}
},
series: [
{
name: 'Access From',
type: 'pie',
// 内外圆半径
radius: ['35%', '60%'],
avoidLabelOverlap: false,
label: {
show: false,
position: 'center'
},
// 修改位置
center: ['50%', '40%'],
// emphasis: {
// label: {
// show: true,
// fontSize: 40,
// fontWeight: 'bold'
// }
// },
labelLine: {
show: false
},
data: [
{ value: 1048, name: 'Search Engine' },
{ value: 735, name: 'Direct' },
{ value: 580, name: 'Email' },
{ value: 484, name: 'Union Ads' },
{ value: 300, name: 'Video Ads' }
]
}
]
};
myEchart.setOption(option);
window.addEventListener("resize", function () {
myEchart.resize();
})
})();
// 第二个饼图
(function () {
var myEchart = echarts.init(document.querySelector(".panel .pie2 .chart"));
var option = {
tooltip: {
trigger: 'item',
formatter: '{a} <br/>{b} : {c} ({d}%)'
},
legend: {
bottom: '0%',
itemWidth: 10,
itemHeight: 10,
textStyle: {
fontSize: 12,
color: "white",
}
},
series: [
{
// 通过面积来表示占比大小
name: 'Area Mode',
type: 'pie',
radius: [20, 50],
center: ['50%', '40%'],
roseType: 'area',
itemStyle: {
borderRadius: 5
},
data: [
{ value: 30, name: 'rose 1' },
{ value: 28, name: 'rose 2' },
{ value: 26, name: 'rose 3' },
{ value: 24, name: 'rose 4' },
{ value: 22, name: 'rose 5' },
{ value: 20, name: 'rose 6' },
{ value: 18, name: 'rose 7' }
]
}
]
};
myEchart.setOption(option);
})()(function flexible(window, document) {
var docEl = document.documentElement;
var dpr = window.devicePixelRatio || 1;
// adjust body font size
function setBodyFontSize() {
if (document.body) {
document.body.style.fontSize = 12 * dpr + "px";
} else {
document.addEventListener("DOMContentLoaded", setBodyFontSize);
}
}
setBodyFontSize();
// set 1rem = viewWidth / 10
function setRemUnit() {
var rem = docEl.clientWidth / 24;
docEl.style.fontSize = rem + "px";
}
setRemUnit();
// reset rem unit on page resize
window.addEventListener("resize", setRemUnit);
window.addEventListener("pageshow", function(e) {
if (e.persisted) {
setRemUnit();
}
});
// detect 0.5px supports
if (dpr >= 2) {
var fakeBody = document.createElement("body");
var testElement = document.createElement("div");
testElement.style.border = ".5px solid transparent";
fakeBody.appendChild(testElement);
docEl.appendChild(fakeBody);
if (testElement.offsetHeight === 1) {
docEl.classList.add("hairlines");
}
docEl.removeChild(fakeBody);
}
})(window, document);
CSS
* {
  margin: 0;
  padding: 0;
  box-sizing: border-box;
}
@font-face {
  font-family: electronicFont;
  src: url('../font//DS-DIGIT.TTF');
}
body {
  background: url('../images/bg.jpg') no-repeat;
  line-height: 1.15;
}
header {
  height: 1.25rem;
  background: url('../images/head_bg.png') no-repeat;
  background-size: 100% 100%;
}
header h1 {
  color: white;
  text-align: center;
  line-height: 1rem;
  font-size: 0.475rem;
}
header .showTime {
  position: absolute;
  right: 0.375rem;
  top: 0;
  line-height: 0.9375rem;
  color: rgba(255, 255, 255, 0.7);
  font-size: 0.25rem;
}
.panel {
  position: relative;
  height: 3.875rem;
  border: 1px solid rgba(25, 186, 139, 0.17);
  background: url('../images/line\(1\).png') no-repeat;
  padding: 0 0.1875rem 0.5rem 0.1875rem;
  margin-bottom: 0.1875rem;
}
.panel::before {
  position: absolute;
  top: 0;
  left: 0;
  width: 0.125rem;
  height: 0.125rem;
  border-top: 2px solid #02a6b5;
  border-left: 2px solid #02a6b5;
  content: '';
}
.panel::after {
  position: absolute;
  top: 0;
  right: 0;
  width: 0.125rem;
  height: 0.125rem;
  border-top: 2px solid #02a6b5;
  border-right: 2px solid #02a6b5;
  content: "";
}
.panel .panel-footer {
  position: absolute;
  left: 0;
  bottom: 0;
  width: 100%;
}
.panel .panel-footer::before {
  position: absolute;
  bottom: 0;
  left: 0;
  width: 0.125rem;
  height: 0.125rem;
  border-bottom: 2px solid #02a6b5;
  border-left: 2px solid #02a6b5;
  content: '';
}
.panel .panel-footer::after {
  position: absolute;
  bottom: 0;
  right: 0;
  width: 0.125rem;
  height: 0.125rem;
  border-bottom: 2px solid #02a6b5;
  border-right: 2px solid #02a6b5;
  content: "";
}
.panel h2 {
  height: 0.6rem;
  line-height: 0.6rem;
  color: white;
  font-size: 0.25rem;
  text-align: center;
  font-weight: 400;
}
.panel .chart {
  height: 3rem;
  width: 100%;
}
.panel a {
  text-decoration: none;
  color: white;
  margin-left: 10px;
}
.minbox {
  display: flex;
  min-width: 1024px;
  max-width: 1920px;
  padding: 0.125rem 0.125rem 0 0.125rem;
}
.minbox .column {
  flex: 3;
}
.minbox .column:nth-child(2) {
  flex: 5;
}
.minbox .column:nth-child(2) .no {
  padding: 0.125rem;
  background-color: rgba(101, 132, 226, 0.1);
  margin: 0 0.125rem 0.1875rem;
}
.minbox .column:nth-child(2) .no .no-hd {
  position: relative;
  width: 100%;
  border: 1px solid rgba(135, 206, 235, 0.3);
  height: 1rem;
  line-height: 1rem;
  color: #ffeb7b;
  font-family: electronicFont;
}
.minbox .column:nth-child(2) .no .no-hd::before {
  position: absolute;
  content: '';
  top: 0;
  left: 0;
  width: 0.3125rem;
  height: 10px;
  border-top: 1px solid skyblue;
  border-left: 1px solid skyblue;
}
.minbox .column:nth-child(2) .no .no-hd::after {
  position: absolute;
  content: '';
  bottom: 0;
  right: 0;
  width: 0.3125rem;
  height: 10px;
  border-bottom: 1px solid skyblue;
  border-right: 1px solid skyblue;
}
.minbox .column:nth-child(2) .no .no-hd li {
  position: relative;
  float: left;
  list-style: none;
  width: 50%;
  text-align: center;
  font-size: 0.875rem;
}
.minbox .column:nth-child(2) .no .no-hd li:nth-child(1)::after {
  content: "";
  position: absolute;
  right: 0;
  top: 50%;
  transform: translateY(-50%);
  height: 0.3125rem;
  border-left: 1px solid rgba(135, 206, 235, 0.3);
}
.minbox .column:nth-child(2) .no .no-bd {
  color: rgba(255, 255, 255, 0.5);
  height: 0.5rem;
  line-height: 0.625rem;
}
.minbox .column:nth-child(2) .no .no-bd li {
  float: left;
  width: 50%;
  text-align: center;
  list-style: none;
}
.map {
  position: relative;
  height: 10.125rem;
  z-index: 0;
}
.map .map-img,
.map .mapbg1,
.map .mapbg2 {
  position: absolute;
  left: 50%;
  top: 50%;
  transform: translateX(-50%) translateY(-50%);
  opacity: 0.6;
}
.map .map-img {
  width: 6.475rem;
  height: 6.475rem;
  background: url(../images/map.png);
  background-size: contain;
  opacity: 0.3;
}
.map .mapbg1 {
  width: 8.0375rem;
  height: 8.0375rem;
  background: url('../images/lbx.png');
  background-size: contain;
  z-index: 10;
  animation: mbg1 15s linear infinite;
}
@keyframes mbg1 {
  from {
    transform: translate(-50%, -50%) rotate(0deg);
  }
  to {
    transform: translate(-50%, -50%) rotate(360deg);
  }
}
.map .mapbg2 {
  width: 7.075rem;
  height: 7.075rem;
  background: url('../images/jt.png');
  background-size: contain;
  animation: mbg2 15s linear infinite;
}
@keyframes mbg2 {
  from {
    transform: translate(-50%, -50%) rotate(0deg);
  }
  to {
    transform: translate(-50%, -50%) rotate(-360deg);
  }
}