目录
强大的绘图功能是Matlab的特点之一,Matlab提供了一系列的绘图函数,用户不需要过多的考虑绘图的细节,只需要给出一些基本参数就能得到所需图形,这类函数称为高层绘图函数。
下面介绍一些Matlab绘图案例,可以帮助用户更加高效地进行数据可视化。
1. 使用subplot创建多个子图
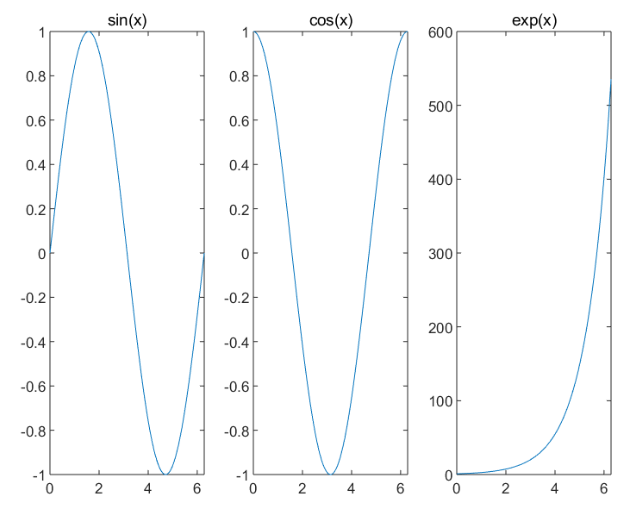
% 创建3个子图,分别画y = sin(x), y = cos(x), y = exp(x)
x = 0:pi/100:2*pi;
subplot(1,3,1);
plot(x, sin(x));
title('sin(x)');
subplot(1,3,2);
plot(x, cos(x));
title('cos(x)');
subplot(1,3,3);
plot(x, exp(x));
title('exp(x)');
2. 绘制误差棒图
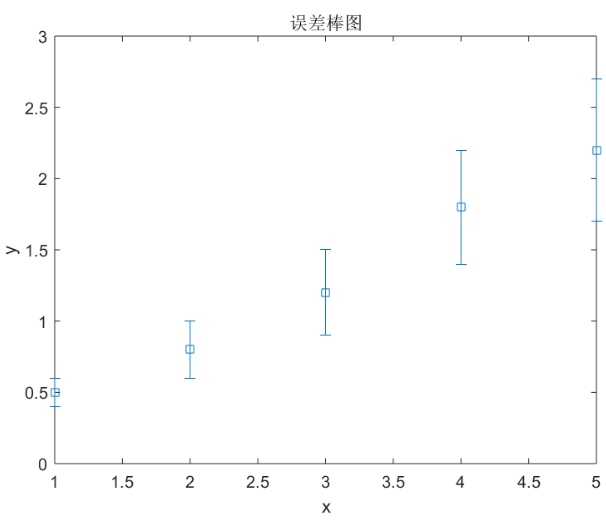
% 绘制误差棒图
x = 1:5;
y = [0.5 0.8 1.2 1.8 2.2];
err = [0.1 0.2 0.3 0.4 0.5];
errorbar(x,y,err,'s');
title('误差棒图');
xlabel('x');
ylabel('y');
3. 绘制条形堆积图
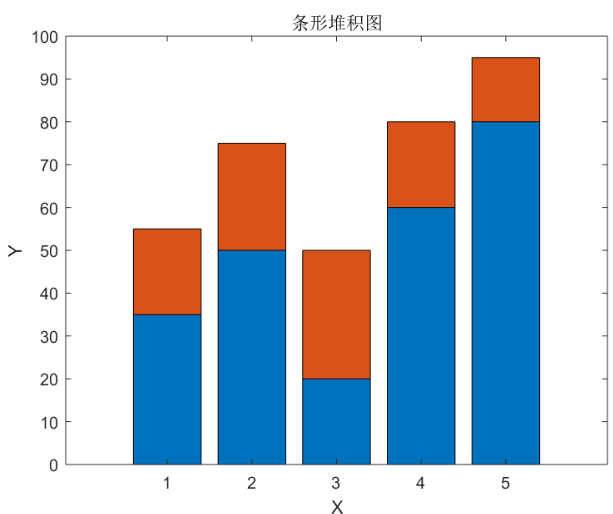
% 绘制条形堆积图
X = [1 2 3 4 5];
Y = [35 50 20 60 80];
Z = [20 25 30 20 15];
bar(X, [Y', Z'], 'stacked');
title('条形堆积图');
xlabel('X');
ylabel('Y');
4. 绘制堆积面积图
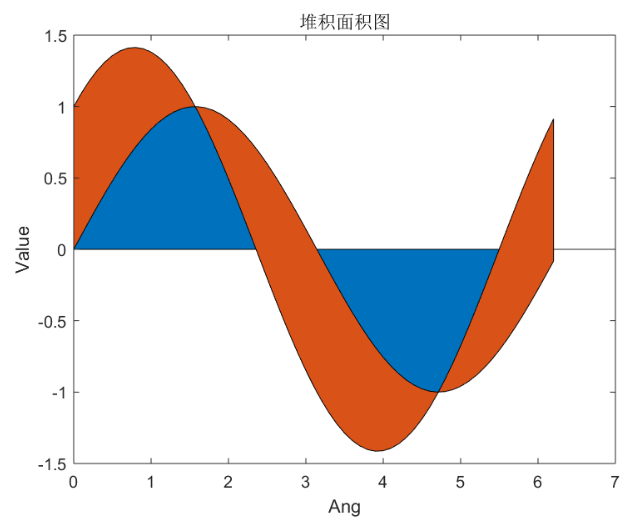
% 绘制堆积面积图
x = 0:0.1:2*pi;
y = [sin(x); cos(x)];
area(x, y');
title('堆积面积图');
xlabel('Ang');
ylabel('Value');
5. 绘制直方图并拟合曲线
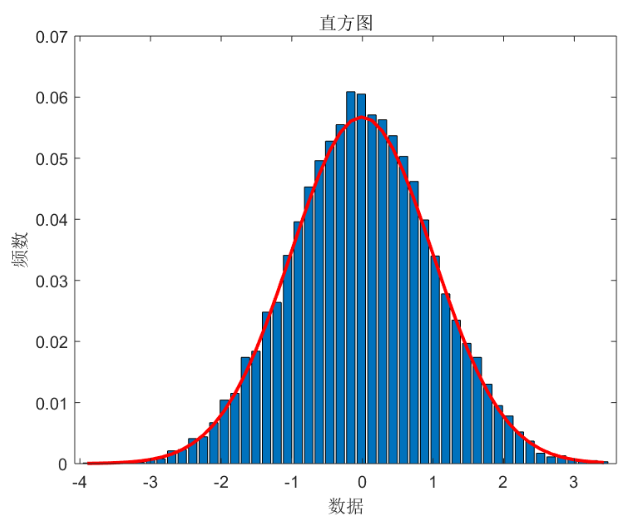
% 绘制直方图并拟合曲线
y = randn(10000, 1);
[n, x] = hist(y, 50);
bar(x, n/sum(n));
hold on
y_fit = normpdf(x, mean(y), std(y));
plot(x, y_fit, 'r', 'LineWidth', 2);
title('直方图');
xlabel('数据');
ylabel('频数');
6. 绘制等高线图
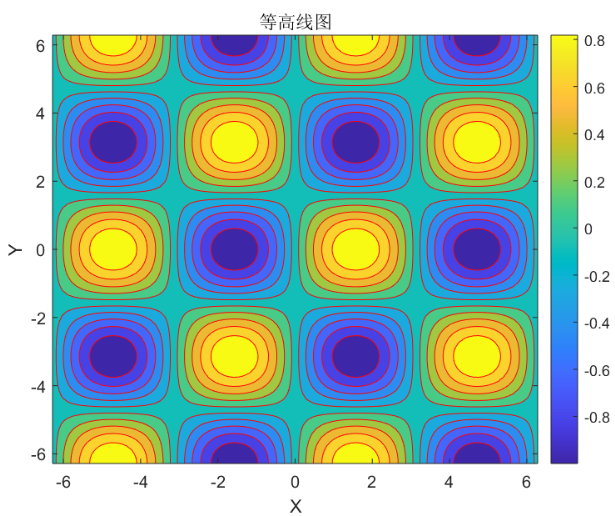
% 绘制等高线图
x = linspace(-2*pi, 2*pi, 100);
[X,Y] = meshgrid(x, x);
Z = sin(X).*cos(Y);
contourf(X, Y, Z, 20, 'LineColor', 'r');
colorbar;
title('等高线图');
xlabel('X');
ylabel('Y');
7. 绘制光滑的曲线
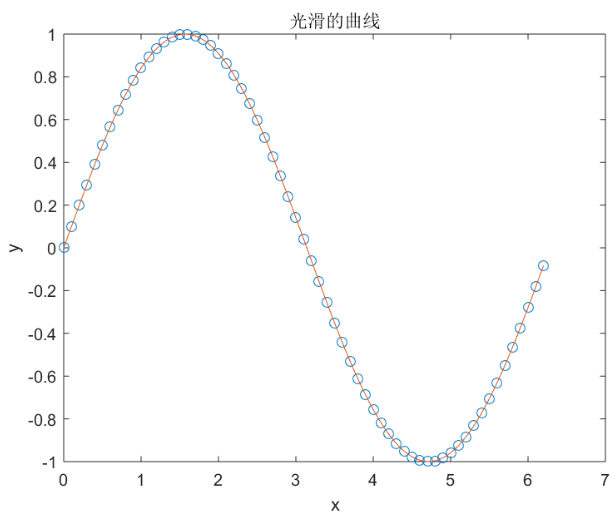
% 绘制光滑的曲线
x = 0:0.1:2*pi;
y = sin(x);
xx = linspace(x(1), x(end), 100);
yy = spline(x,y,xx);
plot(x,y,'o',xx,yy);
title('光滑的曲线');
xlabel('x');
ylabel('y');
8. 绘制彩虹图
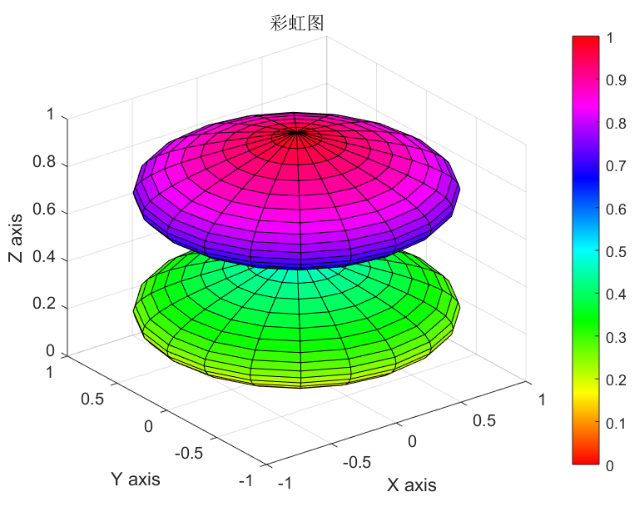
% 绘制彩虹图
t = 0:pi/20:2*pi;
[X,Y,Z] = cylinder(sin(t));
surf(X,Y,Z);
colormap(hsv);
title('彩虹图');
xlabel('X axis');
ylabel('Y axis');
zlabel('Z axis');
9. 绘制带有错误标记的散点图
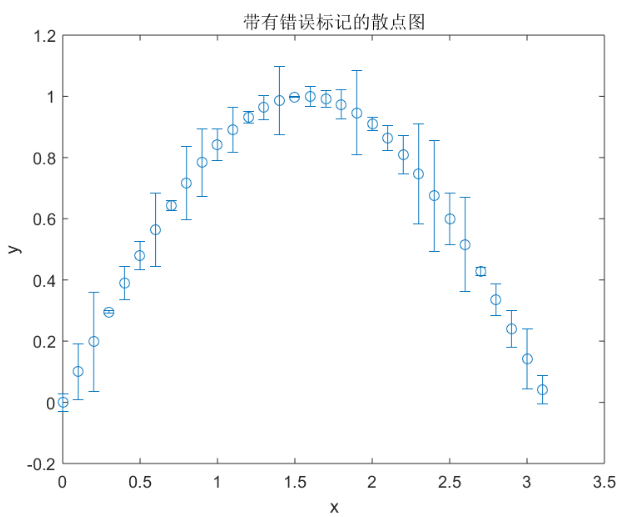
% 绘制带有错误标记的散点图
x1 = 0:0.1:pi;
y1 = sin(x1);
error1 = randn(size(x1))*0.1;
errorbar(x1,y1,error1,'o');
title('带有错误标记的散点图');
xlabel('x');
ylabel('y');
10. 绘制水平堆积条形
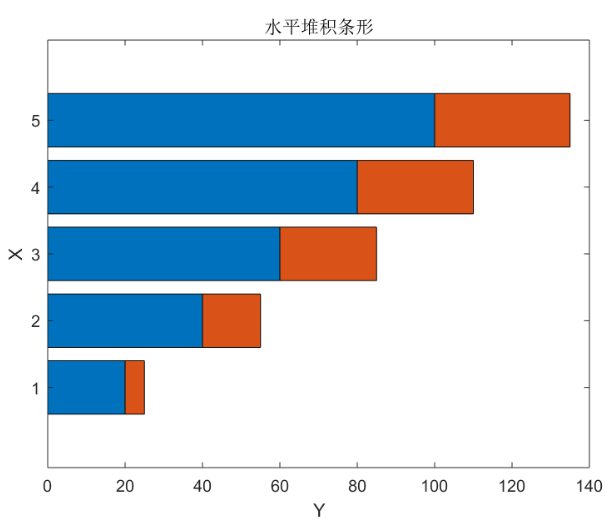
% 绘制水平堆积条形
x = [1 2 3 4 5];
y = [20 40 60 80 100];
z = [5 15 25 30 35];
barh(x, [y' z'], 'stacked');
title('水平堆积条形');
xlabel('Y');
ylabel('X');
11. 绘制饼图
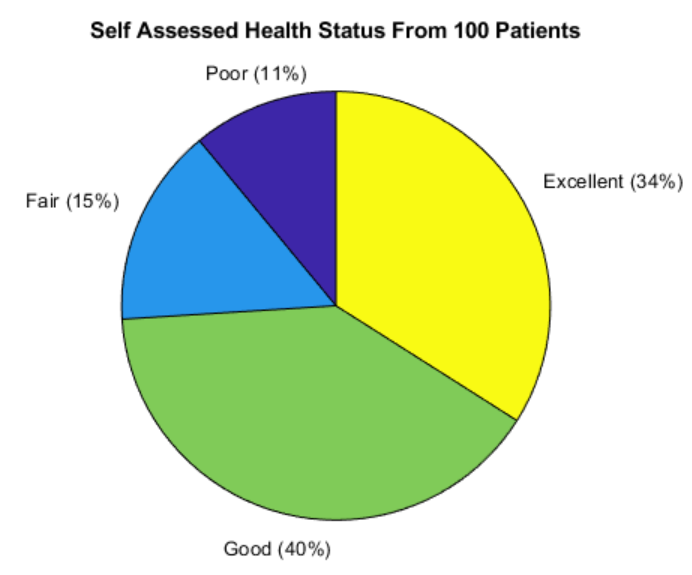
% 绘制饼图
load patients;
pie(SelfAssessedHealthStatus);
title('Self Assessed Health Status From 100 Patients')
12. 绘制极坐标图
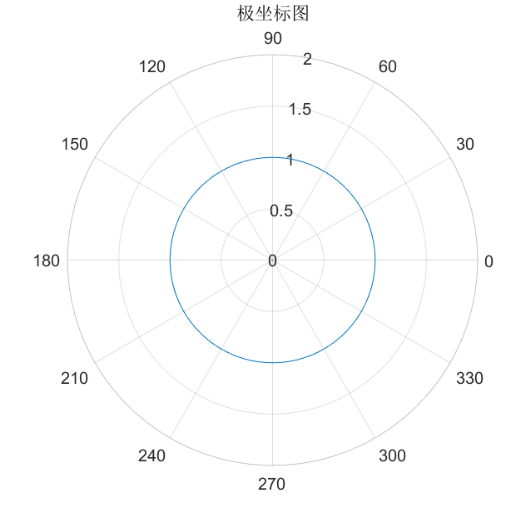
% 绘制极坐标图
theta = linspace(0,2*pi,100);
rho = ones(1,100);
polarplot(theta, rho);
title('极坐标图');
13. 绘制二维直方图
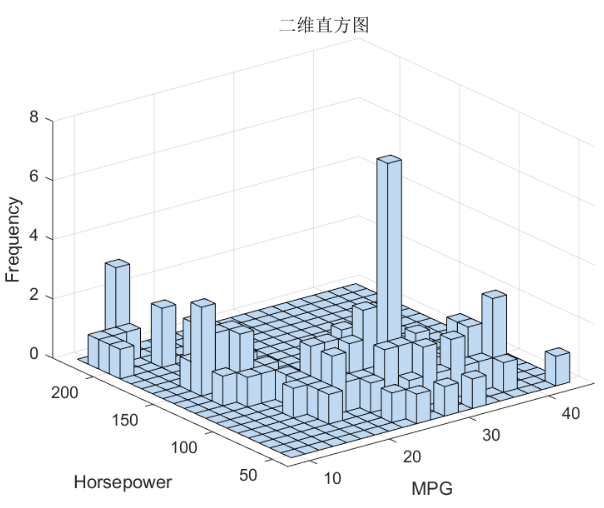
% 绘制二维直方图
load carsmall;
x = [MPG,Horsepower];
hist3(x, [20 20]);
xlabel('MPG');
ylabel('Horsepower');
zlabel('Frequency');
title('二维直方图');
14. 绘制气泡图
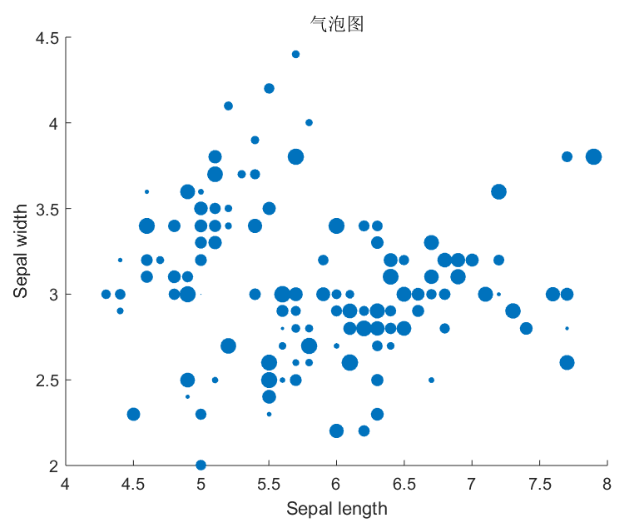
% 绘制气泡图
load fisheriris;
x = meas(:,1);
y = meas(:,2);
sz = 10*rand(size(x));
scatter(x,y,sz,'filled');
xlabel('Sepal length');
ylabel('Sepal width');
title('气泡图');
15. 绘制极坐标气泡图
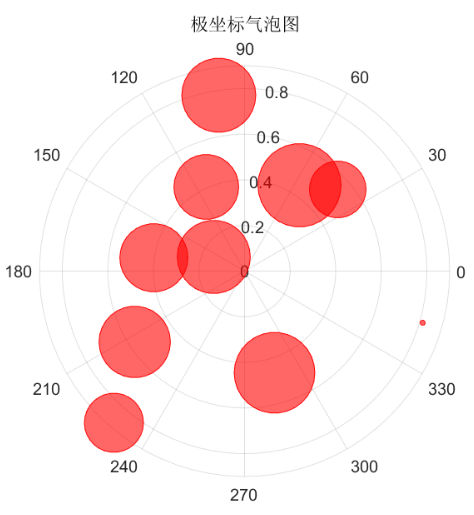
% 极坐标气泡图
th = 1:10;
r = rand(1,10);
sz = rand(1,10);
polarbubblechart(th,r,sz,'red');
title('极坐标气泡图');
这些技巧和例子只是Matlab绘图中的冰山一角。只要用户探索绘图工具箱中不同功能的组合使用方式,就可以使自己的绘图能力水平更上一层楼。