1、性能测试
对于 COCO 数据集,可选 bbox 、segm、proposal ;对于 VOC 数据集,可选 map、recall
python tools/test.py configs/test/faster_rcnn_r50_fpn_1x_coco.py checkpoints/faster_rcnn_r50_fpn_1x_coco_20200130-047c8118.pth --eval bbox
也可以保存输出到pkl文件:
python tools/test.py configs/my_coco_config/my_coco_config.py checkpoints/faster_rcnn_r50_fpn_1x_coco_20200130-047c8118.pth --out faster_rcnn_fpn_coco.pkl
2、计算指标
可以根据上面 --out 保存的结果 pkl 文件计算指标,而无需重新跑
python ./tools/analysis_tools/eval_metric.py configs/my_coco_config/my_coco_config.py faster_rcnn_fpn_coco.pkl --eval bbox
3、计算推了速度
python -m torch.distributed.launch --nproc_per_node=1 --master_port=29500 tools/analysis_tools/benchmark.py configs/test/faster_rcnn_r50_fpn_1x_coco.py checkpoints/faster_rcnn_r50_fpn_1x_coco_20200130-047c8118.pth --launcher pytorch
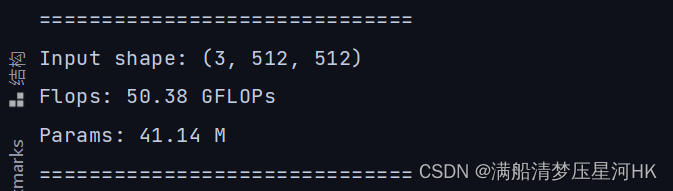
4、计算flops
python tools/analysis_tools/get_flops.py configs/test/faster_rcnn_r50_fpn_1x_coco.py --shape 512 512
5、绘制PR曲线
运行:
python plot_pr_curve.py configs/my_coco_config/my_coco_config.py faster_rcnn_fpn_coco.pkl
这里用到的 pkl 结果文件,即是上面运行 tools/test.py 指定 --out 的输出文件。
代码(非官方):
import os
import sys
import mmcv
import numpy as np
import argparse
import matplotlib.pyplot as plt

from pycocotools.coco import COCO
from pycocotools.cocoeval import COCOeval

from mmcv import Config
from mmdet.datasets import build_dataset


def plot_pr_curve(config_file, result_file, out_pic, metric="bbox"):
    """plot precison-recall curve based on testing results of pkl file.

        Args:
            config_file (list[list | tuple]): config file path.
            result_file (str): pkl file of testing results path.
            metric (str): Metrics to be evaluated. Options are
                'bbox', 'segm'.
    """

    cfg = Config.fromfile(config_file)
    # turn on test mode of dataset
    if isinstance(cfg.data.test, dict):
        cfg.data.test.test_mode = True
    elif isinstance(cfg.data.test, list):
        for ds_cfg in cfg.data.test:
            ds_cfg.test_mode = True

    # build dataset
    dataset = build_dataset(cfg.data.test)
    # load result file in pkl format
    pkl_results = mmcv.load(result_file)
    # convert pkl file (list[list | tuple | ndarray]) to json
    json_results, _ = dataset.format_results(pkl_results)
    # initialize COCO instance
    coco = COCO(annotation_file=cfg.data.test.ann_file)
    coco_gt = coco
    coco_dt = coco_gt.loadRes(json_results[metric])
    # initialize COCOeval instance
    coco_eval = COCOeval(coco_gt, coco_dt, metric)
    coco_eval.evaluate()
    coco_eval.accumulate()
    coco_eval.summarize()
    # extract eval data
    precisions = coco_eval.eval["precision"]
    '''
    precisions[T, R, K, A, M]
    T: iou thresholds [0.5 : 0.05 : 0.95], idx from 0 to 9
    R: recall thresholds [0 : 0.01 : 1], idx from 0 to 100
    K: category, idx from 0 to ...
    A: area range, (all, small, medium, large), idx from 0 to 3
    M: max dets, (1, 10, 100), idx from 0 to 2
    '''
    pr_array1 = precisions[0, :, 0, 0, 2]
    pr_array2 = precisions[1, :, 0, 0, 2]
    pr_array3 = precisions[2, :, 0, 0, 2]
    pr_array4 = precisions[3, :, 0, 0, 2]
    pr_array5 = precisions[4, :, 0, 0, 2]
    pr_array6 = precisions[5, :, 0, 0, 2]
    pr_array7 = precisions[6, :, 0, 0, 2]
    pr_array8 = precisions[7, :, 0, 0, 2]
    pr_array9 = precisions[8, :, 0, 0, 2]
    pr_array10 = precisions[9, :, 0, 0, 2]

    x = np.arange(0.0, 1.01, 0.01)
    # plot PR curve
    plt.plot(x, pr_array1, label="iou=0.5")
    plt.plot(x, pr_array2, label="iou=0.55")
    plt.plot(x, pr_array3, label="iou=0.6")
    plt.plot(x, pr_array4, label="iou=0.65")
    plt.plot(x, pr_array5, label="iou=0.7")
    plt.plot(x, pr_array6, label="iou=0.75")
    plt.plot(x, pr_array7, label="iou=0.8")
    plt.plot(x, pr_array8, label="iou=0.85")
    plt.plot(x, pr_array9, label="iou=0.9")
    plt.plot(x, pr_array10, label="iou=0.95")

    plt.xlabel("recall")
    plt.ylabel("precison")
    plt.xlim(0, 1.0)
    plt.ylim(0, 1.01)
    plt.grid(True)
    plt.legend(loc="lower left")
    plt.savefig(out_pic)

if __name__ == "__main__":
    parser = argparse.ArgumentParser()
    parser.add_argument('config', help='config file path')
    parser.add_argument('pkl_result_file', help='pkl result file path')
    parser.add_argument('--out', default='pr_curve.png')
    parser.add_argument('--eval', default='bbox')
    cfg = parser.parse_args()

    plot_pr_curve(config_file=cfg.config, result_file=cfg.pkl_result_file, out_pic=cfg.out, metric=cfg.eval)