01 背景
在数据可视化项目里面经常会用到地图随机选中或地图定时选中的效果,结合各个地图api 和可视化库对比发现:用ECharts的地图组件实现较为简单。
地图组件一直是 ECharts 中使用非常广泛的组件。一般地图组件会使用存储了经纬度的 GeoJSON 格式的数据,而 ECharts 则计算出合适的显示区域然后把经纬度线性映射到这个区域,这是一种最简单的地图投影方式。
02 最终效果

看着这种效果,是不是觉得很酷!话不多说,马上开始!
03 准备工作
安装ECharts
下载最新版本的ECharts(官网)
https://echarts.apache.org/zh/download.html
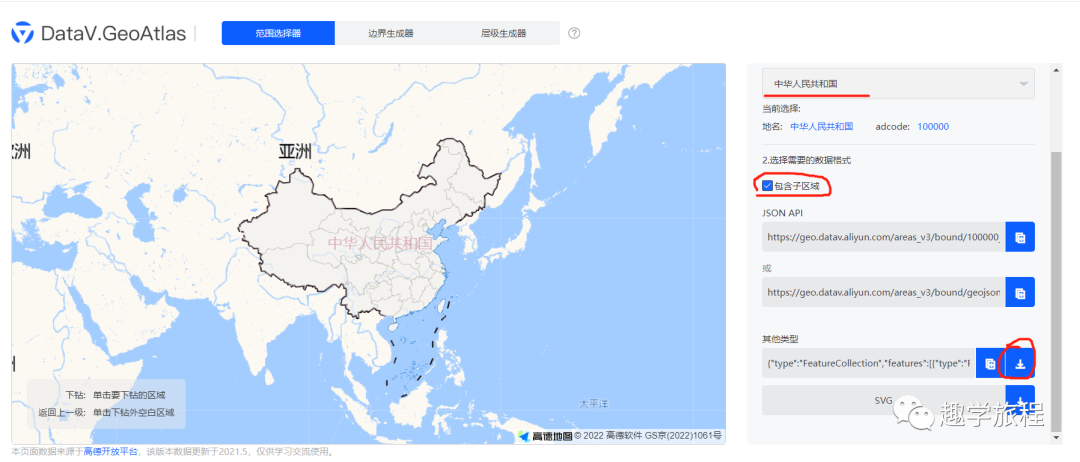
下载经纬度数据
下载中国经纬度的 GeoJSON json数据(国内在高德地图下载)
http://datav.aliyun.com/portal/school/atlas/area_selector
重命名文件
把下载的json文件保存到项目目录并命名为geojson.json,数据里面存储了国内34个省级行政区域的地理经纬度坐标信息。
代码
如果实在不知道代码怎么写?没关系,小趣已经帮大家准备好了,可以参考着来哦~
04 代码
index.html
<!DOCTYPE html>
<html lang="en">
<head>
<meta charset="UTF-8">
<meta http-equiv="X-UA-Compatible" content="IE=edge">
<meta name="viewport" content="width=device-width, initial-scale=1.0">
<title>Document</title>
<!-- 引入echarts文件 -->
<script src="./echarts.js"></script>
<style>
#map {
width: 800px;
height: 800px;
margin: 0 auto;
background-color: #000;
}
</style>
</head>
<body>
<!-- 地图挂载入口 -->
<div id="map"></div>
<script src="./mapdemo.js"></script>
</body>
</html>mapdemo.js
let myEchart = echarts.init(document.querySelector("#map"), null, {
renderer: 'canvas',
useDirtyRect: false
});
let index = 0;
let timmerID = 0;
//加载地图数据
fetch("./geojson.json").then(response => response.json())
.then(chinaJson => {
echarts.registerMap("chinaMap", chinaJson);
let option = {
tooltip: { //提示框
backgroundColor: 'rgba(0,0,0,0)',
trigger: 'item',
},
geo: [
{
map: 'chinaMap',
roam: true,
zoom:1.2,
show:false,//
emphasis: {
itemStyle: {
color: undefined
},
label: {
show: false
}
}
}
],
series: [
{
name: 'chinaMapPopEstimates',
type: 'map',
roam: false,
map: 'chinaMap',
emphasis: {//高亮状态下
label: {
show: false
},
itemStyle:{
show:false,
disabled:true
},
},
label: {
show: true,
color: '#fff',
fontSize: 10,
// formatter(e){
// console.log(e)
// }
},
select: {//禁用点击选中效果。
disabled: true
},
zoom: 1.2,//放大倍数
itemStyle: {//地图区域的多边形 图形样式。
borderColor: 'rgba(147, 235, 248, 1)',
color: "#fff",
borderWidth: 1,
areaColor: {//地图区域的颜色。
type: 'radial',//径向渐变.
x: 0.5,
y: 0.5,
r: 0.8,
colorStops: [{
offset: 0,
color: 'rgba(255, 235, 248, 0)' // 0% 处的颜色
}, {
offset: 1,
color: 'rgba(255, 235, 248, .2)' // 100% 处的颜色
}],
globalCoord: false // 缺省为 false
},
shadowColor: 'rgba(128, 217, 248, 1)',
},
emphasis: { // 高亮状态下的多边形和标签样式。鼠标移入动态的时候显示的默认样式
itemStyle: {//地图区域的颜色。
areaColor: '#4adcf0',
borderColor: '#404a59',
borderWidth: 1
},
label: { // 文字
show: true,
color: '#fff',
fontSize: 10
},
},
tooltip: { // 鼠标移动上去的时候的提示窗口
trigger: 'item',
formatter: function (item) {
// console.log("item===>",item);
var tipHtml = '';
tipHtml = `<div style="padding: .6rem .8rem;font-size: .325rem;color:#fff;border-radius:10%;background: linear-gradient(#cccecf, #cccecf) left top,
linear-gradient(#cccecf, #cccecf) left top,
linear-gradient(#cccecf, #cccecf) right top,
linear-gradient(#cccecf, #cccecf) right top,
linear-gradient(#cccecf, #cccecf) left bottom,
linear-gradient(#cccecf, #cccecf) left bottom,
linear-gradient(#cccecf, #cccecf) right bottom,
linear-gradient(#cccecf, #cccecf) right bottom;
background-repeat: no-repeat;
background-size: .08rem .3rem, .3rem .08rem;background-color:rgba(6, 79, 111,.6);">${item.name}<span style="color:#f9eb59;font-size:.4rem">5家</span> </div>`;
return tipHtml;
},
borderWidth: 0
},
data: [
{ name: '广东省', value: 4822023 },
{ name: '北京市', value: 731449 },
{ name: '新疆维吾尔自治区', value: 6553255 },
{ name: '海南省', value: 6553255 }
]
},
{
name: 'Route',
type: 'lines',
coordinateSystem: 'geo',
geoIndex: 0,
emphasis: {
label: {
show: false
}
},
polyline: true,
itemStyle:{
show:false
},
lineStyle: {
color: 'rgba(255, 0, 0, 1)',
width: 2,
opacity: 0.1,
type: 'solid'
},
effect: {//动效配置
show: true,
period: 8,
color: '#ff0000',
constantSpeed: 80,
trailLength: 0.2,
symbolSize: [20, 12],
symbol:
'path://M35.5 40.5c0-22.16 17.84-40 40-40s40 17.84 40 40c0 1.6939-.1042 3.3626-.3067 5H35.8067c-.2025-1.6374-.3067-3.3061-.3067-5zm90.9621-2.6663c-.62-1.4856-.9621-3.1182-.9621-4.8337 0-6.925 5.575-12.5 12.5-12.5s12.5 5.575 12.5 12.5a12.685 12.685 0 0 1-.1529 1.9691l.9537.5506-15.6454 27.0986-.1554-.0897V65.5h-28.7285c-7.318 9.1548-18.587 15-31.2715 15s-23.9535-5.8452-31.2715-15H15.5v-2.8059l-.0937.0437-8.8727-19.0274C2.912 41.5258.5 37.5549.5 33c0-6.925 5.575-12.5 12.5-12.5S25.5 26.075 25.5 33c0 .9035-.0949 1.784-.2753 2.6321L29.8262 45.5h92.2098z'
},
data: [
{
coords: [
[ 116.405285, 39.904989 ],
[ 106.504962, 29.533155 ],
[ 113.429915, 22.334652 ],
[ 116.629915, 23.334652 ],
[ 116.405285, 39.904989 ]
]
}
]
}
],
// visualMap: [ //数据映射高亮样式 结合data使用.
// {
// type: "piecewise",
// left: 'right',
// min: 500000,
// max: 38000000,
// inRange: {
// color: [
// '#fdae61',
// '#f46d43',
// '#d73027',
// '#a50026'
// ]
// },
// }
// ]
}
myEchart.setOption(option);
});
myEchart.on("mouseover", (e) => {
});
document.querySelector("#map").addEventListener("mouseover", () => {
clearInterval(timmerID);
});
let dataIndex = 0;
timmerID = setInterval(() => {
myEchart.dispatchAction({//取消高亮样式
type: "downplay",
seriesIndex: 0,
dataIndex,
})
dataIndex = Math.floor(Math.random() * 34);
// dataIndex+=1;
if (dataIndex > 34) {
dataIndex = 0;
}
myEchart.dispatchAction({//触发高亮样式
type: "highlight",
seriesIndex: 0,
dataIndex
});
myEchart.dispatchAction({//触发弹出框提示.
type: "showTip",
seriesIndex: 0,
dataIndex
});
}, 200);05 写在最后
ECharts不仅能做出地图随机选择和高亮的效果,在其他数据可视化场景下的表现也是很棒的!有兴趣的小伙伴可以自行研究一下~