前言
案例来源于GitHub项目《各种各样的PyQt测试和例子》一、图表主题动画
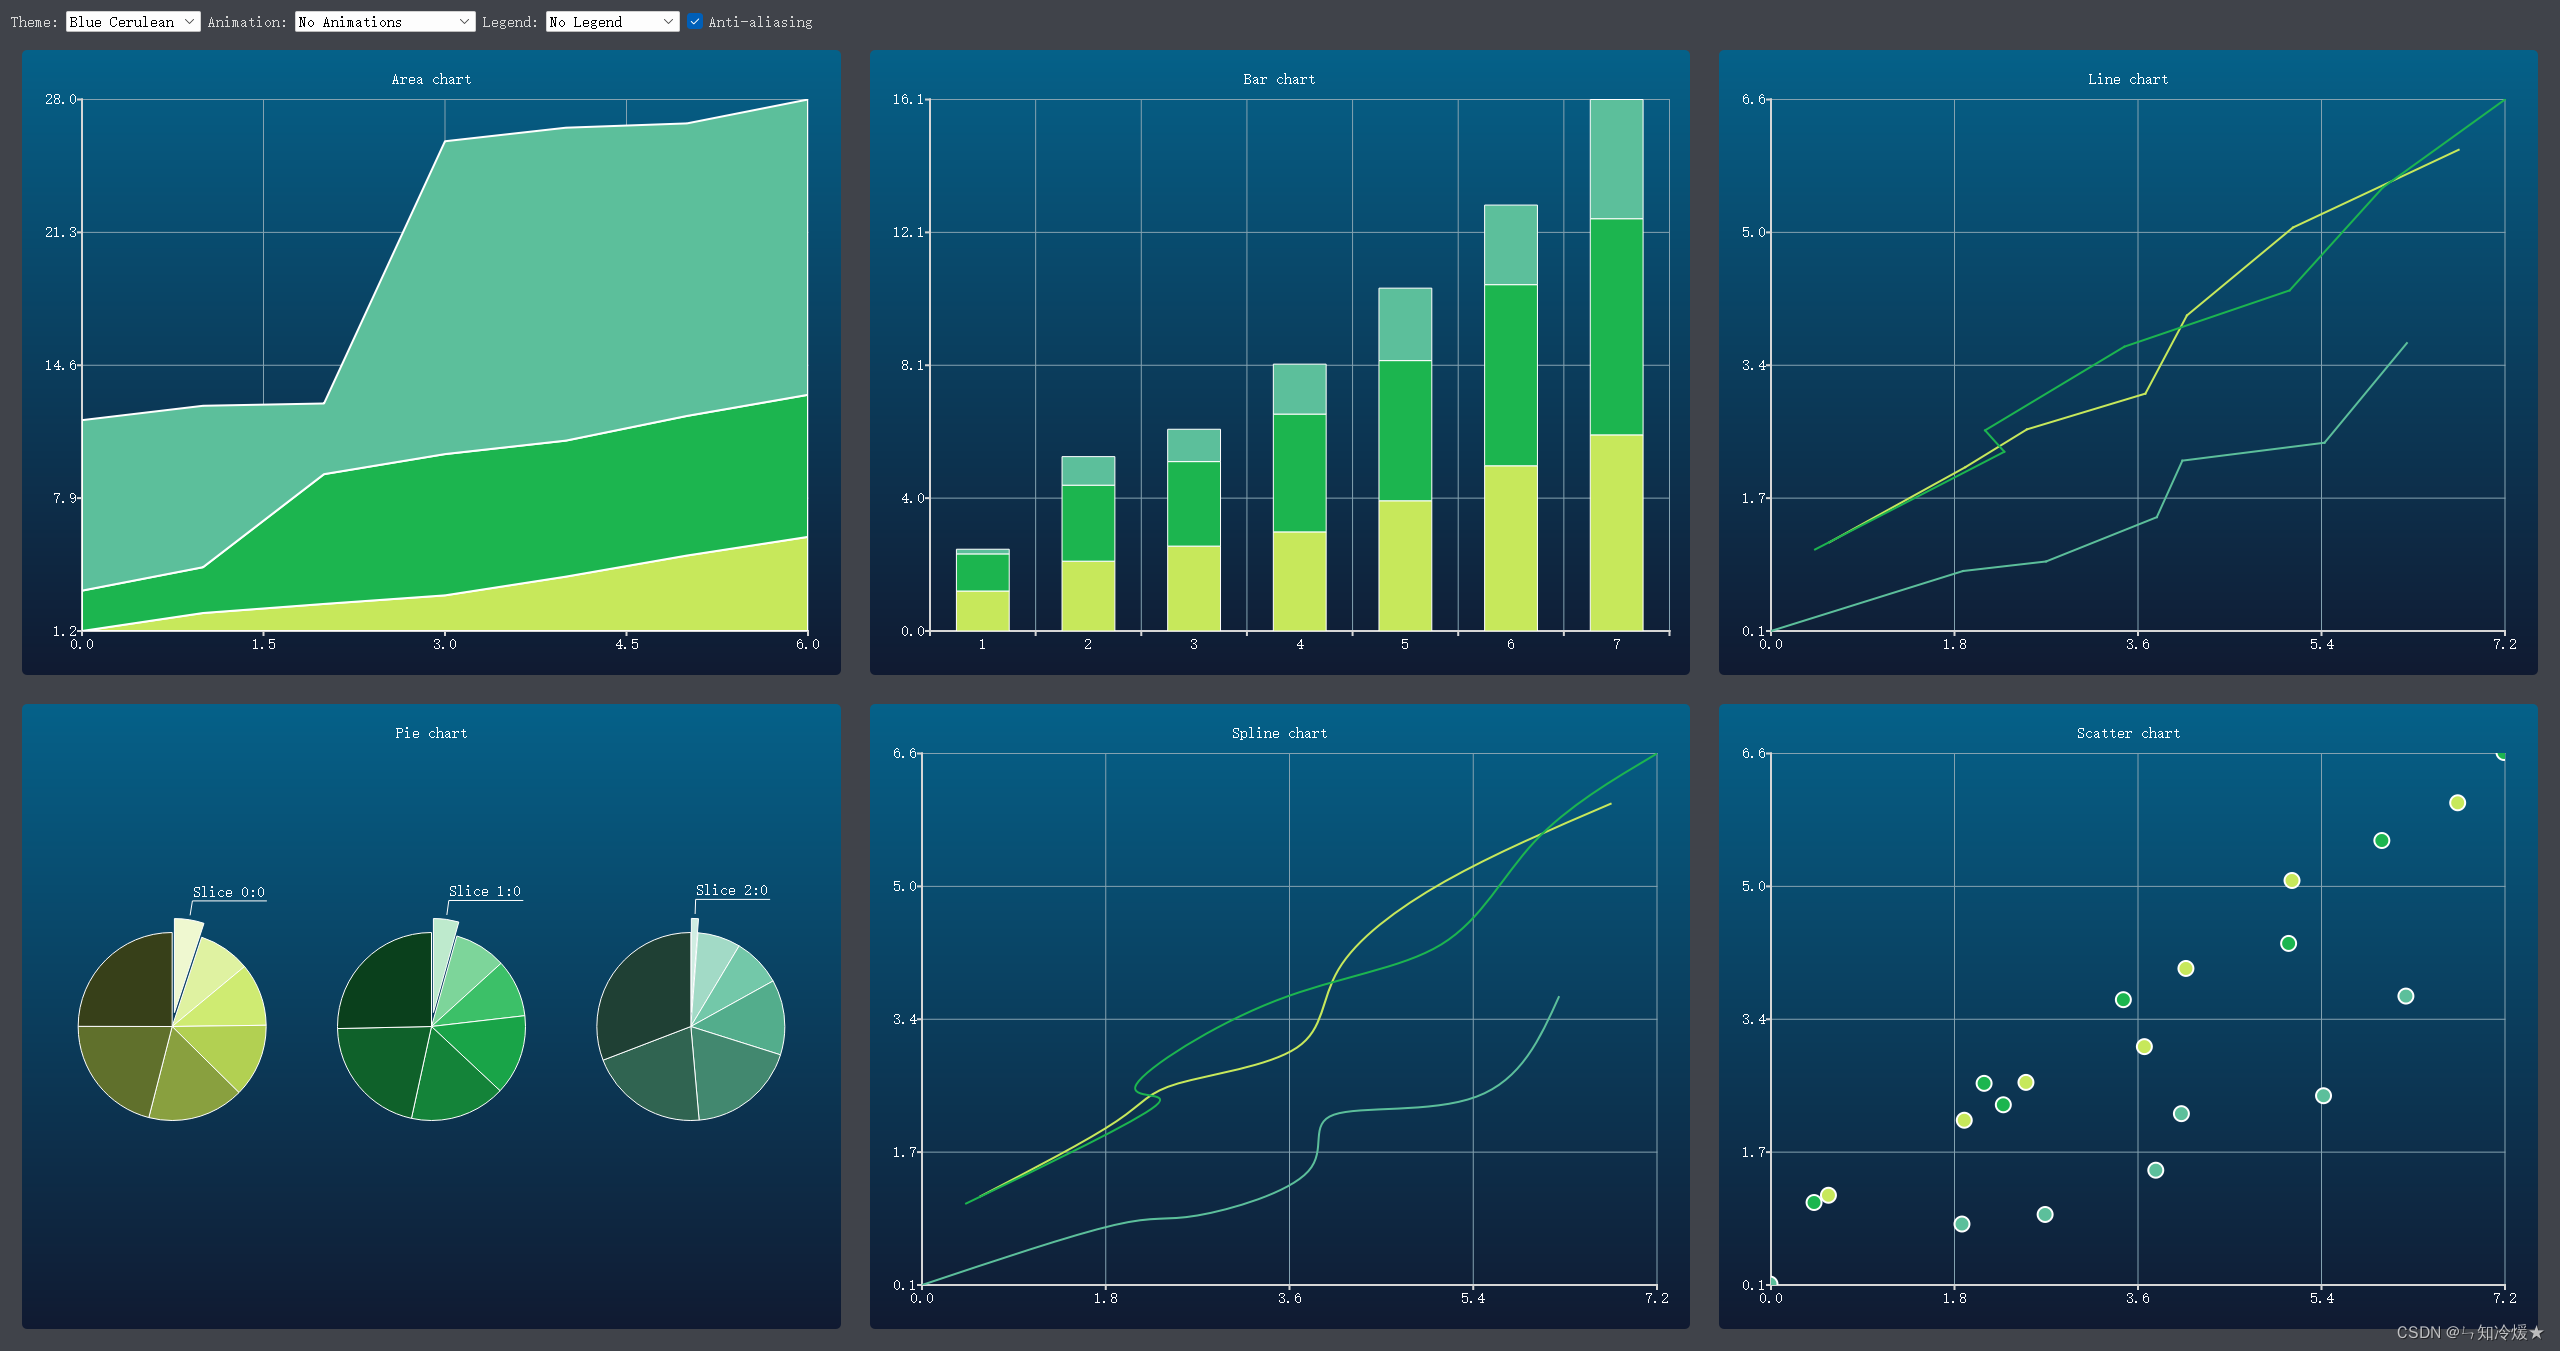
1-1、效果展示
功能:
- 支持不同的主题和动画效果。
- 用户可以通过下拉框选择主题和动画效果,也可以勾选复选框来打开或关闭抗锯齿效果。
- 创建了多个图表,包括区域图、柱状图、折线图、饼图、散点图和样条图。
完整代码如下:
#!/usr/bin/env python
# -*- coding: utf-8 -*-

"""
Created on 2019/10/2
@author: Irony
@site: https://pyqt.site , https://github.com/PyQt5
@email: 892768447@qq.com
@file: ChartThemes
@description: 图表主题动画等
"""
#############################################################################
##
## Copyright (C) 2013 Riverbank Computing Limited
## Copyright (C) 2012 Digia Plc
## All rights reserved.
##
## This file is part of the PyQtChart examples.
##
## $QT_BEGIN_LICENSE$
## Licensees holding valid Qt Commercial licenses may use this file in
## accordance with the Qt Commercial License Agreement provided with the
## Software or, alternatively, in accordance with the terms contained in
## a written agreement between you and Digia.
## $QT_END_LICENSE$
##
#############################################################################


import random

try:
    from PyQt5.QtChart import (QAreaSeries, QBarSet, QChart, QChartView,
                               QLineSeries, QPieSeries, QScatterSeries, QSplineSeries,
                               QStackedBarSeries)
    from PyQt5.QtCore import pyqtSlot, QPointF, Qt
    from PyQt5.QtGui import QColor, QPainter, QPalette
    from PyQt5.QtWidgets import QApplication, QMainWindow, QCheckBox, QComboBox, QGridLayout, QHBoxLayout, \
        QLabel, QSizePolicy, QWidget
except ImportError:
    from PySide2.QtCore import Slot as pyqtSlot, QPointF, Qt
    from PySide2.QtGui import QColor, QPainter, QPalette
    from PySide2.QtWidgets import QApplication, QMainWindow, QCheckBox, QComboBox, QGridLayout, QHBoxLayout, \
        QLabel, QSizePolicy, QWidget
    from PySide2.QtCharts import QtCharts

    QChartView = QtCharts.QChartView
    QChart = QtCharts.QChart
    QAreaSeries = QtCharts.QAreaSeries
    QBarSet = QtCharts.QBarSet
    QLineSeries = QtCharts.QLineSeries
    QPieSeries = QtCharts.QPieSeries
    QScatterSeries = QtCharts.QScatterSeries
    QSplineSeries = QtCharts.QSplineSeries
    QStackedBarSeries = QtCharts.QStackedBarSeries


class ThemeWidget(QWidget):

    def __init__(self, parent=None):
        super(ThemeWidget, self).__init__(parent)

        self.m_charts = []
        self.m_listCount = 3
        self.m_valueMax = 10
        self.m_valueCount = 7
        self.m_dataTable = self.generateRandomData(self.m_listCount,
                                                   self.m_valueMax, self.m_valueCount)
        self.m_themeComboBox = self.createThemeBox()
        self.m_antialiasCheckBox = QCheckBox("Anti-aliasing")
        self.m_animatedComboBox = self.createAnimationBox()
        self.m_legendComboBox = self.createLegendBox()

        self.connectSignals()

        # Create the layout.
        baseLayout = QGridLayout()
        settingsLayout = QHBoxLayout()
        settingsLayout.addWidget(QLabel("Theme:"))
        settingsLayout.addWidget(self.m_themeComboBox)
        settingsLayout.addWidget(QLabel("Animation:"))
        settingsLayout.addWidget(self.m_animatedComboBox)
        settingsLayout.addWidget(QLabel("Legend:"))
        settingsLayout.addWidget(self.m_legendComboBox)
        settingsLayout.addWidget(self.m_antialiasCheckBox)
        settingsLayout.addStretch()
        baseLayout.addLayout(settingsLayout, 0, 0, 1, 3)

        # Create the charts.
        chartView = QChartView(self.createAreaChart())
        baseLayout.addWidget(chartView, 1, 0)
        self.m_charts.append(chartView)

        chartView = QChartView(self.createBarChart(self.m_valueCount))
        baseLayout.addWidget(chartView, 1, 1)
        self.m_charts.append(chartView)

        chartView = QChartView(self.createLineChart())
        baseLayout.addWidget(chartView, 1, 2)
        self.m_charts.append(chartView)

        chartView = QChartView(self.createPieChart())
        # Funny things happen if the pie slice labels no not fit the screen...
        chartView.setSizePolicy(QSizePolicy.Ignored, QSizePolicy.Ignored)
        baseLayout.addWidget(chartView, 2, 0)
        self.m_charts.append(chartView)

        chartView = QChartView(self.createSplineChart())
        baseLayout.addWidget(chartView, 2, 1)
        self.m_charts.append(chartView)

        chartView = QChartView(self.createScatterChart())
        baseLayout.addWidget(chartView, 2, 2)
        self.m_charts.append(chartView)

        self.setLayout(baseLayout)

        # Set the defaults.
        self.m_antialiasCheckBox.setChecked(True)
        self.updateUI()

    def connectSignals(self):
        self.m_themeComboBox.currentIndexChanged.connect(self.updateUI)
        self.m_antialiasCheckBox.toggled.connect(self.updateUI)
        self.m_animatedComboBox.currentIndexChanged.connect(self.updateUI)
        self.m_legendComboBox.currentIndexChanged.connect(self.updateUI)

    def generateRandomData(self, listCount, valueMax, valueCount):
        random.seed()

        dataTable = []

        for i in range(listCount):
            dataList = []
            yValue = 0.0
            f_valueCount = float(valueCount)

            for j in range(valueCount):
                yValue += random.uniform(0, valueMax) / f_valueCount
                value = QPointF(
                    j + random.random() * self.m_valueMax / f_valueCount,
                    yValue)
                label = "Slice " + str(i) + ":" + str(j)
                dataList.append((value, label))

            dataTable.append(dataList)

        return dataTable

    def createThemeBox(self):
        themeComboBox = QComboBox()

        themeComboBox.addItem("Light", QChart.ChartThemeLight)
        themeComboBox.addItem("Blue Cerulean", QChart.ChartThemeBlueCerulean)
        themeComboBox.addItem("Dark", QChart.ChartThemeDark)
        themeComboBox.addItem("Brown Sand", QChart.ChartThemeBrownSand)
        themeComboBox.addItem("Blue NCS", QChart.ChartThemeBlueNcs)
        themeComboBox.addItem("High Contrast", QChart.ChartThemeHighContrast)
        themeComboBox.addItem("Blue Icy", QChart.ChartThemeBlueIcy)

        return themeComboBox

    def createAnimationBox(self):
        animationComboBox = QComboBox()

        animationComboBox.addItem("No Animations", QChart.NoAnimation)
        animationComboBox.addItem("GridAxis Animations", QChart.GridAxisAnimations)
        animationComboBox.addItem("Series Animations", QChart.SeriesAnimations)
        animationComboBox.addItem("All Animations", QChart.AllAnimations)

        return animationComboBox

    def createLegendBox(self):
        legendComboBox = QComboBox()

        legendComboBox.addItem("No Legend ", 0)
        legendComboBox.addItem("Legend Top", Qt.AlignTop)
        legendComboBox.addItem("Legend Bottom", Qt.AlignBottom)
        legendComboBox.addItem("Legend Left", Qt.AlignLeft)
        legendComboBox.addItem("Legend Right", Qt.AlignRight)

        return legendComboBox

    def createAreaChart(self):
        chart = QChart()
        chart.setTitle("Area chart")

        # The lower series is initialized to zero values.
        lowerSeries = None
        y_points = []

        for i, data_list in enumerate(self.m_dataTable):
            upperSeries = QLineSeries(chart)
            for j, (value, _) in enumerate(data_list):
                y = value.y()

                if lowerSeries is None:
                    upperSeries.append(QPointF(j, y))
                    y_points.append(y)
                else:
                    new_y = y_points[i] + y
                    upperSeries.append(QPointF(j, new_y))
                    y_points[j] += new_y

            area = QAreaSeries(upperSeries, lowerSeries)
            area.setName("Series " + str(i))
            chart.addSeries(area)
            lowerSeries = upperSeries

        chart.createDefaultAxes()

        return chart

    def createBarChart(self, valueCount):
        chart = QChart()
        chart.setTitle("Bar chart")

        series = QStackedBarSeries(chart)

        for i, data_list in enumerate(self.m_dataTable):
            set = QBarSet("Bar set " + str(i))
            for value, _ in data_list:
                set << value.y()

            series.append(set)

        chart.addSeries(series)
        chart.createDefaultAxes()

        return chart

    def createLineChart(self):
        chart = QChart()
        chart.setTitle("Line chart")

        for i, data_list in enumerate(self.m_dataTable):
            series = QLineSeries(chart)
            for value, _ in data_list:
                series.append(value)

            series.setName("Series " + str(i))
            chart.addSeries(series)

        chart.createDefaultAxes()

        return chart

    def createPieChart(self):
        chart = QChart()
        chart.setTitle("Pie chart")

        pieSize = 1.0 / len(self.m_dataTable)

        for i, data_list in enumerate(self.m_dataTable):
            series = QPieSeries(chart)
            for value, label in data_list:
                slice = series.append(label, value.y())
                if series.count() == 1:
                    slice.setLabelVisible()
                    slice.setExploded()

            hPos = (pieSize / 2) + (i / float(len(self.m_dataTable)))
            series.setPieSize(pieSize)
            series.setHorizontalPosition(hPos)
            series.setVerticalPosition(0.5)

            chart.addSeries(series)

        return chart

    def createSplineChart(self):
        chart = QChart()
        chart.setTitle("Spline chart")

        for i, data_list in enumerate(self.m_dataTable):
            series = QSplineSeries(chart)
            for value, _ in data_list:
                series.append(value)

            series.setName("Series " + str(i))
            chart.addSeries(series)

        chart.createDefaultAxes()

        return chart

    def createScatterChart(self):
        chart = QChart()
        chart.setTitle("Scatter chart")

        for i, data_list in enumerate(self.m_dataTable):
            series = QScatterSeries(chart)
            for value, _ in data_list:
                series.append(value)

            series.setName("Series " + str(i))
            chart.addSeries(series)

        chart.createDefaultAxes()

        return chart

    @pyqtSlot()
    def updateUI(self):
        theme = self.m_themeComboBox.itemData(
            self.m_themeComboBox.currentIndex())

        if self.m_charts[0].chart().theme() != theme:
            for chartView in self.m_charts:
                chartView.chart().setTheme(QChart.ChartTheme(theme))

            pal = self.window().palette()

            if theme == QChart.ChartThemeLight:
                pal.setColor(QPalette.Window, QColor(0xf0f0f0))
                pal.setColor(QPalette.WindowText, QColor(0x404044))
            elif theme == QChart.ChartThemeDark:
                pal.setColor(QPalette.Window, QColor(0x121218))
                pal.setColor(QPalette.WindowText, QColor(0xd6d6d6))
            elif theme == QChart.ChartThemeBlueCerulean:
                pal.setColor(QPalette.Window, QColor(0x40434a))
                pal.setColor(QPalette.WindowText, QColor(0xd6d6d6))
            elif theme == QChart.ChartThemeBrownSand:
                pal.setColor(QPalette.Window, QColor(0x9e8965))
                pal.setColor(QPalette.WindowText, QColor(0x404044))
            elif theme == QChart.ChartThemeBlueNcs:
                pal.setColor(QPalette.Window, QColor(0x018bba))
                pal.setColor(QPalette.WindowText, QColor(0x404044))
            elif theme == QChart.ChartThemeHighContrast:
                pal.setColor(QPalette.Window, QColor(0xffab03))
                pal.setColor(QPalette.WindowText, QColor(0x181818))
            elif theme == QChart.ChartThemeBlueIcy:
                pal.setColor(QPalette.Window, QColor(0xcee7f0))
                pal.setColor(QPalette.WindowText, QColor(0x404044))
            else:
                pal.setColor(QPalette.Window, QColor(0xf0f0f0))
                pal.setColor(QPalette.WindowText, QColor(0x404044))

            self.window().setPalette(pal)

        checked = self.m_antialiasCheckBox.isChecked()
        for chartView in self.m_charts:
            chartView.setRenderHint(QPainter.Antialiasing, checked)

        options = QChart.AnimationOptions(
            self.m_animatedComboBox.itemData(
                self.m_animatedComboBox.currentIndex()))

        if self.m_charts[0].chart().animationOptions() != options:
            for chartView in self.m_charts:
                chartView.chart().setAnimationOptions(options)

        alignment = self.m_legendComboBox.itemData(
            self.m_legendComboBox.currentIndex())

        for chartView in self.m_charts:
            legend = chartView.chart().legend()

            if alignment == 0:
                legend.hide()
            else:
                legend.setAlignment(Qt.Alignment(alignment))
                legend.show()


if __name__ == '__main__':
    import sys

    app = QApplication(sys.argv)

    window = QMainWindow()
    widget = ThemeWidget()
    window.setCentralWidget(widget)
    window.resize(900, 600)
    window.show()

    sys.exit(app.exec_())
1-2、代码分段解析
1-2-1、导库
PyQt5和PySide2都是Python中使用Qt框架的工具包,它们提供了对Qt库的Python绑定。它们的主要区别在于它们的开发和使用许可证不同。PyQt5是由Riverbank Computing有限公司开发的,使用的是GPL和商业许可证,而PySide2是由Qt公司开发的,使用的是LGPL许可证。此外,PyQt5包含了Qt的全部功能,而PySide2只包含了其中的一部分。
在使用上,两者提供了类似的API和功能,但PyQt5相对而言更稳定,文档和教程也更全面,因为它已经存在更长的时间并且有更多的用户和开发者。但是,由于PySide2使用的是LGPL许可证,因此在一些特定的情况下,可能更适合某些项目的使用。
在该代码段中:作者试图导入PyQt5或者是PySide2的任意一种库:
import random

try:
    from PyQt5.QtChart import (QAreaSeries, QBarSet, QChart, QChartView,
                               QLineSeries, QPieSeries, QScatterSeries, QSplineSeries,
                               QStackedBarSeries)
    from PyQt5.QtCore import pyqtSlot, QPointF, Qt
    from PyQt5.QtGui import QColor, QPainter, QPalette
    from PyQt5.QtWidgets import QApplication, QMainWindow, QCheckBox, QComboBox, QGridLayout, QHBoxLayout, \
        QLabel, QSizePolicy, QWidget
except ImportError:
    from PySide2.QtCore import Slot as pyqtSlot, QPointF, Qt
    from PySide2.QtGui import QColor, QPainter, QPalette
    from PySide2.QtWidgets import QApplication, QMainWindow, QCheckBox, QComboBox, QGridLayout, QHBoxLayout, \
        QLabel, QSizePolicy, QWidget
    from PySide2.QtCharts import QtCharts

    QChartView = QtCharts.QChartView
    QChart = QtCharts.QChart
    QAreaSeries = QtCharts.QAreaSeries
    QBarSet = QtCharts.QBarSet
    QLineSeries = QtCharts.QLineSeries
    QPieSeries = QtCharts.QPieSeries
    QScatterSeries = QtCharts.QScatterSeries
    QSplineSeries = QtCharts.QSplineSeries
    QStackedBarSeries = QtCharts.QStackedBarSeries
1-2-2、初始化
这段代码定义了一个名为ThemeWidget的QWidget类,用于展示多种不同主题下的图表,并提供一些设置选项。
- 在初始化函数__init__中,先设置了一些属性,如图表个数、数值最大值、数值数量、数据表,以及一些UI控件,如主题下拉框、抗锯齿复选框、动画效果下拉框、图例下拉框,并连接它们的信号与槽函数。
- 然后,通过QGridLayout布局管理器来创建一个基础布局,并在其中添加一些UI控件和图表视图,分别包括区域图、条形图、折线图、饼图、样条图、散点图。其中,每个图表都被包装在QChartView中。
- 最后,将基础布局设置为ThemeWidget的布局,并设置抗锯齿复选框默认选中,并调用updateUI函数来更新UI。
代码如下:
class ThemeWidget(QWidget):

    def __init__(self, parent=None):
        super(ThemeWidget, self).__init__(parent)

        self.m_charts = []
        self.m_listCount = 3
        self.m_valueMax = 10
        self.m_valueCount = 7
        # 数据生成函数
        self.m_dataTable = self.generateRandomData(self.m_listCount,
                                                   self.m_valueMax, self.m_valueCount)
        self.m_themeComboBox = self.createThemeBox()
        self.m_antialiasCheckBox = QCheckBox("Anti-aliasing")
        self.m_animatedComboBox = self.createAnimationBox()
        self.m_legendComboBox = self.createLegendBox()

        self.connectSignals()

        # Create the layout.
        baseLayout = QGridLayout()
        settingsLayout = QHBoxLayout()
        settingsLayout.addWidget(QLabel("Theme:"))
        settingsLayout.addWidget(self.m_themeComboBox)
        settingsLayout.addWidget(QLabel("Animation:"))
        settingsLayout.addWidget(self.m_animatedComboBox)
        settingsLayout.addWidget(QLabel("Legend:"))
        settingsLayout.addWidget(self.m_legendComboBox)
        settingsLayout.addWidget(self.m_antialiasCheckBox)
        settingsLayout.addStretch()
        baseLayout.addLayout(settingsLayout, 0, 0, 1, 3)

        # Create the charts.
        chartView = QChartView(self.createAreaChart())
        baseLayout.addWidget(chartView, 1, 0)
        self.m_charts.append(chartView)

        chartView = QChartView(self.createBarChart(self.m_valueCount))
        baseLayout.addWidget(chartView, 1, 1)
        self.m_charts.append(chartView)

        chartView = QChartView(self.createLineChart())
        baseLayout.addWidget(chartView, 1, 2)
        self.m_charts.append(chartView)

        chartView = QChartView(self.createPieChart())
        # Funny things happen if the pie slice labels no not fit the screen...
        chartView.setSizePolicy(QSizePolicy.Ignored, QSizePolicy.Ignored)
        baseLayout.addWidget(chartView, 2, 0)
        self.m_charts.append(chartView)

        chartView = QChartView(self.createSplineChart())
        baseLayout.addWidget(chartView, 2, 1)
        self.m_charts.append(chartView)

        chartView = QChartView(self.createScatterChart())
        baseLayout.addWidget(chartView, 2, 2)
        self.m_charts.append(chartView)

        self.setLayout(baseLayout)

        # Set the defaults.
        self.m_antialiasCheckBox.setChecked(True)
        self.updateUI()
1-2-3、数据生成函数以及信号与槽的连接
信号与槽的连接:
- 下拉框m_themeComboBox的m_themeComboBox信号连接在self.updateUI槽函数上
- 复选框m_antialiasCheckBox的toggled信号连接在self.updateUI槽函数上
- 下拉框m_animatedComboBox的currentIndexChanged信号连接在self.updateUI槽函数上
- 下拉框m_legendComboBox的currentIndexChanged信号连接在self.updateUI槽函数上
def connectSignals(self):
   self.m_themeComboBox.currentIndexChanged.connect(self.updateUI)
   self.m_antialiasCheckBox.toggled.connect(self.updateUI)
   self.m_animatedComboBox.currentIndexChanged.connect(self.updateUI)
   self.m_legendComboBox.currentIndexChanged.connect(self.updateUI)
数据生成函数: 构造二维点,以及他们对应的标签。形如(PyQt5.QtCore.QPointF(1.2604348685342468, 0.1913492455939141), ‘Slice 0:1’)
def generateRandomData(self, listCount, valueMax, valueCount):
    random.seed()

    dataTable = []

    for i in range(listCount):
        dataList = []
        yValue = 0.0
        f_valueCount = float(valueCount)

        for j in range(valueCount):
        	#  random.uniform: 生成指定范围内均匀分布的随机浮点数。
            yValue += random.uniform(0, valueMax) / f_valueCount
            # QPointF是Qt库中用于表示2D点的类。QPointF的构造函数接受两个参数,分别是点的 x 坐标和 y 坐标。
            value = QPointF(
            	# random.random()函数生成一个0到1之间的随机浮点数
                j + random.random() * self.m_valueMax / f_valueCount,
                yValue)
            label = "Slice " + str(i) + ":" + str(j)
            # 形如(PyQt5.QtCore.QPointF(1.2604348685342468, 0.1913492455939141), 'Slice 0:1')的元素
            dataList.append((value, label))

        dataTable.append(dataList)

    return dataTable
总结
人与人的悲欢离合不尽相同。