.net图表 10.5
为柱形图和条形图添加拐角半径控件。
5月 05, 2023 - 16:18新版本
特征
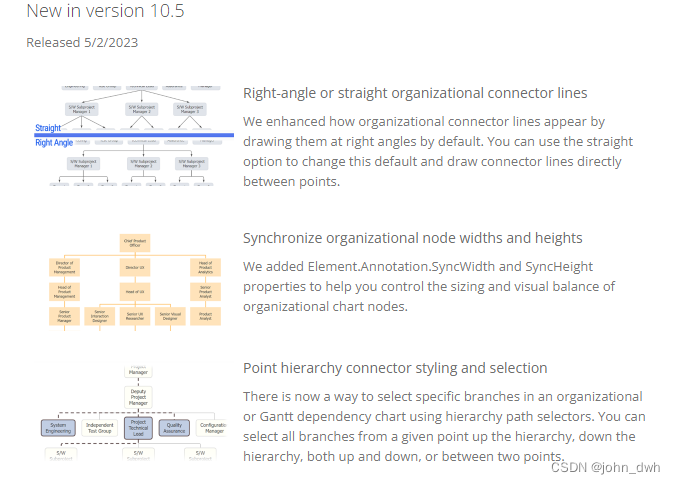
- 直角或直线组织连接线 - 默认情况下,通过以直角绘制组织连接线来增强组织连接线的显示方式。您可以使用直线选项更改此默认值,并直接在点之间绘制连接线。
- 同步组织节点宽度和高度 - 添加了 Element.Annotation.SyncWidth 和 SyncHeight 属性,以帮助您控制组织结构图节点的大小调整和视觉平衡。
- 点层次结构连接器样式和选择 - 添加了使用层次结构路径选择器在组织或甘特图依赖项图中选择特定分支的方法。您可以选择从给定点向上、层次结构向下、向上和向下或两点之间的所有分支。
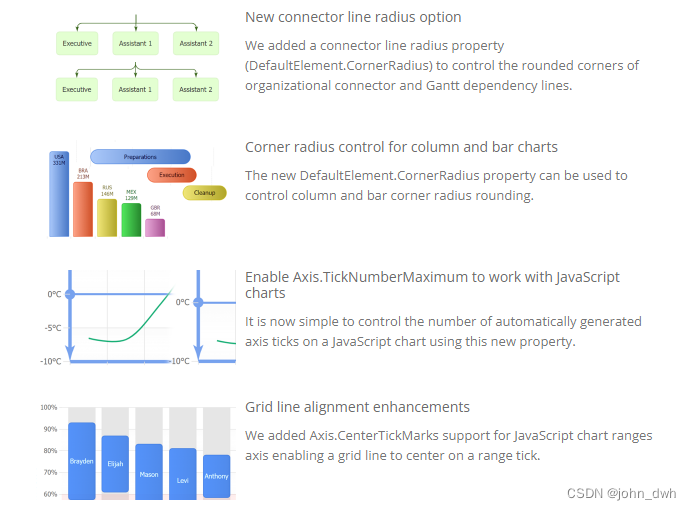
- 新的连接线半径选项 - 添加了连接线半径属性 (DefaultElement.CornerRadius) 来控制组织连接器和甘特图依赖线的圆角。
- 柱形图和条形图的角半径控件 - 新的 DefaultElement.CornerRadius 属性可用于控制柱形图和条形图的角半径圆角。
- 启用 Axis.TickNumberMaximum 以使用图表 - 现在,使用此新属性控制图表上自动生成的轴刻度的数量非常简单。
- 网格线对齐增强功能 - 添加了对图表范围轴的 Axis.CenterTickMarks 支持,使网格线以范围刻度为中心。
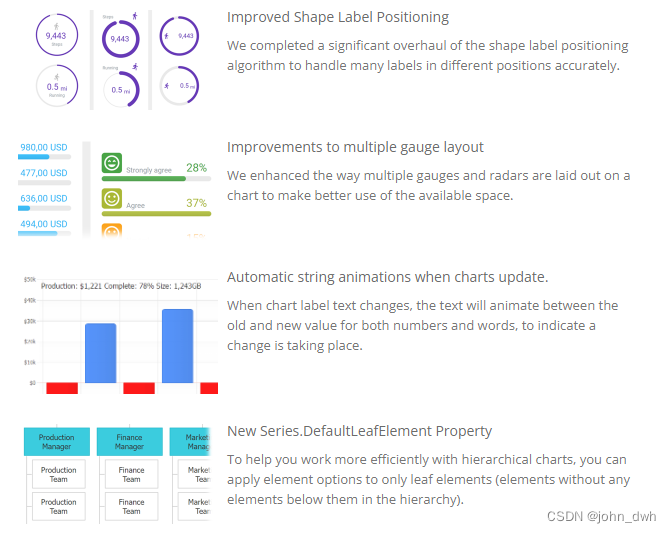
- 改进的形状标签定位 - 彻底修改了形状标签定位算法,以准确处理不同位置的许多标签。
- 改进了多个仪表布局 - 增强了多个仪表和雷达在图表上的布局方式,以更好地利用可用空间。
- 图表更新时自动字符串动画 - 当图表标签文本更改时,文本现在将在数字和单词的旧值和新值之间动画显示,以指示正在发生更改。
- New Series.DefaultLeafElement 属性 - 为了帮助您更有效地使用分层图表,您现在可以仅将元素选项应用于叶元素(层次结构中没有任何元素的元素)。
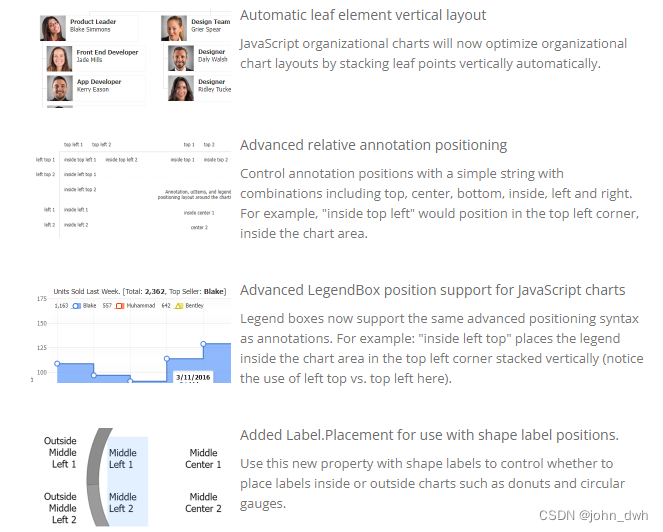
- 自动叶元素垂直布局 - 组织结构图现在将通过自动垂直堆叠叶点来优化组织结构图布局。
- 高级相对注释定位 - 您现在可以使用一个简单的字符串控制注释位置,其中包含包括顶部、中心、底部、内部、左侧和右侧的组合。例如,“左上角内侧”将位于图表区域内的左上角。
- 图表的高级图例框位置支持 - 图例框现在支持与批注相同的高级定位语法。例如:“左上角内侧”将图例放置在左上角垂直堆叠的图表区域内。
- 添加了用于形状标签位置的 Label.放置 - 将此新属性与形状标签一起使用,以控制是将标签放置在图表内部还是外部,例如圆环和圆形仪表。
- 添加了 SmartLabel.Placement - 为了更好地控制标签放置,此新属性指定标签是在元素视觉对象内部还是外部显示。
- 能够禁用图表中的自动标签换行 - 您现在可以禁用图表中所有标签的自动标签换行。
- 添加了标签最大宽度属性 - 想要限制标签宽度?现在,您可以使用“最大宽度标签”选项可靠地限制标签的宽度。超出最大宽度的标签将换行。
- 自动标签省略号文本溢出支持 - 使用 MaxWidth 和自动换行 = false 时,标签现在将自动使用溢出省略号并限制其大小而不换行文本。
- 启用 Chart.OverlapFooter 以使用图表 - 为图表启用后,您现在可以在图表显示品牌时设计图表,并知道删除品牌后它的外观和大小将相同。
.netCHARTING
.netCHARTING provides a managed charting solution for C# and VB.NET developers working with ASP.NET or WinForms. It combines visually stunning graphics and a comprehensive interface that help add compelling charts to your apps. This high performance charting control also contains a feature rich data access and aggregation system with calculation support.
Display large amounts of dynamically generated chart data quickly and easily.
.netCHARTING provides a managed charting solution for C# and VB.NET developers working with ASP.NET or WinForms. It combines visually stunning graphics and a comprehensive interface that help add compelling charts to your apps. This high performance charting control also contains a feature rich data access and aggregation system with calculation support.
Major Features and Benefits
- JavaScript and HTML5 Charts - Easily enable JavaScript Charting with seamless mobile, iOS, Android and tablet support, at no additional charge, with every .netCHARTING license. In addition to visual parity with .netCHARTING's stunning server-side output, the JavaScript charts provide advanced animation and rich client side interactivity support.
- Modern Web Aesthetics - Get a fresh new look for your old charts without a single line of code. Automatically improve the look and feel of your legacy charts simply by using the latest version of .netCHARTING. If you are attached to your legacy look, you can easily maintain it with a simple setting and enable the new look on a chart by chart basis instead.
- InfoGrids - InfoGrids produce results similar to data grid controls; however, they are created and drawn within the chart image itself. As a result, an InfoGrid can be styled to produce a significantly more polished and integrated grid that users can take with them, along with that chart, in a single image file.
- Rich Tooltips - Complex tooltips are now supported with inline formatted image text, MicroCharts, InfoGrids and even full chart previews ideal for drilldown cases and to provide convey more information to the end user.
- Calendar Pattern Support - Define custom calendar patterns to implement axis markers. Calendar patterns will enable you to highlight a specific event or region of your data which reoccurs including marking weekends or other recurring events. They can also be used to trim data and to specify scale breaks.
- Label Tokens and Expressions - Use tokens and mathematical expressions within labels to simplify the creation of dynamically generated labels.
- Box Header Styling - An advanced new box header system has been added supporting 10,000+ unique combinations with the advanced alignment and endcap visuals, shadows, offsets and much more.
- Scale Breaks - Often a chart has a few outlier data points which result in charts that are not legible for the bulk of the data. For example, if you had a chart of 100 values between 1 and 10 but 2 of the values were over 1,000 you could not accurately determine the values due to a compressed scale.
- GIS Mapping Support - Maps support unlimited numbers of layers and can accept real data, readily available online, for the entire globe.
- Chart Mentor - The chart mentor offers useful tips and samples based on the chart you are creating. It can help you resolve problems and improve the implementation of your chart in the most efficient way.
- ImageBars - ImageBars provide stunning themed, pictorial representations in bar form.
- Multiple chart areas sharing axes - Create multiple independent chart areas within a single chart image. Advanced automatic alignment functionality enables a single axis to span multiple chart areas and automatically align with each other.
- Axis Zooming - This innovative new feature can also be combined with interactive image map features of .netCHARTING for drill down zoom functionality.
- Stunning Visuals - The inclusion of more visually appealing charts will help expand the appeal of your application or web site to a broader audience.
- MicroCharts - MicroCharts are miniature versions of actual charts, designed to help viewers understand complex relationships between data in repetitive scenarios such as data grids or InfoGrids.
- Unparalleled Customization - As charting requirements become more advanced, it is crucial that your charting component is able to keep up to your developers' demands. .netCHARTING is extremely flexible and able to meet even the most extensive requirements.
- Element Sub Values - As part of a comprehensive system for representing errors in collected data, .netCHARTING supports multiple sub values rendered as error bars, lines and markers.
- Statistics / Financial Indicators - Advanced statistical and financial indicators are built into the .netCHARTING API providing quick access to complex data analysis functionality.
- Chart Type Customization - With the powerful and flexible approach to chart types different series can be set to different chart types at the same time in the same chart.
- Data Sources - Utilizing a flexible UI for data acquisition, virtually any data source can be used to populate charts with data.
- Comprehensive Output Formats - Output formats are available to accommodate any scenario.
- Hundreds of samples - A comprehensive array of samples and tutorials ensures that you will be able to quickly jump start your chart development without needing to review the extensive API documentation which is also available.
- Smart Features - .netCHARTING's "Smart" features allow you to concentrate on the project at hand while the component automatically tunes the chart to meet your specific needs.
- Smart Label Support - The “smart label” system ensures that labels do not collide or overlap even when chart elements are very close to each other.
- Smart Time Axes - A feature which quickly, intuitively and, with a minimum of labels, conveys time related data on the axis.
- Automatic Date Aggregation - Automatically group data by weeks, months, years and more - before the chart is plotted.