下载水球图
npm install echarts
npm install echarts-liquidfill
在对应组件中引入也可在main.ts中引入水球图
 import * as echarts from 'echarts'
  import 'echarts-liquidfill'
使用echarts必须给echarts图表设置宽高
<template>
    <div class="water-wave">
      <div ref="liquidEchart" style="width: 200px; height: 200px"></div>
    </div>
  </template>
此处绑定ref 是为了给图表数据 宽高是为了显示水球图
效果图
底部发光图是切图定位显示


代码如下
<template>
    <div class="water-wave">
      <div ref="liquidEchart" style="width: 200px; height: 200px">

    </div>

    </div>
  </template>

  <script lang="ts">
  import { defineComponent, onMounted, ref } from 'vue'
  import * as echarts from 'echarts'
  import 'echarts-liquidfill'

  export default defineComponent({
    name: 'WaterWave',
    setup() {
      // 组件逻辑
      const liquidEchart = ref<HTMLElement>()
      onMounted(() => {
        initLiquidEchart()
      })
      const initLiquidEchart = () => {
        let myChart = echarts.init(liquidEchart.value!)
        let value = 0.6
        // 把配置和数据放这里
        myChart.setOption({
          title: {
            // 标题
            text: '',
            textStyle: {
              // 标题的样式
              color: '#888', // 字体颜色
              fontFamily: 'Microsoft YaHei', // 字体
              fontSize: 24,
              fontWeight: '400',
              align: 'center', // 文字的水平方式
              baseline: 'middle',
              position: 'inside',
              verticalAlign: 'middle', // 文字的垂直方式
            },
            left: 'center', // 定位
            top: '20%',
          },
           series: [{
    type: 'liquidFill',
    radius: '80%', //水球大小
    center: ['50%', '50%'],
    waveAnimation: true,
    color: [
      {
        type: 'linear',
        x: 0,
        y: 0,
        x2: 0,
        y2: 1,
        colorStops: [
          {
            offset: 0,
            color: '#138FE2',
          },
          {
            offset: 1,
            color: '#126ABC',
          },
        ],
        globalCoord: false,
      },
    ],
    data: [0.3, 0.3], // data个数代表波浪数
    amplitude: 10, //振幅
    backgroundStyle: {
      borderWidth: 2, //边框大小
      borderColor:'rgba(17, 94, 176, 0.8)',//边框颜色
      color: 'rgba(17, 94, 176, 0.4)',
    },
    label: {
      normal: {
        textStyle: {
          fontSize: 24,
          fontWeight: 'bold',
          color: '#fff',
        },
      },
    },
    outline: {
      borderDistance: 0,
      itemStyle: {
        borderWidth: 4,
        borderColor: 'transparent',
      },
    },
  }],
        })
      }

      return { liquidEchart }
    },
  })
  </script>

  <style lang="scss" scoped  />
借鉴代码
效果图
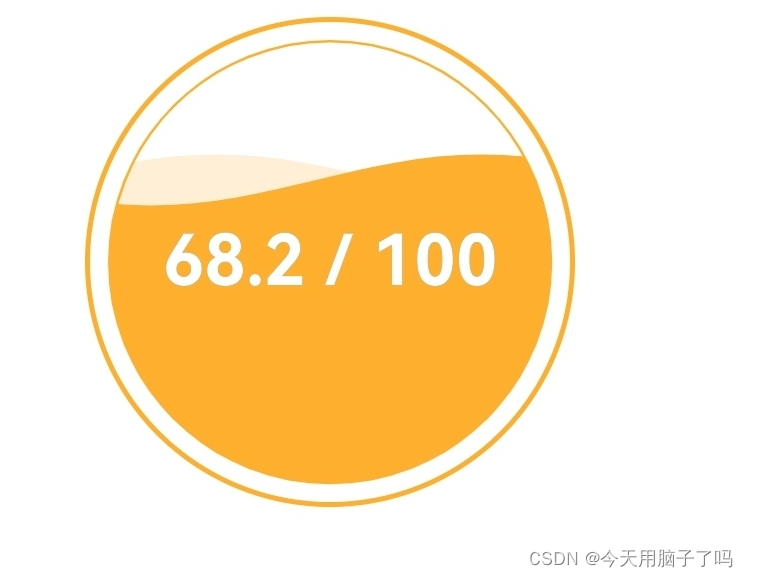
<template>
  <div class="water-wave">
    <div ref="liquidEchart" style="width: 200px; height: 200px"></div>
  </div>
</template>

<script lang="ts">
import { defineComponent, onMounted, ref } from 'vue'
import * as echarts from 'echarts'
import 'echarts-liquidfill'

export default defineComponent({
  name: 'WaterWave',
  setup() {
    // 组件逻辑
    const liquidEchart = ref<HTMLElement>()
    onMounted(() => {
      initLiquidEchart()
    })
    const initLiquidEchart = () => {
      let myChart = echarts.init(liquidEchart.value!)
      let value = 0.6
      // 把配置和数据放这里
      myChart.setOption({
        title: {
          // 标题
          text: '',
          textStyle: {
            // 标题的样式
            color: '#888', // 字体颜色
            fontFamily: 'Microsoft YaHei', // 字体
            fontSize: 24,
            fontWeight: '400',
            align: 'center', // 文字的水平方式
            baseline: 'middle',
            position: 'inside',
            verticalAlign: 'middle', // 文字的垂直方式
          },
          left: 'center', // 定位
          top: '20%',
        },
        series: [
          {
            type: 'liquidFill',
            radius: '78%', // 水球大小
            waveAnimation: true,
            center: ['50%', '50%'],
            color: ['#FFEFD6', '#FEAF2E'],
            data: [value, value], // data个数代表波浪数
            amplitude: 10, //振幅
            // 图形样式
            itemStyle: {
              opacity: 1, // 波浪的透明度
              shadowBlur: 0, // 波浪的阴影范围
            },
            backgroundStyle: {
              borderWidth: 1, // 边框的宽度
              borderColor: '#FEAF2E', // 边框颜色
              color: '#fff',
            },
            label: {
              // 数据展示样式
              show: true,
              textStyle: {
                color: '#000',
                insideColor: '#fff',
                fontSize: 30,
                fontWeight: 600,
              },
              formatter: (params: any) => {
                return `${(params.value * 100).toFixed(1)}/200` // 文字显示
              },
            },
            outline: {
              show: false,
            },
          },
        ],
      })
    }

    return { liquidEchart }
  },
})
</script>

<style lang="scss" scoped src="./index.scss" />
vue3项目中封装为组件
新建组件liquidFill.vue
<template></template>

<script lang="ts" setup>
// 1. 引入
import { nextTick, watch } from 'vue';
import echarts from '@/assets/ts/echarts';
import 'echarts-liquidfill';
const props = defineProps({
    // 父容器ID
    pid: {
        type: String,
        required: true,
    },
    title: {
        type: String,
        required: true,
    },
    value: {
        type: Number,
        required: true,
    },
    // 水球图背景颜色
    bgColor: {
        type: String,
        default: 'rgba(32, 165, 255, 0.3)',
    },
    // 波纹的颜色
    color: {
        type: String,
        default: '#20a5ff',
    },
    // 单位
    unit: {
        type: String,
        default: '',
    },
});

nextTick(() => {
    // 2. 容器
    const container = document.querySelector('#' + props.pid) as HTMLElement;
    if (container) initChart(container);
});
// 3. 初始化 echarts 实例, 将配置添加给 echarts 实例
let myChart: echarts.ECharts | null = null;
const initChart = (container?: HTMLElement) => {
    if (!myChart) myChart = echarts.init(container as HTMLElement);
    myChart.setOption(option);
};

watch(
    () => props.value,
    newVal => {
        option.series[0].data[0] = newVal;
        initChart();
    },
);
// 4.配置项
const option = {
    title: {
        text: props.title,
        x: '40%',
        y: '88%',
        textStyle: {
            fontSize: 14,
            fontWeight: '100',
            color: '#fff',
            lineHeight: 16,
            textAlign: 'center',
        },
    },

    series: [
        {
            type: 'liquidFill',
            radius: '70%',
            center: ['50%', '40%'],
            color: [
                {
                    type: 'linear',
                    x: 0,
                    y: 0,
                    x2: 0,
                    y2: 1,
                    colorStops: [
                        {
                            offset: 0,
                            // color: "#446bf5",
                            color: props.color,
                        },
                        {
                            offset: 1,
                            color: '#2ca3e2',
                        },
                    ],
                    globalCoord: false,
                },
            ],
            data: [props.value, 0.5], // data个数代表波浪数
            backgroundStyle: {
                borderWidth: 1,
                color: props.bgColor,
            },
            label: {
                // show:false,
                fontSize: 50,
                color: '#fff',
                formatter: '{c}' + props.unit,
            },
            outline: {
                show: false,
                borderDistance: 0,
                itemStyle: {
                    borderWidth: 2,
                    borderColor: '#112165',
                },
            },
        },
    ],
};
</script>
使用
  <div id="load-chart" v-if="curSiteInfo.loadPer || curSiteInfo.loadPer === 0">
                    <LiquidFill pid="load-chart" title="负荷率" :value="curSiteInfo.loadPer" unit="%"></LiquidFill>
                </div>
                <div id="power-factor" v-if="curSiteInfo.Pf || curSiteInfo.Pf === 0">
                    <LiquidFill pid="power-factor" title="功率因数" :value="curSiteInfo.Pf" color="rgba(37, 227, 255)"
                        bgColor="rgba(37, 227, 255,0.3)"></LiquidFill>

                </div>
#load-chart,
#power-factor {
width: 50%;
height: 83%;
margin-top: 8%;
background: url('@/assets/img/Profile/DomesticService/bottom.png') no-repeat 80% 93%;
background-size: 95% 20%;
}