事件描述
晚上手机短信突然收到大量主机unreachable的告警。立即登录相关服务器进行排查发现均无异常,业务测试正常。
因几乎所有主机都已告警unreachable,故怀疑是zabbix自身异常导致,随后进行排查。
排查思路
一、查看zabbixserver日志,直接发现了mysql连接中断的异常
日志中先是出现大量数据库连接丢失的日志
55187:20220629:035108.704 [Z3005] query failed: [2013] Lost connection to MySQL server at 'reading initial communication packet', system error: 104 [begin;]
 55235:20220629:035108.704 [Z3005] query failed: [2013] Lost connection to MySQL server during query [select h.hostid,h.status,h.tls_accept,h.tls_issuer,h.tls_subject,h.tls_psk_identity,a.host_metadata from hosts h left join autoreg_host a on a.proxy_hostid is null and a.host=h.host where h.host='testserver' and h.status in (0,1) and h.flags<>2 and h.proxy_hostid is null]
 55235:20220629:035108.704 slow query: 11.197553 sec, "select h.hostid,h.status,h.tls_accept,h.tls_issuer,h.tls_subject,h.tls_psk_identity,a.host_metadata from hosts h left join autoreg_host a on a.proxy_hostid is null and a.host=h.host where h.host='testserver' and h.status in (0,1) and h.flags<>2 and h.proxy_hostid is null"
 54930:20220629:035108.704 [Z3005] query failed: [2013] Lost connection to MySQL server during query [select escalationid,actionid,triggerid,eventid,r_eventid,nextcheck,esc_step,status,itemid,acknowledgeid from escalations where triggerid is not null and nextcheck<=1656445826 order by actionid,triggerid,itemid,escalationid]
 54930:20220629:035108.705 slow query: 45.073163 sec, "select escalationid,actionid,triggerid,eventid,r_eventid,nextcheck,esc_step,status,itemid,acknowledgeid from escalations where triggerid is not null and nextcheck<=1656445826 order by actionid,triggerid,itemid,escalationid"
 55220:20220629:035108.705 [Z3005] query failed: [2013] Lost connection to MySQL server during query [select h.hostid,h.status,h.tls_accept,h.tls_issuer,h.tls_subject,h.tls_psk_identity,a.host_metadata from hosts h left join autoreg_host a on a.proxy_hostid is null and a.host=h.host where h.host='testserver2' and h.status in (0,1) and h.flags<>2 and h.proxy_hostid is null]
 54918:20220629:035108.705 [Z3005] query failed: [2013] Lost connection to MySQL server during query [select refresh_unsupported,discovery_groupid,snmptrap_logging,severity_name_0,severity_name_1,severity_name_2,severity_name_3,severity_name_4,severity_name_5,hk_events_mode,hk_events_trigger,hk_events_internal,hk_events_discovery,hk_events_autoreg,hk_services_mode,hk_services,hk_audit_mode,hk_audit,hk_sessions_mode,hk_sessions,hk_history_mode,hk_history_global,hk_history,hk_trends_mode,hk_trends_global,hk_trends,default_inventory_mode from config order by configid]
 54922:20220629:035108.705 [Z3005] query failed: [2013] Lost connection to MySQL server during query [delete from history where itemid=44780 and clock<1655830340]
 54922:20220629:035108.705 slow query: 101.087109 sec, "delete from history where itemid=44780 and clock<1655830340"
 54922:20220629:035108.705 database is down: retrying in 10 seconds
 55187:20220629:035108.706 [Z3001] connection to database 'zabbix' failed: [2003] Can't connect to MySQL server on '192.168.2.99' (111)
之后为大量到mysql数据库的重连日志
 55174:20220629:041906.024 database connection re-established
 55228:20220629:041906.024 database connection re-established
 54925:20220629:041906.024 database connection re-established
 55195:20220629:041906.024 database connection re-established
 55291:20220629:041906.110 database connection re-established
 55318:20220629:041906.137 database connection re-established
 55248:20220629:041906.317 database connection re-established
 55367:20220629:041906.898 database connection re-established
二、检查mysql发现日志如下,定位到磁盘问题
2022-06-28T18:24:16.532664Z 23 [Warning] InnoDB: Retry attempts for reading partial data failed.
2022-06-28T18:24:16.532718Z 23 [ERROR] InnoDB: Tried to read 16384 bytes at offset 5098094592, but was only able to read 0
2022-06-28T18:24:16.532751Z 23 [ERROR] InnoDB: Operating system error number 5 in a file operation.
2022-06-28T18:24:16.532769Z 23 [ERROR] InnoDB: Error number 5 means 'Input/output error'
2022-06-28T18:24:16.532784Z 23 [Note] InnoDB: Some operating system error numbers are described at http://dev.mysql.com/doc/refman/5.7/en/operating-system-error-codes.html
2022-06-28T18:24:16.532796Z 23 [ERROR] InnoDB: File (unknown): 'read' returned OS error 105. Cannot continue operation
2022-06-28T18:24:16.532806Z 23 [ERROR] InnoDB: Cannot continue operation.
2022-06-28T18:24:19.274054Z 0 [Note] InnoDB: FTS optimize thread exiting.
三、查看message日志,发现mysql存在频繁重启,磁盘有损坏扇区
Jun 29 04:24:29 localhost systemd: mysqld.service: main process exited, code=exited, status=3/NOTIMPLEMENTED
Jun 29 04:24:29 localhost systemd: Unit mysqld.service entered failed state.
Jun 29 04:24:29 localhost systemd: mysqld.service failed.
Jun 29 04:24:29 localhost systemd: mysqld.service holdoff time over, scheduling restart.
Jun 29 04:24:29 localhost systemd: Cannot add dependency job for unit sshd.socket, ignoring: Unit not found.
Jun 29 04:24:29 localhost systemd: Stopped MySQL Server.
Jun 29 04:24:29 localhost systemd: Starting MySQL Server...
Jun 29 04:24:32 localhost systemd: Started MySQL Server.

Jun 29 04:24:39 localhost kernel: sd 0:0:1:0: [sdb] FAILED Result: hostbyte=DID_OK driverbyte=DRIVER_SENSE
Jun 29 04:24:39 localhost kernel: sd 0:0:1:0: [sdb] Sense Key : Medium Error [current]
Jun 29 04:24:39 localhost kernel: sd 0:0:1:0: [sdb] Add. Sense: No additional sense information
Jun 29 04:24:39 localhost kernel: sd 0:0:1:0: [sdb] CDB: Read(10) 28 00 40 aa da 20 00 00 08 00
Jun 29 04:24:39 localhost kernel: blk_update_request: I/O error, dev sdb, sector 1084938784
四、通过badblocks进行磁盘检查
在linux终端输入命令
badblocks -s -v /dev/sdb
可以检测到大量坏块
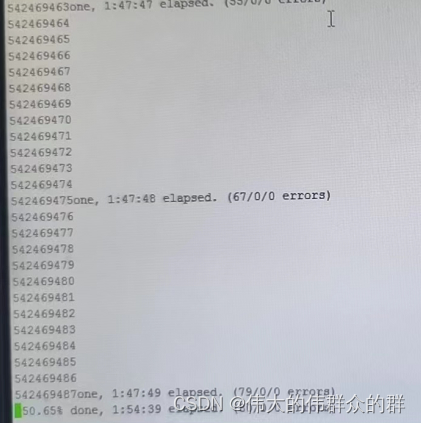
至此已确定问题根源!
处理结果
尝试将数据迁出更换磁盘,但部分数据已无法读取。最终将最新的snapshot还原到新的存储上解决,但代价是丢失了部分history数据。庆幸不是业务生产环境。
将更换下的磁盘进行检测,尝试进行逻辑修复未果,判断为物理损坏。
吃一堑长一智,切记重要业务数据一定要留存副本。
参考
blog.51cto.com/u_13236892/5278888