An Automatic Detection Scheme for Periodic Signals Based on Spectrum Analyzer Measurements 导读
Summary
1.Abstract
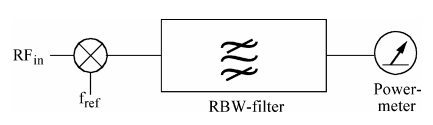
The Basic structure of the system:
(1)Use the Spectrum Analyzer to measure the spectrum signal;
(2)Propose a method to discrimination between spectrum lines and noise lines using the RWB (resolution Bandwidth);
(3)Deliver a statistical framework for the algorithm and the measurements.
2. Introduction
(1) Propose the significance of distinguish between the signal and the noise in the sight of power and system application;
(2) Three methods in detection of signal:
① Guess the number of significant harmonics a priori.
② Examine the raw data by hand to find the lines that rise above the noise floor.
③ Using the nonlinear vectorial network analyzer (NVNA) to detect the signal contributions in the complex output spectrum automatically.
(3) In this paper, a new method to detect the signal was proposed: decrease the RWB to decrease the measured noise power.
3.Proposed Detection Algorithm
(1)Structure
(2)Condition of application: discrete and periodic signal.
(3)Principles of application: RBW filter is a resolution bandwidth adjustable band-pass filter, When observe the specific frequency, spectrum analyzer shows the sum of noise power in band-pass of RBW filter. At the same time, the power of exist signal is constant, the power of noise is changing, with this character, to diagnose the signal.
(4)Equation of judgement:
Ni denotes the power of noise for measurement i, if the Psignal is existed, the value of Q is close to 1, Q will be smaller than 1, if no signal is present.
4.Measurements
(1)Some extra problems caused by measurement of the noise and signal:
① The pdf (probability density function) is reshaped by the logarithm, so the conversion of dBms to watts has to be made;
② Using the spectrum analyzer in ‘normal mode’ results in a min-max view of the noise and the signal;
③ To avoid the distortion, the spectrum analyzer can be used in ‘sample mode’, but requires synchronization of clocks from the source and the spectrum analyzer;
④ Spectrum analyzer can clip parts of the noise to the lower bounding value, but the power levels becomes unpredictable.
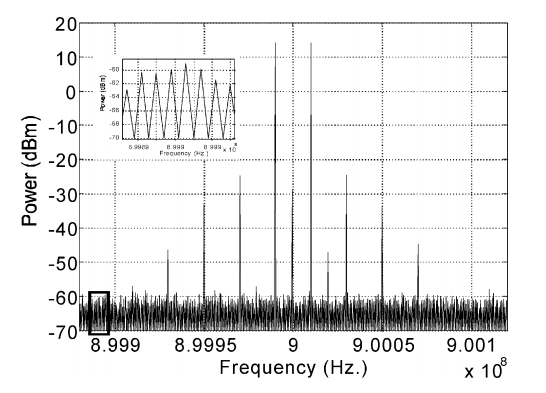
(2)To make the signal to be above the noise, we need the additional attenuator to make the result more observable. The result shows in Fig1.
The information in ‘normal mode’ is easier to interpret visually than ‘sample mode’, and the ‘normal mode’ can detect the signal line, there are some noise line can be misinterpreted as being signal lines. But the combination of these modes lead to the correct signal lines.