Looking for Gantt Charts in Java for Complex Planning?
Create an outstanding visual scheduling experience with interactive Gantt charts
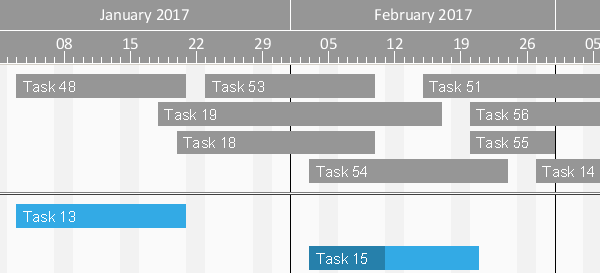
Are you currently developing a Java application and are looking for a way of visualizing your time- and resource-oriented planning data and their dependencies in a Gantt chart? The VARCHART JGantt control with its comprehensive object model is the ideal tool for rapidly developing interactive Java Gantt charts. The powerful features of VARCHART JGantt let you design a Gantt chart containing precisely the functionality needed for your planning requirements – whether for project planning, staff disposition, production scheduling or other application areas.
The Ease Of Developing Powerful Java Gantt Charts
See examples how VARCHART JGantt enhances your scheduling application
A picture is worth than tousands words. In that regard, a video is worth than tousands pictures. Watch four sample videos to see how our Gantt chart control VARCHART JGantt enriches your Java scheduling application. The short clips either feature specific JGantt functions or (small) applications that have been built with the control.
Release Notes VARCHART JGantt
We consider product maintenance just as important as the development of new features & products. Our regular service releases offer our customers constantly revised versions of our products, comprising updates, bug fixes and product enhancements. This is a free service for customers with a valid support & maintenance agreement.
Advanced Java Gantt Chart Control Features
See five hidden, but powerful features for your scheduling application
Optimizes Display of Overlapping Nodes
Overlapping activities are usually highlighted by a red underscore in one row. But how do you know how much the activities overlap each other? Optimize the view by arranging the overlapping activities one below the other. The row width will be adjusted automatically.

Layers and Nodes: Different Time Frames
An activity can comprise of several data records such as the set date pair "earliest start" and "latest finish" in project plans. Each pair of dates is represented by a layer and the whole activity by a node – recognizable by freely selectable attributes such as a light background for the activity. If dates are modified, you can either modify a layer (extend. shorten, move, delete) or the complete node (depending on your new planning requirements).
Phantoms Display – but Don't Define
Make use of the VARCHART JGantt phantom if you want to check the effects of your modifications first. When moving a phantom, the effect on the other data will be shown immediately, but not yet committed. Only when you release the phantom will the modification be carried out.


Symbols - Also Used in the Table
The completion of activities can be indicated by a modifiication of the layer color - or by symbols in the table. A completed task coud be highlighted by a green hook, a delayed task by a red exclamation mark and a task in process by a blue dot. Of course you can choose symbols you like – traffic lights, smilies etc. Please note that as soon as the data are modified these tags change automatically according to the predefined conditions.
Zooming Interactively Into the Timescale
The timescale can be spread or minimized per mouse. Divide the time scale into different sections with different resolutions to concentrate upon a certain time span without losing sight of past or future time segments.
