1、看定义
雷达图(Radar Chart),又可称为戴布拉图、蜘蛛网图(Spider Chart),是财务分析报表的一种。雷达图是以从同一点开始的轴上表示的三个或更多个定量变量的二维图表的形式显示多变量数据的图形方法。轴的相对位置和角度通常是无信息的。 雷达图也称为网络图,蜘蛛图,星图,蜘蛛网图,不规则多边形,极坐标图或Kiviat图。它相当于平行坐标图,轴径向排列。
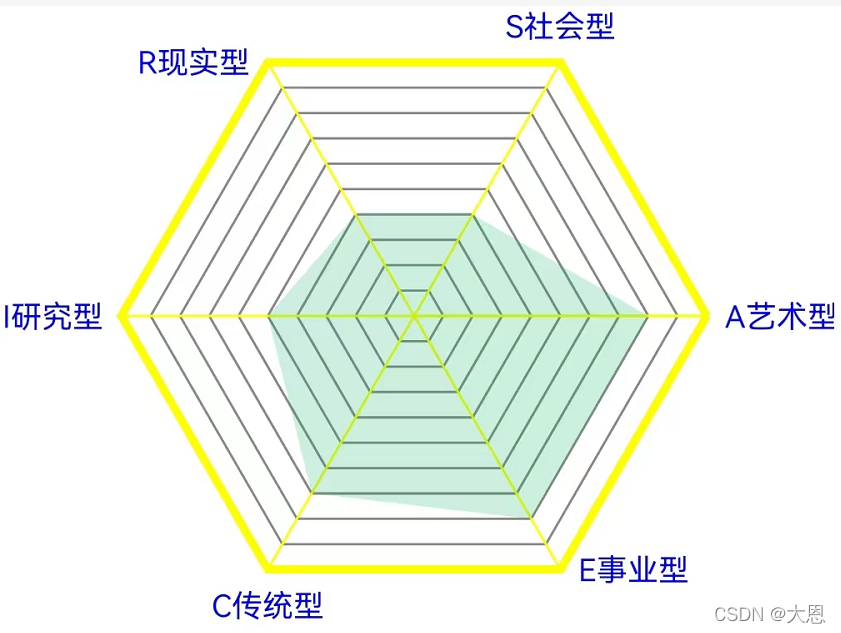
在 心理测评全系统设计与代码实现 一文中绘制了雷达图, 这是将代码分享出来,希望对大家有所帮助。
在这里插入图片描述
3、上代码
这里只定义一个canvas即可
- wxml
<canvas canvas-id="canvas" class="canvas" style="width: 700rpx; height: 600rpx;background:#fff;;" />
- js
  ///绘制雷达图,开始
  getRatio() {


    let systemInfo = wx.getSystemInfoSync();
    let ratio = 750 / systemInfo.windowWidth; // rpx/px比例
    return ratio;
  },
  Radarchart(mData) {


    const L_RADIUS = 244 / this.getRatio(); // 大圆半径
    const LINE_WIDTH = 2 / this.getRatio(); //线宽
    const ctx = wx.createCanvasContext("canvas");

    const canvasW = 700 / this.getRatio(); // canvas宽
    const canvasH = 600 / this.getRatio(); //canvas高
    //清空画布
    ctx.clearRect(0, 0, canvasW, canvasH);
    ctx.save();
    // 重新映射 canvas的 (0, 0),映射的结果是让canvas的坐标原点位于 canvas的中心位
    ctx.translate(canvasW / 2, canvasH / 2);
    // 多边形的边数
    const mCount = mData.length;
    // 需要旋转多少度,才能将多边形旋转到底边平行于 X轴,奇多边形才需要,偶多边形不需要旋转
    const sAngle = (90 / mCount / 180) * Math.PI;
    let rotateAngle = mCount % 2 === 0 ? 0 : sAngle * (mCount % 4 === 3 ? -1 : 1); //底边平行x轴
    // 多边形外接圆半径
    const lCoordinates = this.getCoordinatesByRadius(
      L_RADIUS,
      mCount,
      -rotateAngle
    );

    //绘制边框线

    //绘制边框线
    for (let index = 1; index < 10; index++) {


      this.renderBorder(
        ctx,
        "yellow",
        3,
        L_RADIUS,
        -rotateAngle,
        mCount
      );
    }
    for (let index = 1; index < 10; index++) {


      this.renderBorder(
        ctx,
        "#888",
        LINE_WIDTH,
        L_RADIUS / 10 * index,
        -rotateAngle,
        mCount
      );
    }
    //绘制连接线
    this.renderLinkLine(
      ctx,
      0,
      0,
      lCoordinates,
      "yellow",
      LINE_WIDTH
    );
    //绘制文字
    this.drawText(
      ctx,
      lCoordinates,
      mData,
      26 / this.getRatio(), //26rpx
      "blue"
    );
    this.drawRadar(
      ctx,
      mData,
      L_RADIUS,
      -rotateAngle
    );
    ctx.draw();
  },
  /**
   * 获取多边形坐标
   * @param mRadius 半径
   * @param mCount 边数
   * @param rotateAngle 旋转角度
   * @return {Array}
   */
  getCoordinatesByRadius(mRadius, mCount, rotateAngle = 0) {


    const mAngle = (Math.PI * 2) / mCount;
    let coordinates = [];
    for (let i = 1; i <= mCount + 1; i++) {


      let x = mRadius * Math.cos(mAngle * (i - 1) + rotateAngle);
      let y = mRadius * Math.sin(mAngle * (i - 1) + rotateAngle);
      coordinates.push([x, y]);
    }
    return coordinates;
  },
  /**
   * 绘制边框
   * @param cxt 上下文
   * @param color 线框颜色
   * @param lineWidth 线宽
   * @param radius 半径
   * @param rotateAngle 旋转角度
   * @param background 背景色
   */
  renderBorder(
    ctx,
    color,
    lineWidth,
    radius,
    rotateAngle,
    mCount,
    background
  ) {


    let coordinates = this.getCoordinatesByRadius(
      radius,
      mCount,
      rotateAngle
    );
    ctx.beginPath();
    coordinates.forEach((coordinate, index) => {


      if (index == 0) {


        ctx.moveTo(coordinate[0], coordinate[1]);
      } else {


        ctx.lineTo(coordinate[0], coordinate[1]);
      }
    });
    ctx.setStrokeStyle(color);
    ctx.setLineWidth(lineWidth);
    ctx.stroke();
    if (background) {


      ctx.setFillStyle(background);
      ctx.fill();
    }
    ctx.closePath();
  },
  /**
   * 绘制连接线
   * @param ctx 上下文
   * @param centerX 中心x
   * @param centerY 中心y
   * @param coordinates 外边框坐标
   * @param color 连线颜色
   * @param lineWidth 连线宽度
   */
  renderLinkLine(ctx, centerX, centerY, coordinates, color, lineWidth) {


    coordinates.forEach((coordinate, index) => {


      ctx.beginPath();
      ctx.moveTo(centerX, centerY);
      ctx.lineTo(coordinate[0], coordinate[1]);
      ctx.setStrokeStyle(color);
      ctx.setLineWidth(lineWidth);
      ctx.stroke();
      ctx.closePath();
    });
  },
  /**
   * 绘制雷达图
   * @param ctx
   * @param mData
   * @param lRadius
   * @param rotateAngle
   */
  drawRadar(ctx, mData, lRadius, rotateAngle = 0) {


    const mCount = mData.length;
    let radius = [];
    mData.forEach((item, index) => {


      radius.push((item.score / item.fullScore) * lRadius);
    });
    radius.push((mData[0].score / mData[0].fullScore) * lRadius);

    const mAngle = (Math.PI * 2) / mCount;
    let coordinates = [];
    for (let i = 1; i <= mCount + 1; i++) {


      let x = radius[i - 1] * Math.cos(mAngle * (i - 1) + rotateAngle);
      let y = radius[i - 1] * Math.sin(mAngle * (i - 1) + rotateAngle);
      coordinates.push([x, y]);
    }

    ctx.beginPath();
    coordinates.forEach((coordinate, index) => {


      if (index == 0) {


        ctx.moveTo(coordinate[0], coordinate[1]);
      } else {


        ctx.lineTo(coordinate[0], coordinate[1]);
      }
    });

    ctx.setFillStyle("rgba(6, 174, 86,0.2)");
    ctx.fill();
    ctx.closePath();
  },
  /**
   * 绘制文字
   * @param ctx 上下文
   * @param coordinates 文字坐标
   * @param mData 文字数据
   * @param fontSize 文字大小
   * @param color 文字颜色
   */
  drawText(ctx, coordinates, mData, fontSize, color) {


    const yArr = coordinates.map(coordinate => {


      return coordinate[1];
    });
    const maxY = Math.max(...yArr); //最高点
    const minY = Math.min(...yArr); // 最低点
    const moveDistance = 15 / this.getRatio();
    ctx.setFontSize(fontSize);
    ctx.setFillStyle(color);
    coordinates.forEach((coordinate, index) => {


      if (mData[index]) {


        let x = coordinate[0];
        let y = coordinate[1];
        if (maxY == coordinate[1]) {


          y += moveDistance;
          ctx.setTextAlign("center");
          ctx.setTextBaseline("top");
        } else if (minY == coordinate[1]) {


          ctx.setTextBaseline("bottom");
          ctx.setTextAlign("center");
          y -= moveDistance;
        } else if (coordinate[0] < 0) {


          ctx.setTextAlign("right");
          ctx.setTextBaseline("middle");
          x -= moveDistance;
        } else if (coordinate[0] > 0) {


          ctx.setTextAlign("left");
          ctx.setTextBaseline("middle");
          x += moveDistance;
        }
        ctx.fillText(mData[index].title, x, y);
      }
    });
  }