1.编译matcaffe,用matlab接口特征图可视化
fm_visual.m
clear;
clc;
close all;
addpath('matlab')
caffe.set_mode_cpu();
fprintf(['Caffe Version = ', caffe.version(), '\n']);
net = caffe.Net('models/bvlc_reference_caffenet/deploy.prototxt', 'models/bvlc_reference_caffenet/bvlc_reference_caffenet.caffemodel', 'test');
fprintf('Load net done. Net layers : ');
net.layer_names
fprintf('Net blobs : ');
net.blob_names
fprintf('Now preparing data...\n');
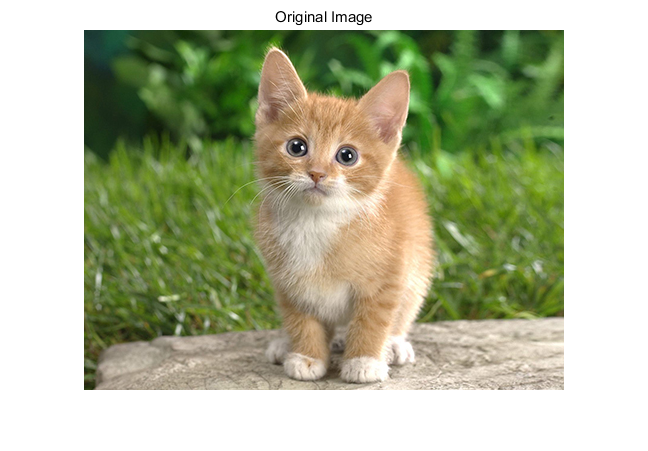
im = imread('examples/images/cat.jpg');
figure;imshow(im);title('Original Image');
d = load('matlab/+caffe/imagenet/ilsvrc_2012_mean.mat');
mean_data = d.mean_data;
IMAGE_DIM = 256;
CROPPED_DIM = 227;
% Convert an image returned by Matlab's imread to im_data in caffe's data
% format: W x H x C with BGR channels
im_data = im(:, :, [3, 2, 1]); % permute channels from RGB to BGR
im_data = permute(im_data, [2, 1, 3]); % flip width and height
im_data = single(im_data); % convert from uint8 to single
im_data = imresize(im_data, [IMAGE_DIM IMAGE_DIM], 'bilinear'); % resize im_data
im_data = im_data - mean_data; % subtract mean_data (already in W x H x C, BGR)
im = imresize(im_data, [CROPPED_DIM CROPPED_DIM], 'bilinear'); % resize im_data
km = cat(4, im, im, im, im, im);
pm = cat(4, km, km);
input_data = {pm};
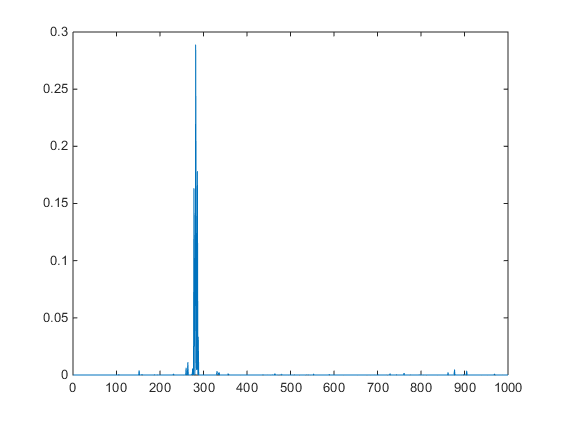
scores = net.forward(input_data);
scores = scores{1};
scores = mean(scores, 2); % take average scores over 10 crops
[~, maxlabel] = max(scores);
maxlabel
figure;plot(scores);
fm_data = net.blob_vec(1);
d1 = fm_data.get_data();
fprintf('Data size = ');
size(d1)
visualize_feature_maps(d1, 1);
fm_conv1 = net.blob_vec(2);
f1 = fm_conv1.get_data();
fprintf('Feature map conv1 size = ');
size(f1)
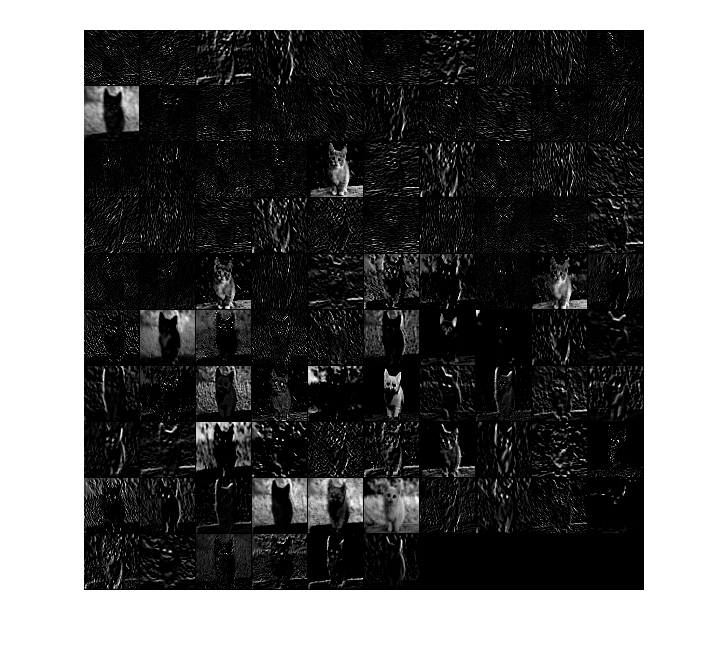
visualize_feature_maps(f1, 1);
fm_conv2 = net.blob_vec(5);
f2 = fm_conv2.get_data();
fprintf('Feature map conv2 size = ');
size(f2)
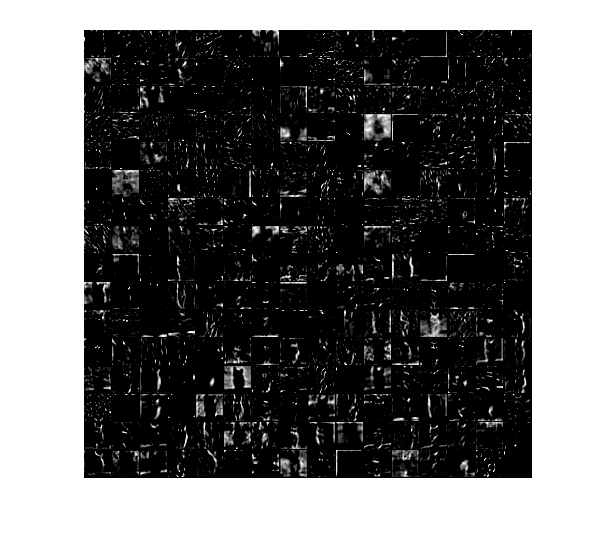
visualize_feature_maps(f2, 1);
fm_conv3 = net.blob_vec(8);
f3 = fm_conv3.get_data();
fprintf('Feature map conv3 size = ');
size(f3)
visualize_feature_maps(f3, 1);
fm_conv4 = net.blob_vec(9);
f4 = fm_conv4.get_data();
fprintf('Feature map conv4 size = ');
size(f4)
visualize_feature_maps(f4, 1);
fm_conv5 = net.blob_vec(10);
f5 = fm_conv5.get_data();
fprintf('Feature map conv5 size = ');
size(f5)
visualize_feature_maps(f5, 1);
visualize_feature_maps.m
function [] = visualize_feature_maps(w, s)
h = max(size(w, 1), size(w, 2));             % Feature map size
g = h + s;
c = size(w, 3);
cv = ceil(sqrt(c)); %朝正无穷方向取整
W = zeros(g * cv, g * cv);

for u = 1:cv
    for v = 1:cv
        tw = zeros(h, h);
        if(((u - 1) * cv + v) <= c)
            tw = w(:,:,(u -1) * cv + v,1)';
            tw = tw - min(min(tw));
            tw = tw / max(max(tw)) * 255;
        end
        W(g * (u - 1) + (1:h), g * (v -1) + (1:h)) = tw;
    end
end
W = uint8(W);
figure;imshow(W);
deploy.ptototxt里有个 input_param { shape: { dim: 10 dim: 3 dim: 227 dim: 227 } },个人理解为原图先resize到256*256,然后在256*256上crop10份,crop_size为227*227,然后输进网络。10张在计算对应标签的时候有个求均值。如果测的是自己的数据集,这个mean_data比较麻烦,需要做成.mat形式调用。
src
label
扫描二维码关注公众号,回复:
148520 查看本文章

conv1 feature maps
conv2 feature maps
2.编译pycaffe,extract_features.exe提取特征,python将提取的特征转换为mat形式,最后再用matlab可视化。
lmdb2mat.py
import lmdb
import feat_helper_pb2
import numpy as np
import scipy.io as sio
import time

def main(argv):
    lmdb_name = sys.argv[1]
    print "%s" % sys.argv[1]
    batch_num = int(sys.argv[2]);
    batch_size = int(sys.argv[3]);
    window_num = batch_num*batch_size;

    start = time.time()
    if 'db' not in locals().keys():
        db = lmdb.open(lmdb_name)
        txn= db.begin()
        cursor = txn.cursor()
        cursor.iternext()
        datum = feat_helper_pb2.Datum()

        keys = []
        values = []
        for key, value in enumerate( cursor.iternext_nodup()):
            keys.append(key)
            values.append(cursor.value())

    ft = np.zeros((window_num, int(sys.argv[4])))
    for im_idx in range(window_num):
        datum.ParseFromString(values[im_idx])
        ft[im_idx, :] = datum.float_data

    print 'time 1: %f' %(time.time() - start)
    sio.savemat(sys.argv[5], {'feats':ft})
    print 'time 2: %f' %(time.time() - start)
    print 'done!'

if __name__ == '__main__':
    import sys
    main(sys.argv)
feat_helper_pb2.py
# Generated by the protocol buffer compiler.  DO NOT EDIT!

from google.protobuf import descriptor
from google.protobuf import message
from google.protobuf import reflection
from google.protobuf import descriptor_pb2
# @@protoc_insertion_point(imports)


DESCRIPTOR = descriptor.FileDescriptor(
  name='datum.proto',
  package='feat_extract',
  serialized_pb='\n\x0b\x64\x61tum.proto\x12\x0c\x66\x65\x61t_extract\"i\n\x05\x44\x61tum\x12\x10\n\x08\x63hannels\x18\x01 \x01(\x05\x12\x0e\n\x06height\x18\x02 \x01(\x05\x12\r\n\x05width\x18\x03 \x01(\x05\x12\x0c\n\x04\x64\x61ta\x18\x04 \x01(\x0c\x12\r\n\x05label\x18\x05 \x01(\x05\x12\x12\n\nfloat_data\x18\x06 \x03(\x02')


_DATUM = descriptor.Descriptor(
  name='Datum',
  full_name='feat_extract.Datum',
  filename=None,
  file=DESCRIPTOR,
  containing_type=None,
  fields=[
    descriptor.FieldDescriptor(
      name='channels', full_name='feat_extract.Datum.channels', index=0,
      number=1, type=5, cpp_type=1, label=1,
      has_default_value=False, default_value=0,
      message_type=None, enum_type=None, containing_type=None,
      is_extension=False, extension_scope=None,
      options=None),
    descriptor.FieldDescriptor(
      name='height', full_name='feat_extract.Datum.height', index=1,
      number=2, type=5, cpp_type=1, label=1,
      has_default_value=False, default_value=0,
      message_type=None, enum_type=None, containing_type=None,
      is_extension=False, extension_scope=None,
      options=None),
    descriptor.FieldDescriptor(
      name='width', full_name='feat_extract.Datum.width', index=2,
      number=3, type=5, cpp_type=1, label=1,
      has_default_value=False, default_value=0,
      message_type=None, enum_type=None, containing_type=None,
      is_extension=False, extension_scope=None,
      options=None),
    descriptor.FieldDescriptor(
      name='data', full_name='feat_extract.Datum.data', index=3,
      number=4, type=12, cpp_type=9, label=1,
      has_default_value=False, default_value="",
      message_type=None, enum_type=None, containing_type=None,
      is_extension=False, extension_scope=None,
      options=None),
    descriptor.FieldDescriptor(
      name='label', full_name='feat_extract.Datum.label', index=4,
      number=5, type=5, cpp_type=1, label=1,
      has_default_value=False, default_value=0,
      message_type=None, enum_type=None, containing_type=None,
      is_extension=False, extension_scope=None,
      options=None),
    descriptor.FieldDescriptor(
      name='float_data', full_name='feat_extract.Datum.float_data', index=5,
      number=6, type=2, cpp_type=6, label=3,
      has_default_value=False, default_value=[],
      message_type=None, enum_type=None, containing_type=None,
      is_extension=False, extension_scope=None,
      options=None),
  ],
  extensions=[
  ],
  nested_types=[],
  enum_types=[
  ],
  options=None,
  is_extendable=False,
  extension_ranges=[],
  serialized_start=29,
  serialized_end=134,
)

DESCRIPTOR.message_types_by_name['Datum'] = _DATUM

class Datum(message.Message):
  __metaclass__ = reflection.GeneratedProtocolMessageType
  DESCRIPTOR = _DATUM

  # @@protoc_insertion_point(class_scope:feat_extract.Datum)

# @@protoc_insertion_point(module_scope)
visualization.m
nsample = 1;
num_output = 96; % fc7

load conv1_features.mat
width = size(feats, 2);
nmap = width / num_output;

for i = 1 : nsample
    feat = feats(i, :);
    feat = reshape(feat, [nmap num_output] );
    figure('name', sprintf('image #%d', i));
    display_network(feat);
end
display_network.m
function [h, array] = display_network(A, opt_normalize, opt_graycolor, cols, opt_colmajor)
% This function visualizes filters in matrix A. Each column of A is a
% filter. We will reshape each column into a square image and visualizes
% on each cell of the visualization panel.
% All other parameters are optional, usually you do not need to worry
% about it.
% opt_normalize: whether we need to normalize the filter so that all of
% them can have similar contrast. Default value is true.
% opt_graycolor: whether we use gray as the heat map. Default is true.
% cols: how many columns are there in the display. Default value is the
% squareroot of the number of columns in A.
% opt_colmajor: you can switch convention to row major for A. In that
% case, each row of A is a filter. Default value is false.
warning off all

if ~exist('opt_normalize', 'var') || isempty(opt_normalize)
    opt_normalize= true;
end

if ~exist('opt_graycolor', 'var') || isempty(opt_graycolor)
    opt_graycolor= true;
end

if ~exist('opt_colmajor', 'var') || isempty(opt_colmajor)
    opt_colmajor = false;
end

% rescale
A = A - mean(A(:));

if opt_graycolor, colormap(gray); end

% compute rows, cols
[L M]=size(A);
sz=sqrt(L);
buf=1;
if ~exist('cols', 'var')
    if floor(sqrt(M))^2 ~= M
        n=ceil(sqrt(M));
        while mod(M, n)~=0 && n<1.2*sqrt(M), n=n+1; end
        m=ceil(M/n);
    else
        n=sqrt(M);
        m=n;
    end
else
    n = cols;
    m = ceil(M/n);
end

array=-ones(buf+m*(sz+buf),buf+n*(sz+buf));

if ~opt_graycolor
    array = 0.1.* array;
end


if ~opt_colmajor
    k=1;
    for i=1:m
        for j=1:n
            if k>M,
                continue;
            end
            clim=max(abs(A(:,k)));
            if opt_normalize
                array(buf+(i-1)*(sz+buf)+(1:sz),buf+(j-1)*(sz+buf)+(1:sz))=reshape(A(:,k),sz,sz)'/clim;
            else
                array(buf+(i-1)*(sz+buf)+(1:sz),buf+(j-1)*(sz+buf)+(1:sz))=reshape(A(:,k),sz,sz)'/max(abs(A(:)));
            end
            k=k+1;
        end
    end
else
    k=1;
    for j=1:n
        for i=1:m
            if k>M,
                continue;
            end
            clim=max(abs(A(:,k)));
            if opt_normalize
                array(buf+(i-1)*(sz+buf)+(1:sz),2*(buf+(j-1)*(sz+buf)+(1:sz)))=reshape(A(:,k),sz,2*sz)'/clim;
            else
                array(buf+(i-1)*(sz+buf)+(1:sz),buf+(j-1)*(sz+buf)+(1:sz))=reshape(A(:,k),sz,sz)';
            end
            k=k+1;
        end
    end
end

if opt_graycolor
    h=imagesc(array,'EraseMode','none',[-1 1]);
else
    h=imagesc(array,'EraseMode','none',[-1 1]);
end
axis image off

drawnow;

warning on all
工具extract_features.exe的几个参数
训练得到的model,训练网络prototxt,想要提取的blob名,保存的特征路径,做特征提取的数据批量数目,数据的类型(lmdb,leveldb),模式(cpu,gpu)
调用lmdb2mat.py的几个参数,extract提取的特征路径,batch个数,batch_size,特征维数(这个可以等报错之后再改,会直接报错并计算出正确的多少维),转化到mat类型的路径。
编写extract.bat
G:
cd G:\caffe-master
SET GLOG_logtostderr=1
set BIN=Build/x64/Release


"%BIN%/extract_features.exe" examples/Planthopper_test/bvlc_reference_caffenet.caffemodel examples/Planthopper_test/imagenet_val.prototxt conv1 examples/Planthopper_test/feature/myconv1 16 lmdb GPU
python examples\Planthopper_test\feature\lmdb2mat.py G:/caffe-master/examples/Planthopper_test/feature/myconv1 16 16 290400 G:/caffe-master/examples/Planthopper_test/feature/conv1_features.mat

pause
imagenet_val.prototxt
name: "CaffeNet"
layer {
  name: "data"
  type: "ImageData"
  top: "data"
  top: "label"
  transform_param {
    mirror: false
    crop_size: 227
  }
  image_data_param {
    source: "examples/images/file_list.txt"
    batch_size: 50
    new_height: 256
    new_width: 256
  }
}
G:/caffe-master/examples/images/cat.jpg 0
最后执行visualization.m,load 转换后的mat文件,设置num_output输出特征图。
想要提取的特征层需要逐层提取。
conv1 feature maps
