在小程序里画图表,uniapp 不想引入 u-charts怎么办,个人还是喜欢用echarts
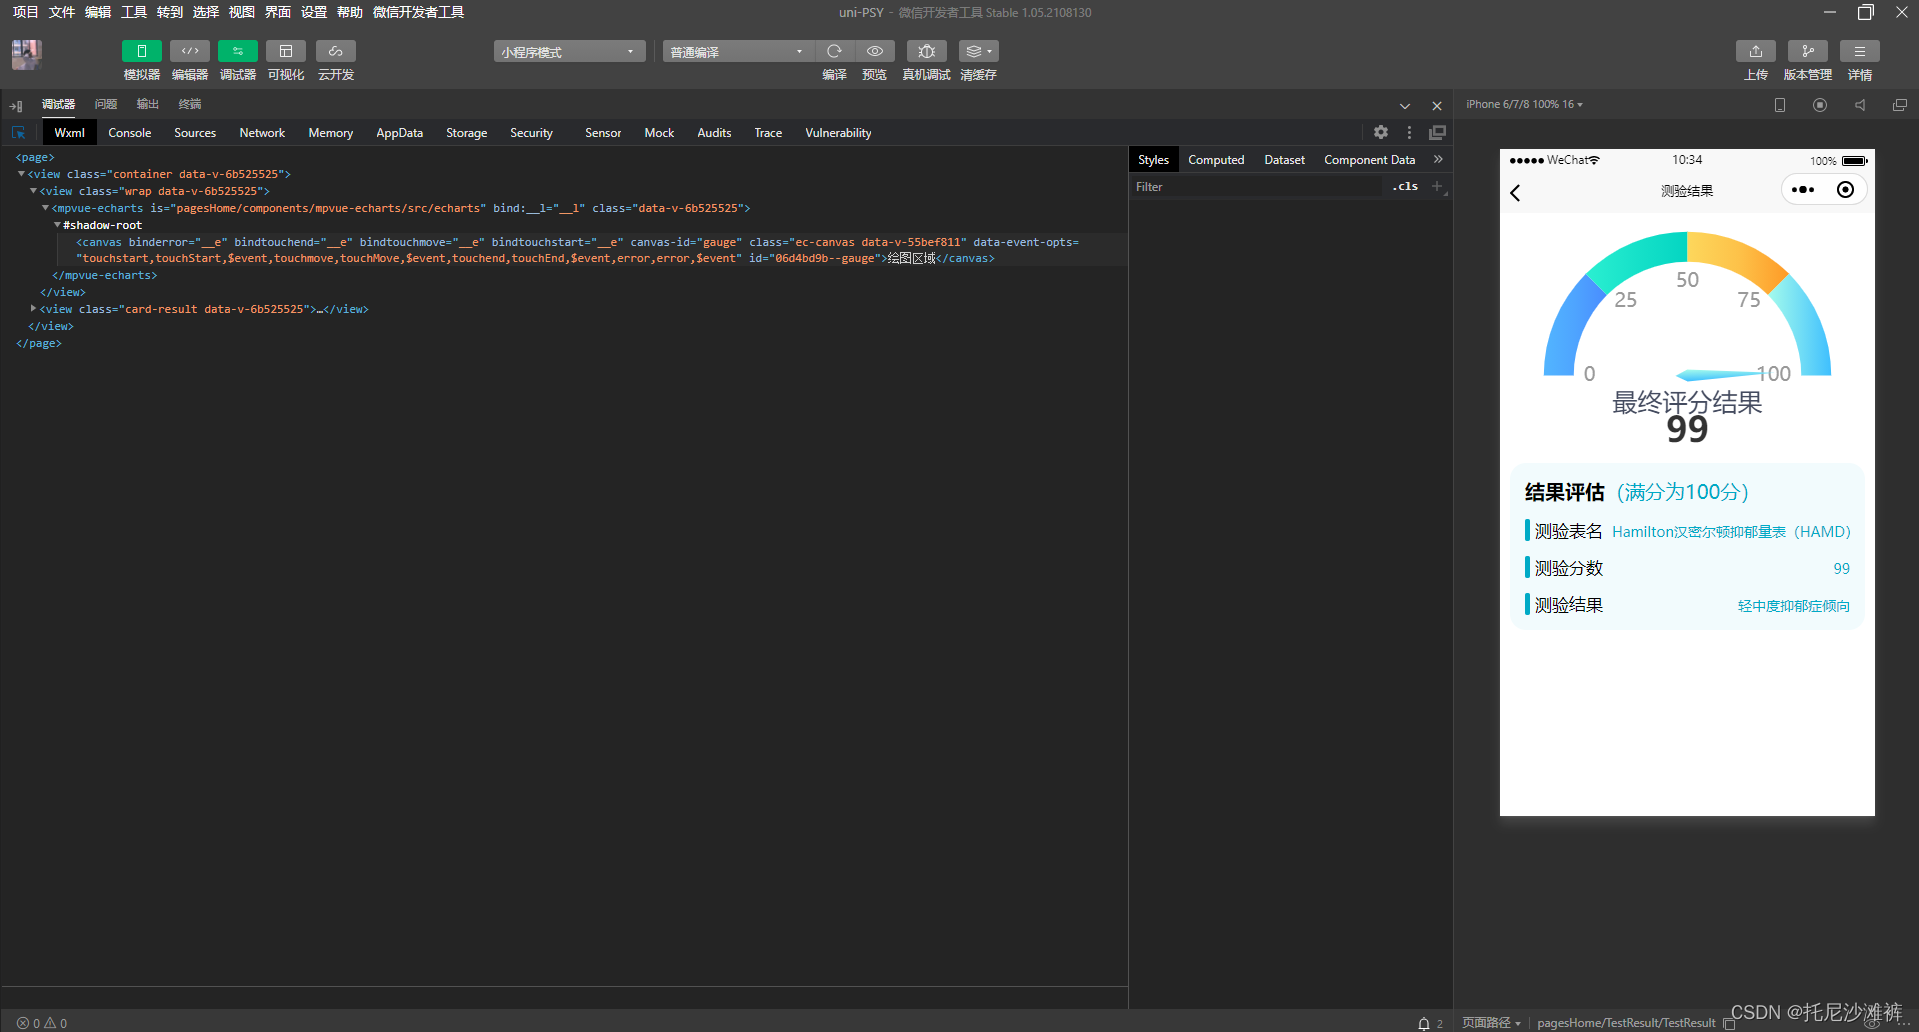
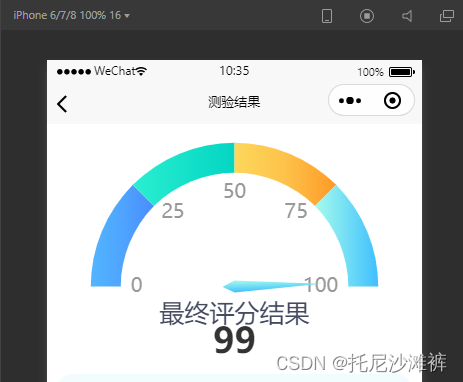
先看成品图
原生小程序使用的是echarts-for-weixin,具体地址如下:
https://github.com/ecomfe/echarts-for-weixin
想在uni项目开发的小程序中使用Echarts太艰辛了,我选择使用mpvue-echarts,踩了一路坑!!!
网上写这个的还不少,常见的两种方法:
- .执行命令(npm install echarts mpvue-echarts),把 node_modules 下生成mpvue-echarts的src文件放到components下,成为自己的组件 (类似文章传送门)
- .mpvue-echarts的官方介绍:https://github.com/F-loat/mpvue-echarts
很巧,我是一个也没用上,各种报错
- 编译错误:Module build failed (from ./node_modules/@dcloudio/webpack-uni-mp-loader/lib/script.js)
- this.echarts.setCanvasCreator is not a function的错误
- e.addEventListener is not a function 报错
- 文件体积超过 500KB,已跳过压缩以及 ES6 转 ES5 的处理,手机端使用过大的js库影响性能
很多教程都说的不是很明白,下面直接上我改进后的步骤:
1、npm install & 定制echarts
- 在package.js里的写echarts的版本号后执行该命令
"dependencies": {


    "echarts": "^5.0.0",
  },
- 或者在线定制echarts.simple.min文件
注意版本号

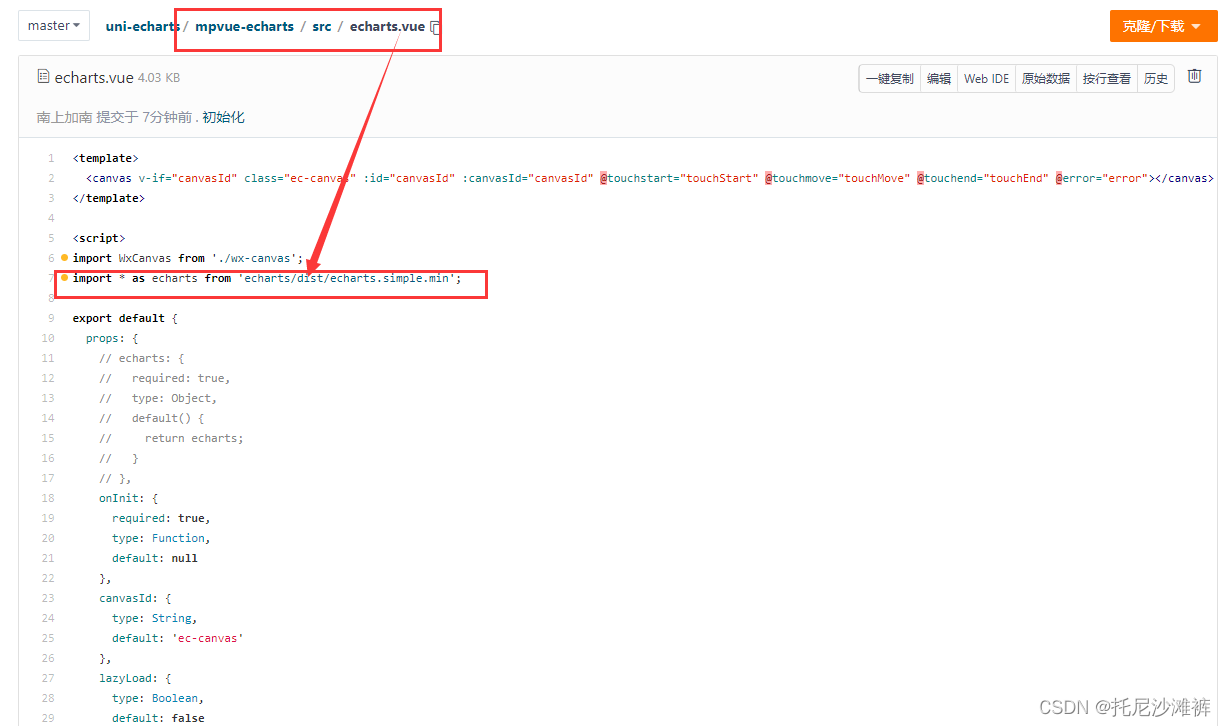
2. 下载组件
下载 mpvue-echarts文件夹,放到主包的components或者分包下的components都可以
值得注意的是,如果你遇到this.echarts.setCanvasCreator is not a function的错误
检查一下需要修改引入方法路径是否正确:下图是通过npm的路径,如果是在线定制的话写你的文件相对路径
- 在vue文件中使用
<template>
  <view class="container">
    <view class="wrap">
      <mpvue-echarts :echarts="echarts" :onInit="onInit" canvasId="gauge" />
    </view>
    <view class="card-result">
      <view class="card-result-h">结果评估 <span>(满分为100分)</span></view>
      <view class="card-result-r">
        <view
          ><span class="car-title">测验表名</span
          ><span class="car-content" style="margin-right: -0.55rem">{

    {


            type_name
          }}</span></view
        >
        <view
          ><span class="car-title">测验分数</span
          ><span class="car-content">{

    {

     score }}</span></view
        >
        <view
          ><span class="car-title">测验结果</span
          ><span class="car-content">{

    {

     judge }}</span></view
        >
      </view>
    </view>
  </view>
</template>

<script>
import * as echarts from "../components/mpvue-echarts/src/echarts.min.js";
import mpvueEcharts from "../components/mpvue-echarts";

let chart = null;
let EScore = null;

function initChart(canvas, width, height) {


  chart = echarts.init(canvas, null, {


    width: width,
    height: height,
  });
  canvas.setChart(chart);

  var option = {


        series: [
          {


            type: 'gauge',
            center: ['50%', '65%'],
            radius: '115%',
            axisLine: {


              lineStyle: {


                width: 30,
                color: [
                  [0.25, (function() {


                    return new echarts.graphic.LinearGradient(0, 0, 1, 0, [{


                      offset: 0,
                      color: '#52B5FF'
                    }, {


                      offset: 0.5,
                      color: '#4EA4FF'
                    }, {


                      offset: 1,
                      color: '#498CFF'
                    }])
                  })()], [0.5, (function() {


                    return new echarts.graphic.LinearGradient(0, 0, 1, 0, [{


                      offset: 0,
                      color: '#2BEFD1'
                    }, {


                      offset: 0.5,
                      color: '#16E1C9'
                    }, {


                      offset: 1,
                      color: '#04D5C2'
                    }])
                  })()],
                  [0.75, (function() {


                    return new echarts.graphic.LinearGradient(0, 0, 1, 0, [{


                      offset: 0,
                      color: '#FDD75C'
                    }, {


                      offset: 0.5,
                      color: '#FDC249'
                    }, {


                      offset: 1,
                      color: '#FE9A27'
                    }])
                  })()],
                  [1, (function() {


                    return new echarts.graphic.LinearGradient(0, 0, 1, 0, [{


                      offset: 0,
                      color: '#A4FBEC'
                    }, {


                      offset: 0.5,
                      color: '#73DEF5'
                    }, {


                      offset: 1,
                      color: '#3FBFFE'
                    }])
                  })()]
                ]
              }
            },
            pointer: {


              itemStyle: {


                color: 'auto'
              }
            },
            axisTick: {


              distance: -30,
              length: 8,
              show: false,
              lineStyle: {


                color: '#fff',
                width: 2
              }
            },
            splitLine: {


              show: false,
              distance: -30,
              length: 30,
              lineStyle: {


                color: '#fff',
                width: 4
              }
            },
            axisLabel: {


              color: '#999',
              distance: 40,
              fontSize: 20
            },
            title: {


              show: true,
              color: '#444B5F',
              fontSize: 25
            },
            startAngle: 180,
            endAngle: 0,
            splitNumber: 4,
            detail: {


              valueAnimation: true,
              formatter: '{value}',
              color: '#333333',
              fontSize: 35
            },
            data: [
              {


                value: EScore,
                name: '最终评分结果'
              }
            ]
          }
        ]

      }
  chart.setOption(option);
  return chart;
}

export default {


  data() {


    return {


      echarts,
      onInit: initChart,
      size: "medium",
      score: "54",
      judge: "轻中度抑郁症倾向",
      type_name: "Hamilton汉密尔顿抑郁量表(HAMD)",
    };
  },

  components: {


    mpvueEcharts,
  },
  onLoad(options) {


    console.log('99',options) // 路由传参
    this.score = options.score,
    EScore = Number(options.score)
  },
  methods: {


  },
};
</script>

<style lang="scss" scoped>
.container {


  background: #ffff;
  min-height: 100vh;
}
.wrap {


  width: 100%;
  height: 250px;
}
.card-result {


  margin: 0 10px;
  padding: 15px;
  background: #f2fbfd;
  border-radius: 1rem;
  text-align: left;
  font-size: 20px;
  &-h {


    span {


      font-weight: 400;
      color: #00aac6;
    }
    font-weight: 600;
  }
  &-r {


    display: flex;
    flex-direction: column;
    view {


      margin-top: 15px;
      display: flex;
      justify-content: space-between;
      align-items: flex-end;
    }
    .car-title {


      font-size: 17px;
      &::before {


        content: "";
        border-left: 0.1rem solid #00aac6;
        border-radius: 1rem;
        margin-right: 5px;
        border-left-width: 5px;
      }
    }
    .car-content {


      font-size: 14px;
      color: #00aac6;
    }
  }
}
</style>
到这里就可以正常展示了
放在最后
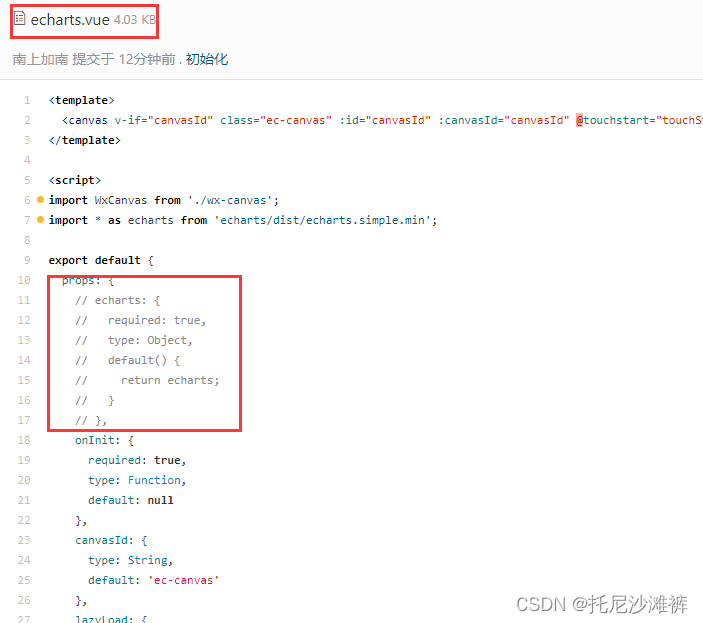
改进的地方主要是拿到组件mpvue-echarts无法接收到prop的echarts,所以改用install后的echarts,当然你也可以去在线定制echarts.simple.min文件,我目前只定制了仪表盘
.完结~欢迎留言