目录:
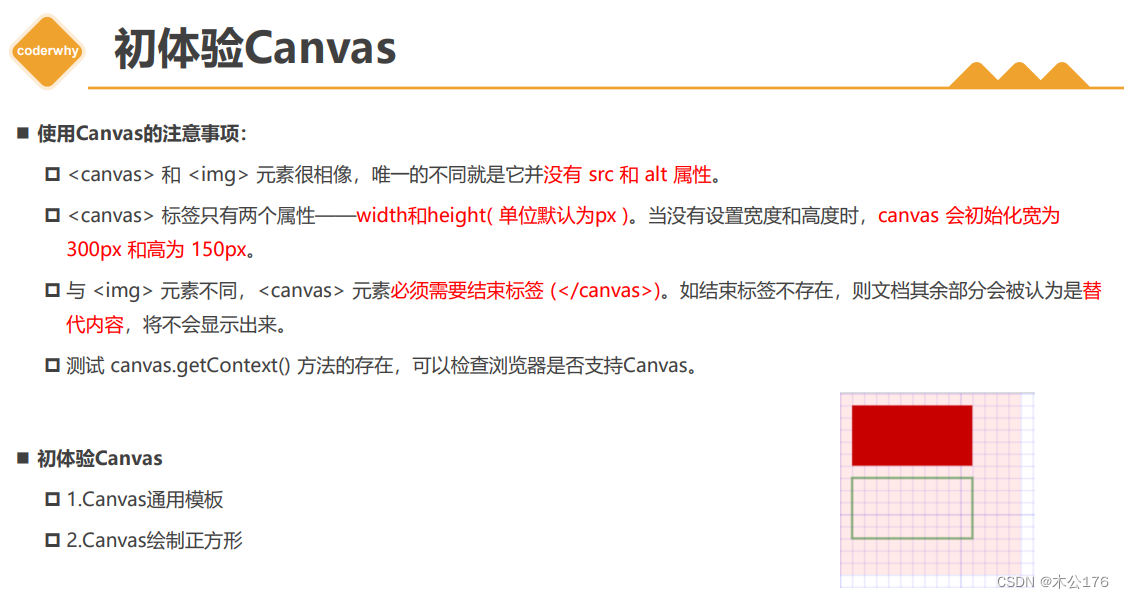
1 邂逅 Canvas
2 Canvas绘制图形
3 Canvas样式和颜色
4 Canvas状态和形变
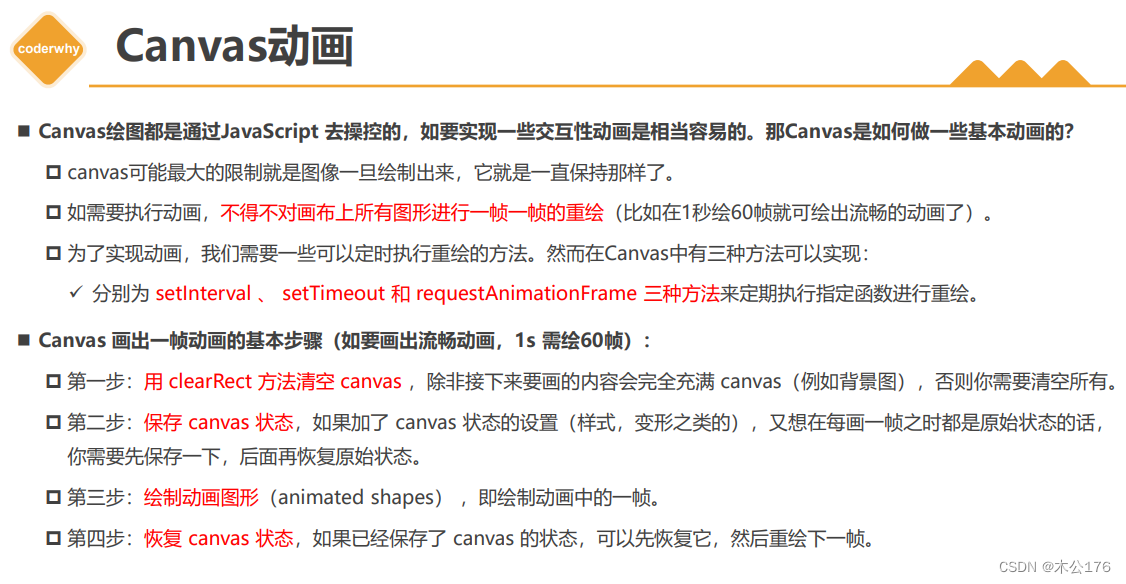
5 Canvas动画和案例
注意点:
*图形使用了xxx。beginPath()之后一定要有stroke()来结束画笔;否则后续画图的原点就是上次结束的地方。
*奇数宽度的线在格子线上的话会很糊,因为线段两边有0.5像素的一半颜色的扩充色。但是放在0.5倍数的格子位置上时候是高清的。同理偶数宽度的也会。
*每次形变(位移,旋转,缩放)之后xy轴都会发生改变(角度或位置),原点也会以为移动而改变。

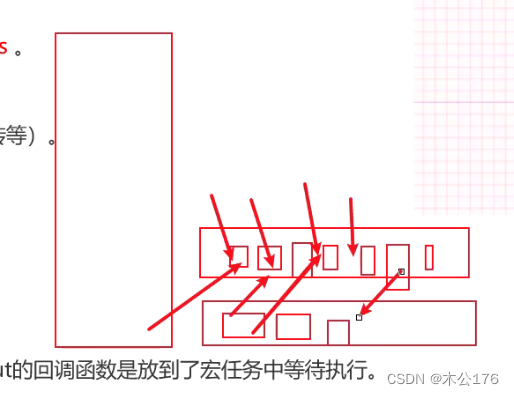
*每次使用形变之前需要save()保存原点位置,通过restore()来恢复原点位置和xy轴方向。
*制作动画使用requestAnimationFrame(函数名)
1、优缺点
2、如何使用
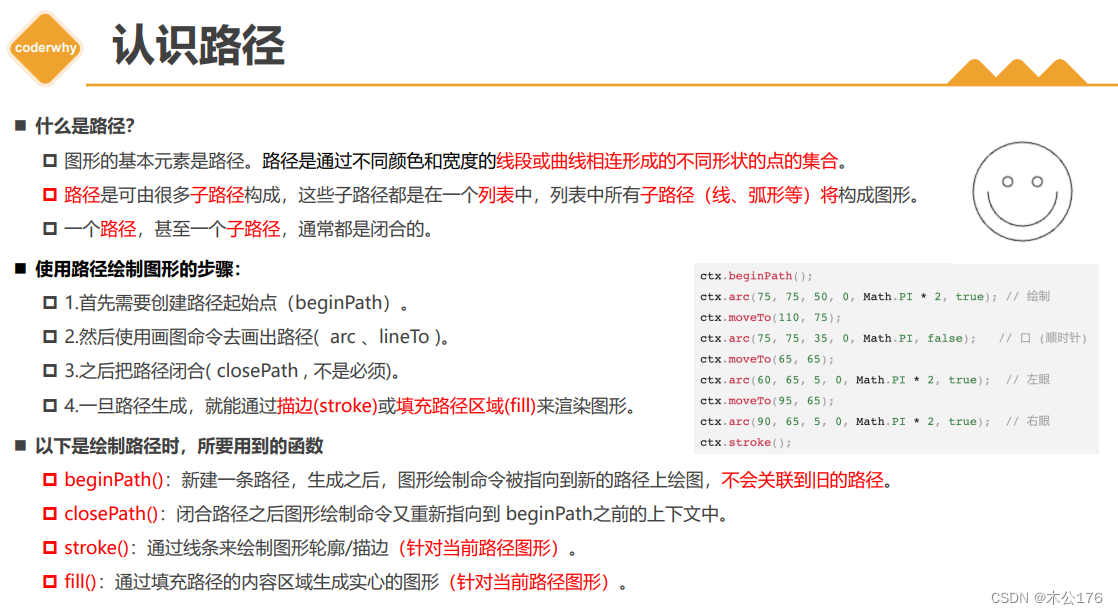
路径方法画图:
必须使用beginPath()的方法创建,否则每次画完都会从结束的地方开始画下一个图形,当画完一系列图形后需要使用xxx.closePath()的方法来结束画笔。不然也是会影响后续画图开始的地址。每次结束beginPath()方法的时候一定要用xxx.stroke来描边。不同的beginPath()方法创建的画笔都需要对应的xxx.stroke()来描边
通用模板:
<!DOCTYPE html>
<html lang="en">
<head>
  <meta charset="UTF-8">
  <meta http-equiv="X-UA-Compatible" content="IE=edge">
  <meta name="viewport" content="width=device-width, initial-scale=1.0">
  <title>Document</title>
  <style>
    canvas{
      background-color: rgba(255, 0, 0, 0.1);
    }
  </style>
</head>
<body>

  <canvas id="tutorial" width="300" height="300px">
    你的浏览器不兼容Canvas,请升级您的浏览器!
  </canvas>

  <script>
    window.onload = function() {
      // 1.拿到canvas的元素对象
      let canvasEl = document.getElementById('tutorial')

      if(!canvasEl.getContext){
        return
      }
      // 2.拿到Canvas渲染的上下文
      // ctx: CanvasRenderingContext2D
      // ctx是一个绘图的上下文: 提供了绘图的指令, 可以绘制各种图形( 圆形 直线 椭圆... )
      let ctx = canvasEl.getContext('2d') // 2d | webgl
      console.log(ctx)
    }
  </script>
</body>
</html>
绘制一个矩形:
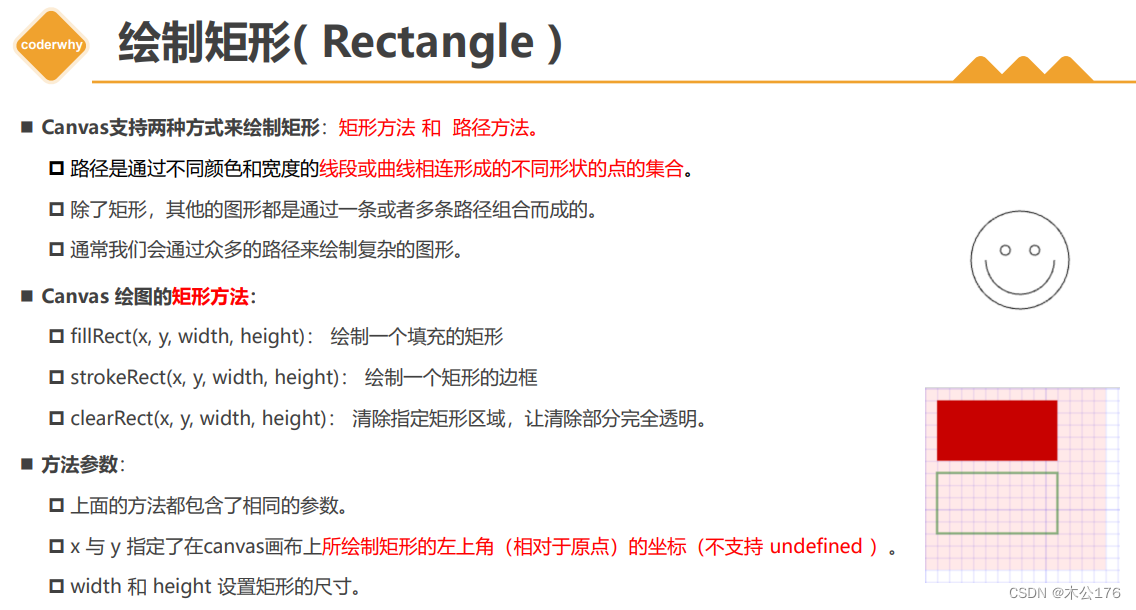
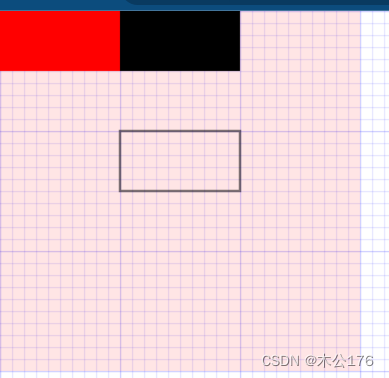
<!DOCTYPE html>
<html lang="en">
<head>
  <meta charset="UTF-8">
  <meta http-equiv="X-UA-Compatible" content="IE=edge">
  <meta name="viewport" content="width=device-width, initial-scale=1.0">
  <title>Document</title>
  <style>
    body{
      margin: 0;
      padding: 0;
      background-image: url(../images/grid.png);
    }
    canvas{
      background-color: rgba(255, 0, 0, 0.1);
    }
  </style>
</head>
<body>

  <canvas id="tutorial" width="300" height="300px">
    你的浏览器不兼容Canvas,请升级您的浏览器!
  </canvas>

  <script>
    window.onload = function() {
      let canvasEl = document.getElementById('tutorial')
      if(!canvasEl.getContext){
        return
      }
      let ctx = canvasEl.getContext('2d') // 2d | webgl

      ctx.fillRect(100,0, 100, 50) // 单位也是不用写 px

       // 1.绘制了一个填充的矩形
      ctx.fillStyle = 'red'
      ctx.fillRect(0, 0, 100, 50)

      // 2.绘制一个边框的矩形
      ctx.strokeRect(100, 100, 100, 50)

      // 3.清除指定区域的矩形
      // ctx.clearRect(0,0, 100, 50)
    }
  </script>
</body>
</html>
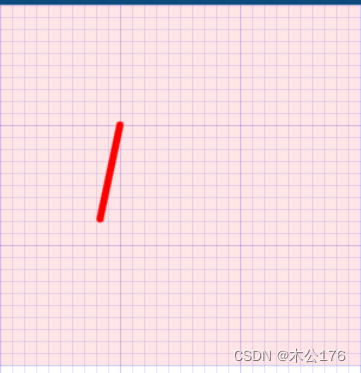
直线路径:
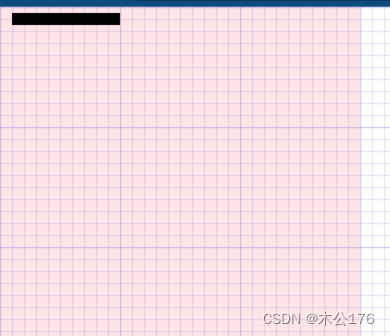
<!DOCTYPE html>
<html lang="en">
<head>
  <meta charset="UTF-8">
  <meta http-equiv="X-UA-Compatible" content="IE=edge">
  <meta name="viewport" content="width=device-width, initial-scale=1.0">
  <title>Document</title>
  <style>
    body{
      margin: 0;
      padding: 0;
      background-image: url(../images/grid.png);
    }
    canvas{
      background-color: rgba(255, 0, 0, 0.1);
    }
  </style>
</head>
<body>

  <canvas id="tutorial" width="300" height="300px">
    你的浏览器不兼容Canvas,请升级您的浏览器!
  </canvas>

  <script>
    window.onload = function() {
      let canvasEl = document.getElementById('tutorial')
      if(!canvasEl.getContext){
        return
      }
      let ctx = canvasEl.getContext('2d') // 2d | webgl

      ctx.lineWidth = 10
      // 1.创建一个新的路径
      ctx.beginPath()
      // 2.使用的绘图的命名(ctx对象中的 属性 和 API)
      ctx.moveTo(10, 10)
      ctx.lineTo(100, 10)
      // 3.闭合路径
      // ctx.closePath() // 不是必须
      // 4.描边或填充
      ctx.stroke()  // 绘制线条只能用 stroke填充,不用 fill

    }
  </script>
</body>
</html>
三角形路径:
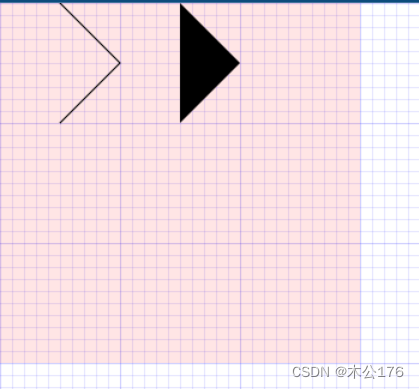
<!DOCTYPE html>
<html lang="en">
<head>
  <meta charset="UTF-8">
  <meta http-equiv="X-UA-Compatible" content="IE=edge">
  <meta name="viewport" content="width=device-width, initial-scale=1.0">
  <title>Document</title>
  <style>
    body{
      margin: 0;
      padding: 0;
      background-image: url(../images/grid.png);
    }
    canvas{
      background-color: rgba(255, 0, 0, 0.1);
    }
  </style>
</head>
<body>

  <canvas id="tutorial" width="300" height="300px">
    你的浏览器不兼容Canvas,请升级您的浏览器!
  </canvas>

  <script>
    window.onload = function() {
      let canvasEl = document.getElementById('tutorial')
      if(!canvasEl.getContext){
        return
      }
      let ctx = canvasEl.getContext('2d') // 2d | webgl

      // 1.描边三角形
      ctx.beginPath()
      ctx.moveTo(50, 0)
      ctx.lineTo(100, 50)
      ctx.lineTo(50, 100)
      // ctx.closePath()
      ctx.stroke()


      // 2.实心的三角形
      ctx.beginPath()
      ctx.moveTo(150, 0)
      ctx.lineTo(200, 50)
      ctx.lineTo(150, 100)
      // ctx.closePath()
      ctx.fill() // 它会 自动闭合路径

    }
  </script>
</body>
</html>
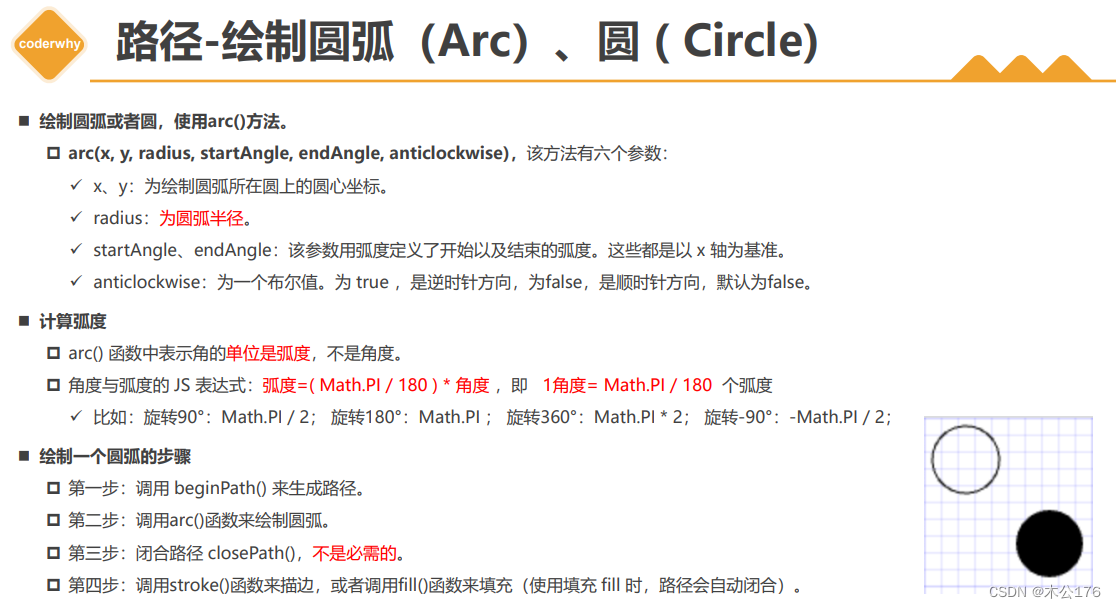
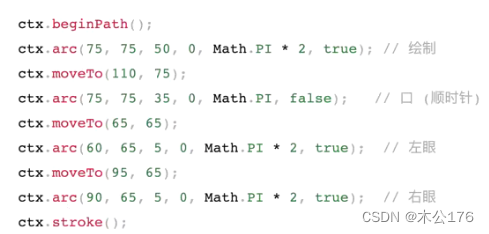
圆形和圆弧路径:
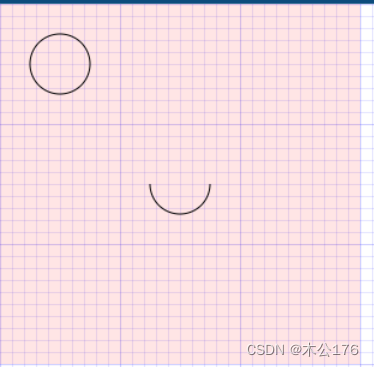
<!DOCTYPE html>
<html lang="en">
<head>
  <meta charset="UTF-8">
  <meta http-equiv="X-UA-Compatible" content="IE=edge">
  <meta name="viewport" content="width=device-width, initial-scale=1.0">
  <title>Document</title>
  <style>
    body{
      margin: 0;
      padding: 0;
      background-image: url(../images/grid.png);
    }
    canvas{
      background-color: rgba(255, 0, 0, 0.1);
    }
  </style>
</head>
<body>

  <canvas id="tutorial" width="300" height="300px">
    你的浏览器不兼容Canvas,请升级您的浏览器!
  </canvas>

  <script>
    window.onload = function() {
      let canvasEl = document.getElementById('tutorial')
      if(!canvasEl.getContext){
        return
      }
      let ctx = canvasEl.getContext('2d') // 2d | webgl

      // 1.每个图形都绘制在一个路径中
      // ctx.beginPath()
      // ctx.arc(50, 50, 25, 0, Math.PI * 2, false)
      // ctx.stroke()

      // ctx.beginPath()
      // ctx.arc(150, 150, 25, 0, Math.PI)
      // ctx.stroke()


      // 2.在一个路径中绘制多个图形
      ctx.beginPath()
      ctx.arc(50, 50, 25, 0, Math.PI * 2, false)
      ctx.moveTo(175, 150)
      ctx.arc(150, 150, 25, 0, Math.PI)
      // ctx.closePath()
      ctx.stroke()

    }
  </script>
</body>
</html>
颜色和样式:
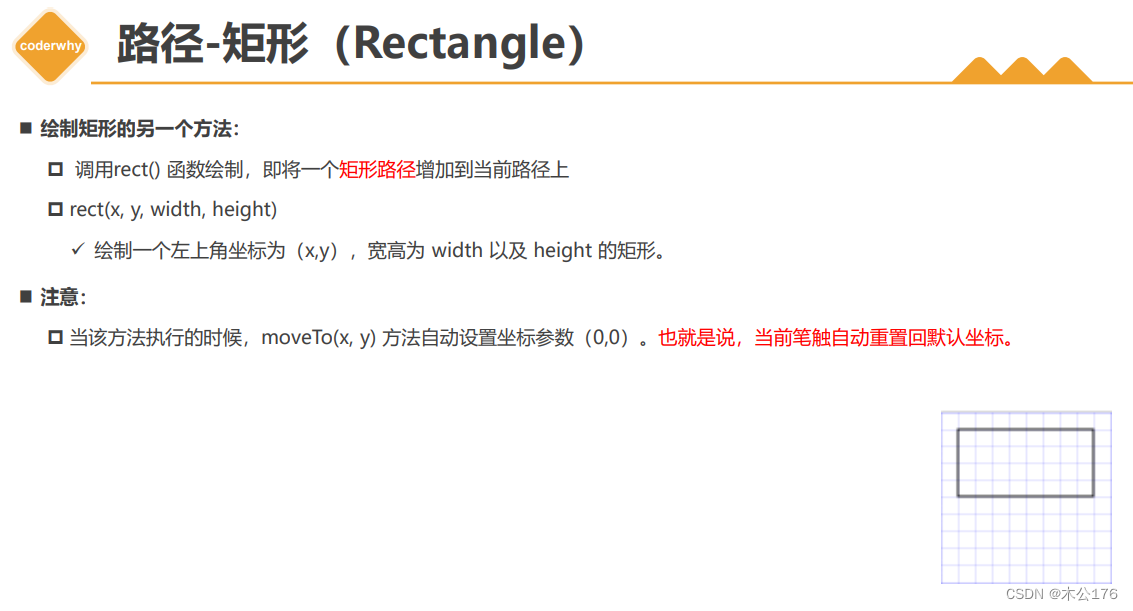
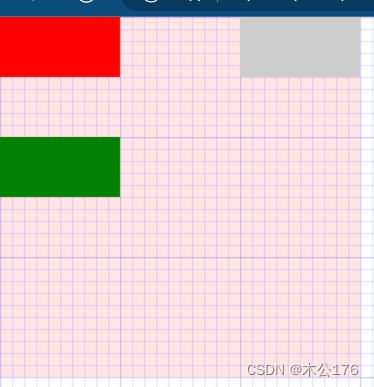
(1)填充颜色--矩形 fillStyle
<!DOCTYPE html>
<html lang="en">
<head>
  <meta charset="UTF-8">
  <meta http-equiv="X-UA-Compatible" content="IE=edge">
  <meta name="viewport" content="width=device-width, initial-scale=1.0">
  <title>Document</title>
  <style>
    body{
      margin: 0;
      padding: 0;
      background-image: url(../images/grid.png);
    }
    canvas{
      background-color: rgba(255, 0, 0, 0.1);
    }
  </style>
</head>
<body>

  <canvas id="tutorial" width="300" height="300px">
    你的浏览器不兼容Canvas,请升级您的浏览器!
  </canvas>

  <script>
    window.onload = function() {
      let canvasEl = document.getElementById('tutorial')
      if(!canvasEl.getContext){
        return
      }
      let ctx = canvasEl.getContext('2d') // 2d | webgl

      // 2.修改画笔的颜色
      ctx.fillStyle = 'red'
      ctx.fillRect(0,0, 100, 50) // 单位也是不用写 px

      ctx.fillStyle = '#cdcdcd'
      ctx.fillRect(200, 0, 100, 50)

      ctx.fillStyle = 'green'
      ctx.beginPath()
      ctx.rect(0, 100, 100, 50)
      ctx.fill()

    }
  </script>
</body>
</html>
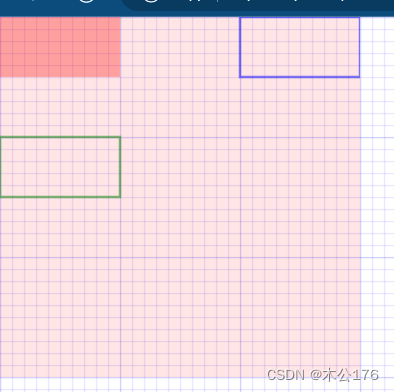
(2)描边颜色: strokeStyle
<!DOCTYPE html>
<html lang="en">
<head>
  <meta charset="UTF-8">
  <meta http-equiv="X-UA-Compatible" content="IE=edge">
  <meta name="viewport" content="width=device-width, initial-scale=1.0">
  <title>Document</title>
  <style>
    body{
      margin: 0;
      padding: 0;
      background-image: url(../images/grid.png);
    }
    canvas{
      background-color: rgba(255, 0, 0, 0.1);
    }
  </style>
</head>
<body>

  <canvas id="tutorial" width="300" height="300px">
    你的浏览器不兼容Canvas,请升级您的浏览器!
  </canvas>

  <script>
    window.onload = function() {
      let canvasEl = document.getElementById('tutorial')
      if(!canvasEl.getContext){
        return
      }
      let ctx = canvasEl.getContext('2d') // 2d | webgl

      // 2.修改画笔的颜色
      ctx.fillStyle = 'rgba(255, 0, 0, 0.3)'
      ctx.fillRect(0,0, 100, 50) // 单位也是不用写 px

      ctx.strokeStyle = 'blue'
      ctx.strokeRect(200, 0, 100, 50)

      ctx.strokeStyle = 'green' // 关键字, 十六进制, rbg , rgba
      ctx.beginPath()
      ctx.rect(0, 100, 100, 50)
      ctx.stroke()

    }
  </script>
</body>
</html>
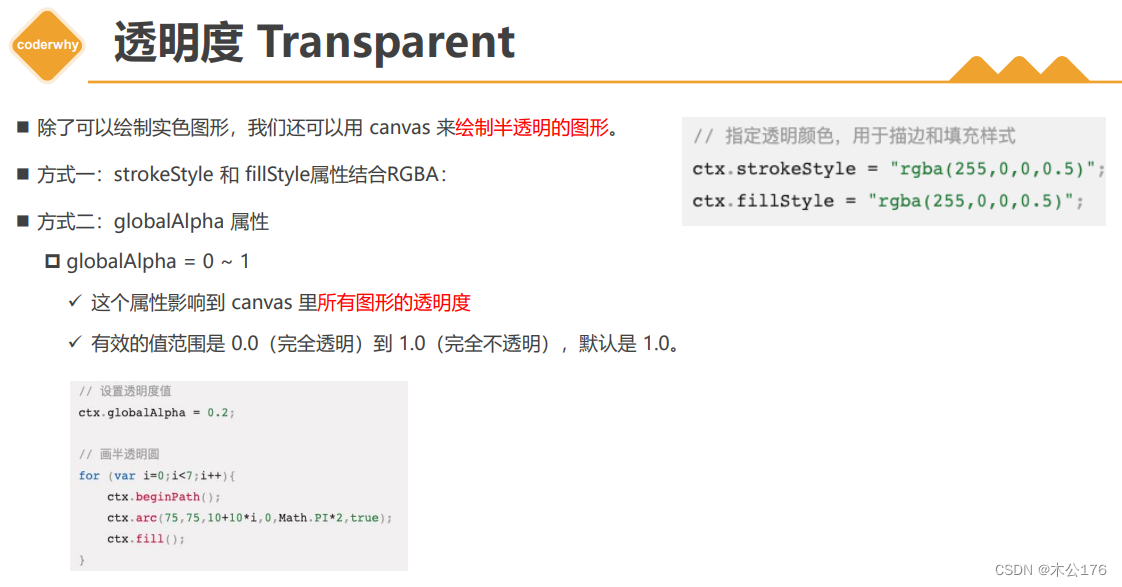
(3)填充颜色的透明度 globalAlpha
<!DOCTYPE html>
<html lang="en">
<head>
  <meta charset="UTF-8">
  <meta http-equiv="X-UA-Compatible" content="IE=edge">
  <meta name="viewport" content="width=device-width, initial-scale=1.0">
  <title>Document</title>
  <style>
    body{
      margin: 0;
      padding: 0;
      background-image: url(../images/grid.png);
    }
    canvas{
      background-color: rgba(255, 0, 0, 0.1);
    }
  </style>
</head>
<body>

  <canvas id="tutorial" width="300" height="300px">
    你的浏览器不兼容Canvas,请升级您的浏览器!
  </canvas>

  <script>
    window.onload = function() {
      let canvasEl = document.getElementById('tutorial')
      if(!canvasEl.getContext){
        return
      }
      let ctx = canvasEl.getContext('2d') // 2d | webgl

      // 针对于Canvas中所有的图形生效
      ctx.globalAlpha = 0.3

      // 2.修改画笔的颜色
      // ctx.fillStyle = 'rgba(255, 0, 0, 0.3)'
      ctx.fillRect(0,0, 100, 50) // 单位也是不用写 px

      ctx.fillStyle = 'blue'
      ctx.fillRect(200, 0, 100, 50)

      ctx.fillStyle = 'green' // 关键字, 十六进制, rbg , rgba
      ctx.beginPath()
      ctx.rect(0, 100, 100, 50)
      ctx.fill()

    }
  </script>
</body>
</html>
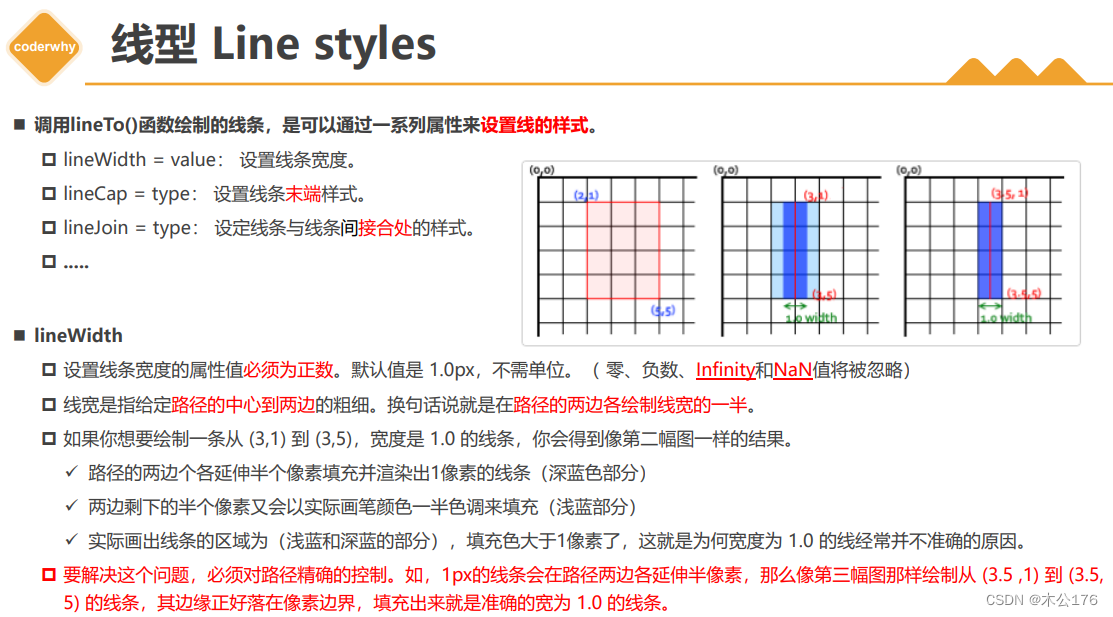
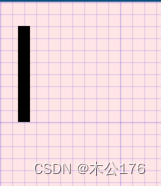
(4)绘制线宽 lineWidth
<!DOCTYPE html>
<html lang="en">
<head>
  <meta charset="UTF-8">
  <meta http-equiv="X-UA-Compatible" content="IE=edge">
  <meta name="viewport" content="width=device-width, initial-scale=1.0">
  <title>Document</title>
  <style>
    body{
      margin: 0;
      padding: 0;
      background-image: url(../images/grid.png);
    }
    canvas{
      background-color: rgba(255, 0, 0, 0.1);
    }
  </style>
</head>
<body>

  <canvas id="tutorial" width="300" height="300px">
    你的浏览器不兼容Canvas,请升级您的浏览器!
  </canvas>

  <script>
    window.onload = function() {
      let canvasEl = document.getElementById('tutorial')
      if(!canvasEl.getContext){
        return
      }
      let ctx = canvasEl.getContext('2d') // 2d | webgl

      // ctx.lineWidth = 1

      // ctx.beginPath()
      // ctx.moveTo(20.5, 20)
      // ctx.lineTo(20.5, 100)
      // ctx.stroke()

      //绘制线的时候,如果你把奇数线宽的线的中心点放到格子线上,会出现模糊的情况
      //只是因为该线段两边都有0.5像素的颜色一般的填充色
      //把奇数的线段放到xx.5的位置上的时候就不会出现什么的情况,线会变得很清晰
      //偶数宽度的线


      ctx.lineWidth = 2

      ctx.beginPath()
      ctx.moveTo(20, 20)
      ctx.lineTo(20, 100)
      ctx.stroke()


    }
  </script>
</body>
</html>
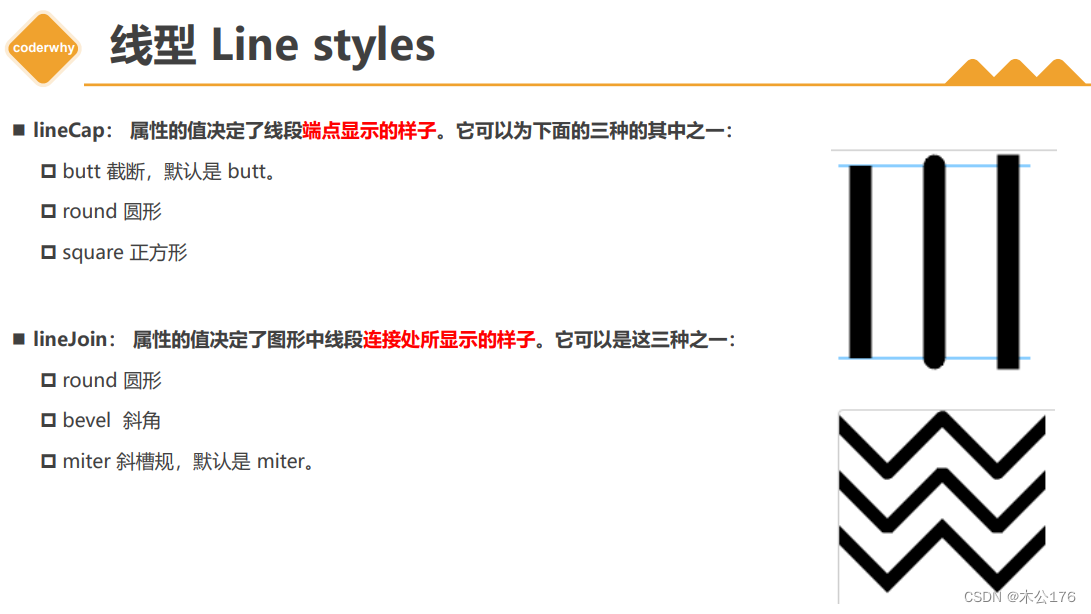
(5)线端点的样式 lineCap
<!DOCTYPE html>
<html lang="en">
<head>
  <meta charset="UTF-8">
  <meta http-equiv="X-UA-Compatible" content="IE=edge">
  <meta name="viewport" content="width=device-width, initial-scale=1.0">
  <title>Document</title>
  <style>
    body{
      margin: 0;
      padding: 0;
      background-image: url(../images/grid.png);
    }
    canvas{
      background-color: rgba(255, 0, 0, 0.1);
    }
  </style>
</head>
<body>

  <canvas id="tutorial" width="300" height="300px">
    你的浏览器不兼容Canvas,请升级您的浏览器!
  </canvas>

  <script>
    window.onload = function() {
      let canvasEl = document.getElementById('tutorial')
      if(!canvasEl.getContext){
        return
      }
      let ctx = canvasEl.getContext('2d') // 2d | webgl


      ctx.lineWidth = 10
      // 改变线端点样式
      ctx.lineCap = 'butt'// butt round square

      ctx.beginPath()
      ctx.moveTo(20, 20)
      ctx.lineTo(20, 100)
      ctx.stroke()


    }
  </script>
</body>
</html>
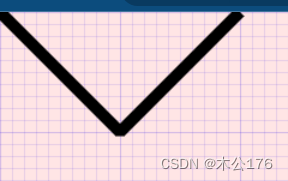
(6)线段连接处的样式:lineJoin
<!DOCTYPE html>
<html lang="en">
<head>
  <meta charset="UTF-8">
  <meta http-equiv="X-UA-Compatible" content="IE=edge">
  <meta name="viewport" content="width=device-width, initial-scale=1.0">
  <title>Document</title>
  <style>
    body{
      margin: 0;
      padding: 0;
      background-image: url(../images/grid.png);
    }
    canvas{
      background-color: rgba(255, 0, 0, 0.1);
    }
  </style>
</head>
<body>

  <canvas id="tutorial" width="300" height="300px">
    你的浏览器不兼容Canvas,请升级您的浏览器!
  </canvas>

  <script>
    window.onload = function() {
      let canvasEl = document.getElementById('tutorial')
      if(!canvasEl.getContext){
        return
      }
      let ctx = canvasEl.getContext('2d') // 2d | webgl


      ctx.lineWidth = 10
      ctx.lineCap = 'butt' // butt round square
      ctx.lineJoin = 'bevel' // miter  round  bevel

      ctx.beginPath()
      ctx.moveTo(0, 0)
      ctx.lineTo(100, 100)
      ctx.lineTo(200, 0)
      ctx.stroke()


    }
  </script>
</body>
</html>
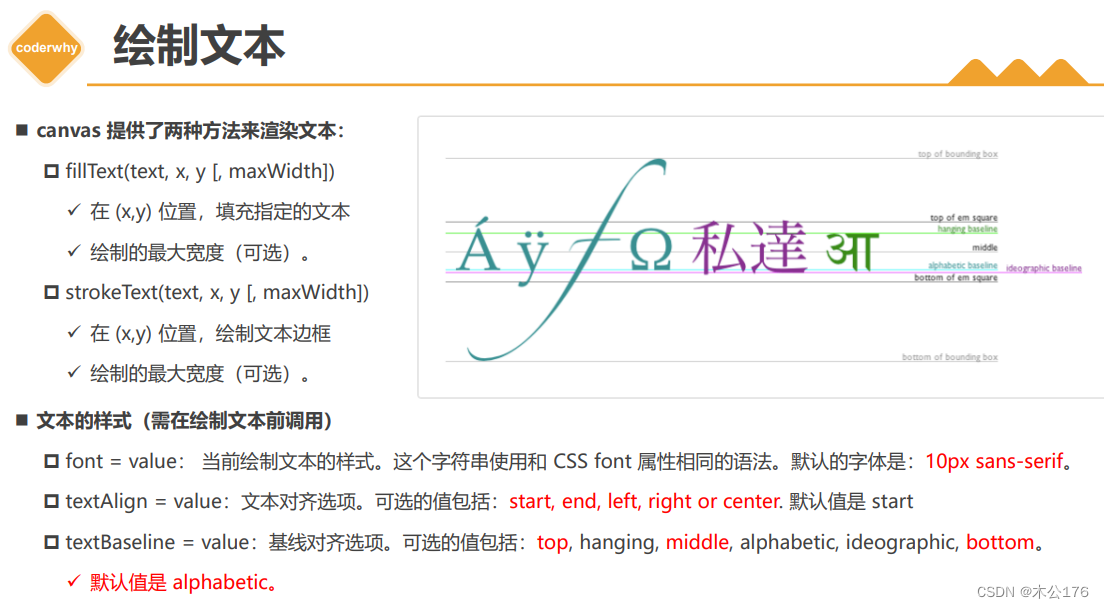
绘制字体和图片:
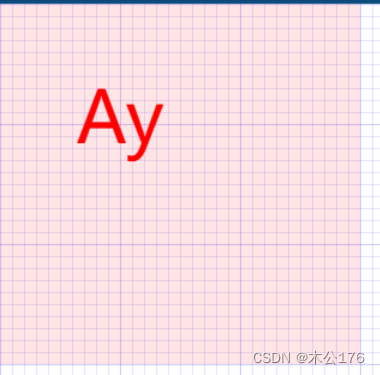
(1)字体
<!DOCTYPE html>
<html lang="en">
<head>
  <meta charset="UTF-8">
  <meta http-equiv="X-UA-Compatible" content="IE=edge">
  <meta name="viewport" content="width=device-width, initial-scale=1.0">
  <title>Document</title>
  <style>
    body{
      margin: 0;
      padding: 0;
      background-image: url(../images/grid.png);
    }
    canvas{
      background-color: rgba(255, 0, 0, 0.1);
    }
  </style>
</head>
<body>

  <canvas id="tutorial" width="300" height="300px">
    你的浏览器不兼容Canvas,请升级您的浏览器!
  </canvas>

  <script>
    window.onload = function() {
      let canvasEl = document.getElementById('tutorial')
      if(!canvasEl.getContext){
        return
      }
      let ctx = canvasEl.getContext('2d') // 2d | webgl

      ctx.font = '60px sen-serif'
      ctx.textAlign = 'center'
      ctx.textBaseline = 'middle'
      ctx.strokeStyle ="red"
      ctx.fillStyle ="red"

      // 将字体绘制在 100, 100 这个坐标点
      ctx.fillText('Ay', 100, 100)
      // ctx.strokeText('Ay', 100, 100)
    }
  </script>
</body>
</html>
(2)图片
<!DOCTYPE html>
<html lang="en">
<head>
  <meta charset="UTF-8">
  <meta http-equiv="X-UA-Compatible" content="IE=edge">
  <meta name="viewport" content="width=device-width, initial-scale=1.0">
  <title>Document</title>
  <style>
    body{
      margin: 0;
      padding: 0;
      background-image: url(../images/grid.png);
    }
    canvas{
      background-color: rgba(255, 0, 0, 0.1);
    }
  </style>
</head>
<body>

  <canvas id="tutorial" width="300" height="300">
    你的浏览器不兼容Canvas,请升级您的浏览器!
  </canvas>

  <script>
    window.onload = function() {
      let canvasEl = document.getElementById('tutorial')
      if(!canvasEl.getContext){
        return
      }
      let ctx = canvasEl.getContext('2d') // 2d | webgl

      // 1.准备一张图片
      var image = new Image()
      image.src = '../images/backdrop.png'

      image.onload = function() {
        // 2.开始用Canvas来绘制图片
        ctx.drawImage(image, 0, 0, 180, 130)

        // 3.绘制折线
        ctx.beginPath()
        ctx.moveTo(40, 100)
        ctx.lineTo(50, 70)
        ctx.lineTo(60, 90)
        ctx.lineTo(100, 30)
        ctx.lineTo(170, 90)
        ctx.stroke()
      }


    }
  </script>
</body>
</html>
绘制折线图的时候,需要把图片放在线段代码行的前面,否则线段会被覆盖。


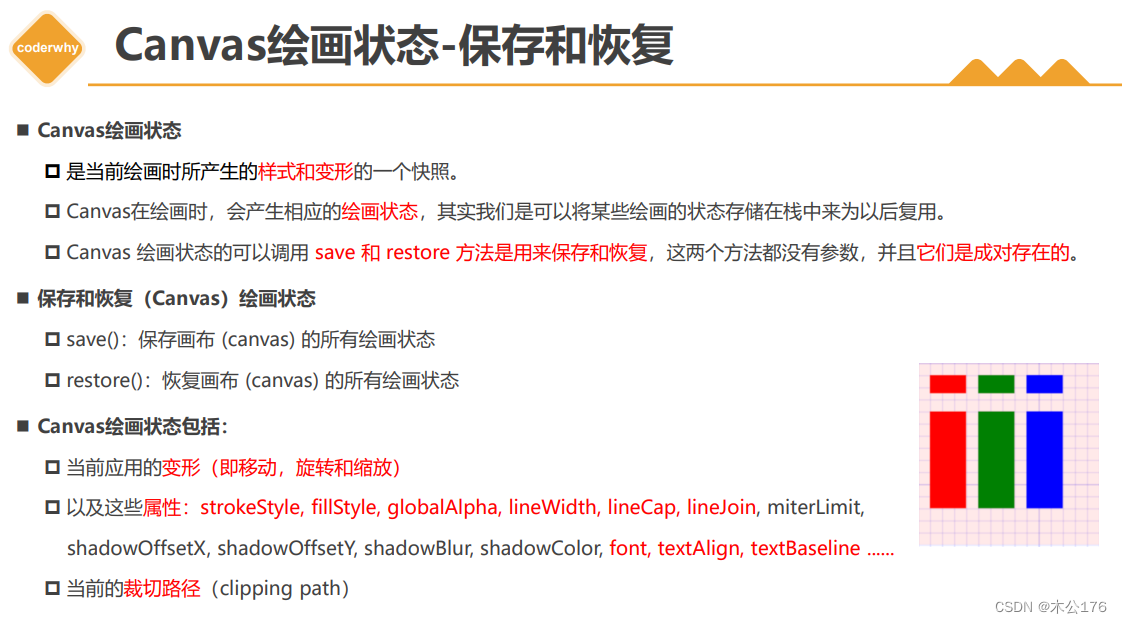
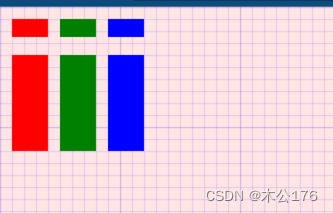
要做形变的时候,最好要save()坐标原点的位置,以方便之后的操作不会因为形变原点改变到哪里都不知道。
<!DOCTYPE html>
<html lang="en">
<head>
  <meta charset="UTF-8">
  <meta http-equiv="X-UA-Compatible" content="IE=edge">
  <meta name="viewport" content="width=device-width, initial-scale=1.0">
  <title>Document</title>
  <style>
    body{
      margin: 0;
      padding: 0;
      background-image: url(../images/grid.png);
    }
    canvas{
      background-color: rgba(255, 0, 0, 0.1);
    }
  </style>
</head>
<body>

  <canvas id="tutorial" width="300" height="300px">
    你的浏览器不兼容Canvas,请升级您的浏览器!
  </canvas>

  <script>
    window.onload = function() {
      let canvasEl = document.getElementById('tutorial')
      if(!canvasEl.getContext){
        return
      }
      let ctx = canvasEl.getContext('2d') // 2d | webgl


      //没有保存状态
      /*ctx.fillStyle ='red'
      // ....
      ctx.fillRect(10, 10, 30, 15)

      ctx.fillStyle = 'green'
      ctx.fillRect(50, 10, 30, 15)

      ctx.fillStyle = 'blue'
      ctx.fillRect(90, 10, 30, 15)

      ctx.fillStyle = 'blue'
      ctx.fillRect(90, 40, 30, 80)

      ctx.fillStyle = 'green'
      ctx.fillRect(50, 40, 30, 80)

      ctx.fillStyle = 'red'
      ctx.fillRect(10, 40, 30, 80)*/


      //保存了状态的
       ctx.fillStyle ='red'
      ctx.fillRect(10, 10, 30, 15)
      ctx.save()

      ctx.fillStyle = 'green'
      ctx.fillRect(50, 10, 30, 15)
      ctx.save()

      ctx.fillStyle = 'blue'
      ctx.fillRect(90, 10, 30, 15)
      ctx.save()

      ctx.restore() // blue
      // ctx.fillStyle = 'blue'
      ctx.fillRect(90, 40, 30, 80)

      ctx.restore() // green
      // ctx.fillStyle = 'green'
      ctx.fillRect(50, 40, 30, 80)

      ctx.restore() // red
      // ctx.fillStyle = 'red'
      ctx.fillRect(10, 40, 30, 80)

    }
  </script>
</body>
</html>
各种形变操作一定要放在绘制的命令前面才能生效。比如平移和形变的方法放在restore()前面。
(1)平移的形变 translate
<!DOCTYPE html>
<html lang="en">
<head>
  <meta charset="UTF-8">
  <meta http-equiv="X-UA-Compatible" content="IE=edge">
  <meta name="viewport" content="width=device-width, initial-scale=1.0">
  <title>Document</title>
  <style>
    body{
      margin: 0;
      padding: 0;
      background-image: url(../images/grid.png);
    }
    canvas{
      background-color: rgba(255, 0, 0, 0.1);
    }
  </style>
</head>
<body>

  <canvas id="tutorial" width="300" height="300px">
    你的浏览器不兼容Canvas,请升级您的浏览器!
  </canvas>

  <script>
    window.onload = function() {
      let canvasEl = document.getElementById('tutorial')
      if(!canvasEl.getContext){
        return
      }
      let ctx = canvasEl.getContext('2d') // 2d | webgl


      // 1.形变( 没有保存状态)
      // ctx.translate(100, 100)
      // ctx.fillRect(0,0, 100, 50) // 单位也是不用写 px

      // ctx.translate(100, 100)
      // ctx.strokeRect(0, 0, 100, 50)


      // 1.形变(保存形变之前的状态)
      ctx.save()
      ctx.translate(100, 100)
      ctx.fillRect(0,0, 100, 50) // 单位也是不用写 px
      ctx.restore() // 恢复了形变之前的状态( 0,0)

      ctx.save() // (保存形变之前的状态)
      ctx.translate(100, 100)
      ctx.fillStyle = 'red'
      ctx.fillRect(0, 0, 50, 30)
      ctx.restore()


    }
  </script>
</body>
</html>
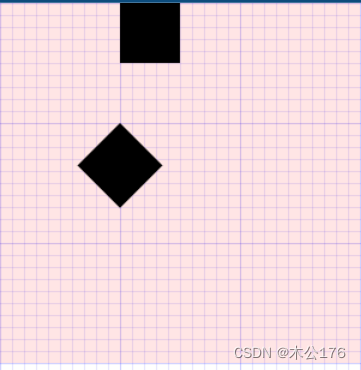
(2)旋转的形变,和css的不一样,这里参数是弧度。rotate
<!DOCTYPE html>
<html lang="en">
<head>
  <meta charset="UTF-8">
  <meta http-equiv="X-UA-Compatible" content="IE=edge">
  <meta name="viewport" content="width=device-width, initial-scale=1.0">
  <title>Document</title>
  <style>
    body{
      margin: 0;
      padding: 0;
      background-image: url(../images/grid.png);
    }
    canvas{
      background-color: rgba(255, 0, 0, 0.1);
    }
  </style>
</head>
<body>

  <canvas id="tutorial" width="300" height="300px">
    你的浏览器不兼容Canvas,请升级您的浏览器!
  </canvas>

  <script>
    window.onload = function() {
      let canvasEl = document.getElementById('tutorial')
      if(!canvasEl.getContext){
        return
      }
      let ctx = canvasEl.getContext('2d') // 2d | webgl


      // 保存形变之前的状态
      ctx.save()
      // 1.形变
      ctx.translate(100, 100)
      // 360 -> Math.PI * 2 一整个圆的弧度
      // 180 -> Math.PI
      // 1 -> Math.PI / 180
      // 45 -> Math.PI / 180 * 45
      ctx.rotate(Math.PI / 180 * 45)
      ctx.fillRect(0, 0, 50, 50)

      // ctx.translate(100, 0)
      // ctx.fillRect(0, 0, 50, 50)
      // 绘图结束(恢复形变之前的状态)
      ctx.restore()


      ctx.save()
      ctx.translate(100, 0)
      ctx.fillRect(0, 0, 50, 50)
      ctx.restore()

      // ....下面在继续写代码的话,坐标轴就是参照的是原点了
    }
  </script>
</body>
</html>
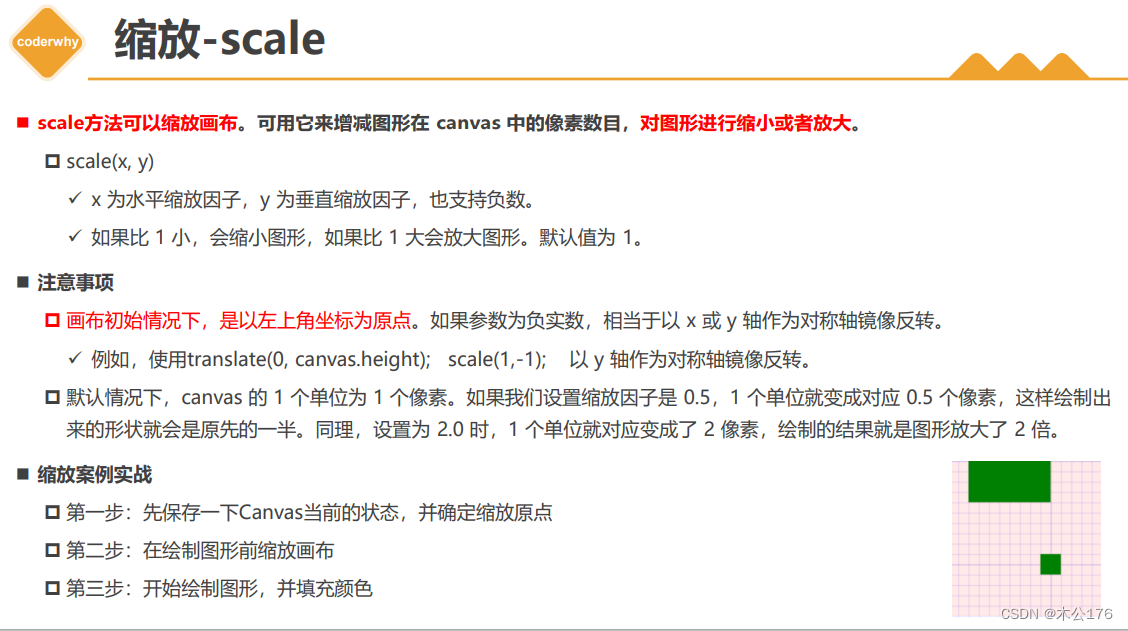
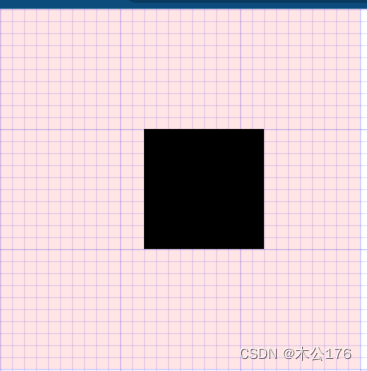
(3)缩放,平移的距离会受缩放的影响,缩放扩大2倍,平移10相当于20. scale
<!DOCTYPE html>
<html lang="en">
<head>
  <meta charset="UTF-8">
  <meta http-equiv="X-UA-Compatible" content="IE=edge">
  <meta name="viewport" content="width=device-width, initial-scale=1.0">
  <title>Document</title>
  <style>
    body{
      margin: 0;
      padding: 0;
      background-image: url(../images/grid.png);
    }
    canvas{
      background-color: rgba(255, 0, 0, 0.1);
    }
  </style>
</head>
<body>

  <canvas id="tutorial" width="300" height="300px">
    你的浏览器不兼容Canvas,请升级您的浏览器!
  </canvas>

  <script>
    window.onload = function() {
      let canvasEl = document.getElementById('tutorial')
      if(!canvasEl.getContext){
        return
      }
      let ctx = canvasEl.getContext('2d') // 2d | webgl


      // 保存形变之前的状态
      ctx.save()
      // 1.形变
      ctx.translate(100, 100) // 平移坐标系统
      ctx.scale(2, 2) // 对坐标轴进行了放大(2倍)
      ctx.translate(10, 0) // 10px  -> 20px
      ctx.fillRect(0, 0, 50, 50)
      // 绘图结束(恢复形变之前的状态)
      ctx.restore()

      // ....下面在继续写代码的话,坐标轴就是参照的是原点了
    }
  </script>
</body>
</html>

canvas动画
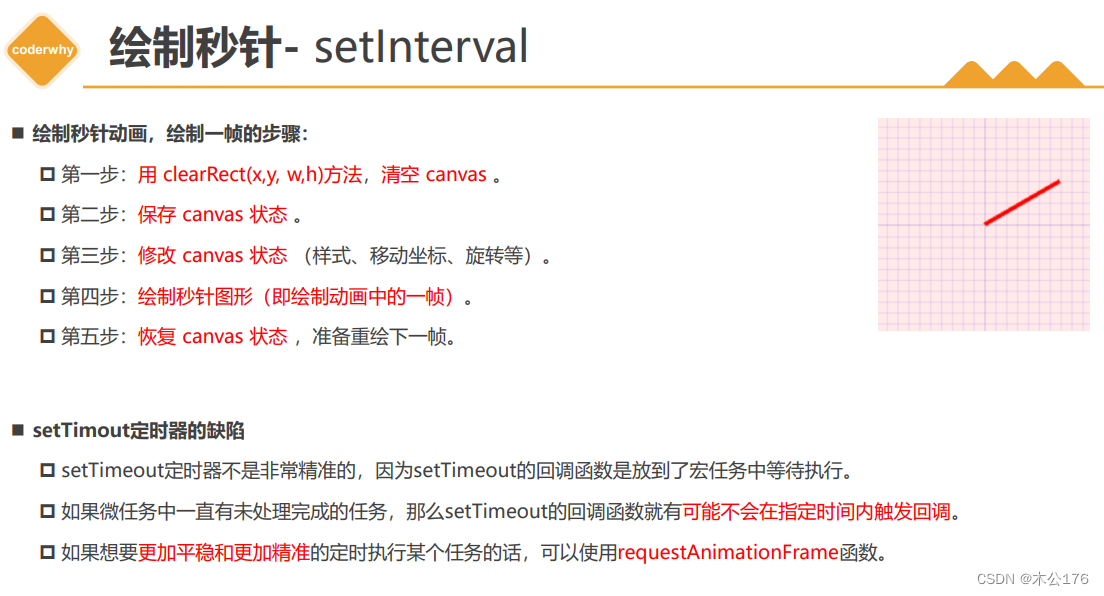
(1)绘制秒针
如果有微任务需要进行,那么浏览器会先执行微任务然后在执行宏任务,所以使用setInterval不精确。
使用requsetAnimationFrame()可以精细到1秒钟60帧,所以做游戏什么的都是用这个。
使用setInterval制作一个时钟指针的代码:
<!DOCTYPE html>
<html lang="en">
<head>
  <meta charset="UTF-8">
  <meta http-equiv="X-UA-Compatible" content="IE=edge">
  <meta name="viewport" content="width=device-width, initial-scale=1.0">
  <title>Document</title>
  <style>
    body{
      margin: 0;
      padding: 0;
      background-image: url(../images/grid.png);
    }
    canvas{
      background-color: rgba(255, 0, 0, 0.1);
    }
  </style>
</head>
<body>

  <canvas id="tutorial" width="300" height="300px">
    你的浏览器不兼容Canvas,请升级您的浏览器!
  </canvas>

  <script>
    window.onload = function() {
      let canvasEl = document.getElementById('tutorial')
      if(!canvasEl.getContext){
        return
      }
      let ctx = canvasEl.getContext('2d') // 2d | webgl
      let count = 0
      draw()


      setInterval(function() {
        draw()
      }, 1000)

      /**
       这个函数就是动画的一帧
      */
      function draw() {
        count ++
        if(count >= 60){
          count = 0
        }
        ctx.clearRect(0, 0, 300, 300)
        ctx.save()

        // 1.开始绘图
        ctx.translate(100, 100)
        // Math.PI * 2   一个圆
        // Math.PI * 2 / 60   一个圆分成 60
        ctx.rotate(Math.PI * 2 / 60 * count)
        ctx.lineWidth = 6
        ctx.lineCap = 'round'
        ctx.strokeStyle = 'red'

        ctx.beginPath()
        ctx.moveTo(0, 0)
        ctx.lineTo(0, -80)
        ctx.stroke()

        ctx.restore()
      }

    }
  </script>
</body>
</html>
使用requestAnimationFrame制作一个时钟的秒针:
<!DOCTYPE html>
<html lang="en">
<head>
  <meta charset="UTF-8">
  <meta http-equiv="X-UA-Compatible" content="IE=edge">
  <meta name="viewport" content="width=device-width, initial-scale=1.0">
  <title>Document</title>
  <style>
    body{
      margin: 0;
      padding: 0;
      background-image: url(../images/grid.png);
    }
    canvas{
      background-color: rgba(255, 0, 0, 0.1);
    }
  </style>
</head>
<body>

  <canvas id="tutorial" width="300" height="300px">
    你的浏览器不兼容Canvas,请升级您的浏览器!
  </canvas>

  <script>
    window.onload = function() {
      let canvasEl = document.getElementById('tutorial')
      if(!canvasEl.getContext){
        return
      }
      let ctx = canvasEl.getContext('2d') // 2d | webgl

      requestAnimationFrame(draw)

      //测一秒执行多少次
      /*
        function draw() {
          let endTime = new Date().getTime()
          if(endTime - startTime > 1000){
            return
          }
          console.log('draw')
          requestAnimationFrame(draw)
        }
      */

      /**
       这个函数就是动画的一帧
       // 现在这个函数在1秒钟会回调 61 次
      */
      function draw() {
        let second = new Date().getSeconds()
        console.log('draw')
        ctx.clearRect(0, 0, 300, 300)
        ctx.save()

        // 1.开始绘图
        ctx.translate(100, 100)
        ctx.rotate(Math.PI * 2 / 60 * second)
        ctx.lineWidth = 6
        ctx.lineCap = 'round'
        ctx.strokeStyle = 'red'

        ctx.beginPath()
        ctx.moveTo(0, 0)
        ctx.lineTo(0, -80)
        ctx.stroke()

        ctx.restore()
        requestAnimationFrame(draw)
      }

    }
  </script>
</body>
</html>
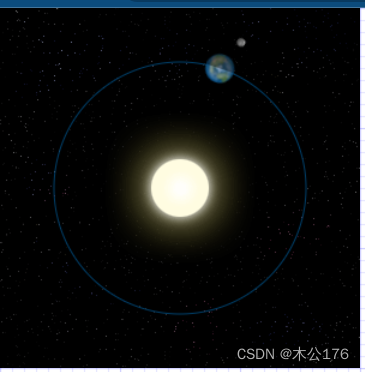
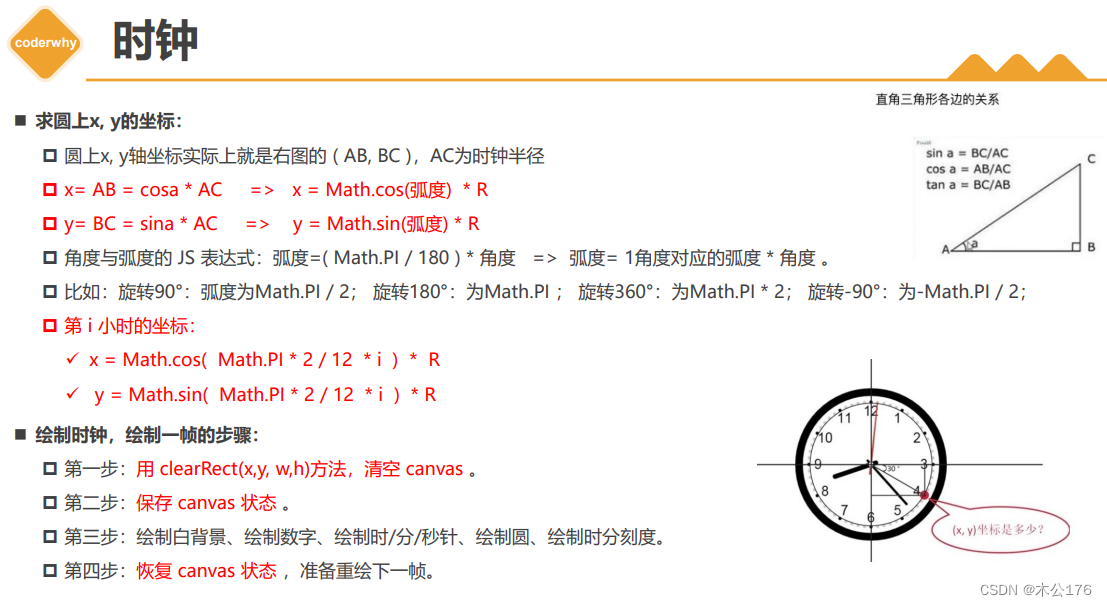
(2)太阳系动画
未封装的代码(没有使用函数来封装):
<!DOCTYPE html>
<html lang="en">
<head>
  <meta charset="UTF-8">
  <meta http-equiv="X-UA-Compatible" content="IE=edge">
  <meta name="viewport" content="width=device-width, initial-scale=1.0">
  <title>Document</title>
  <style>
    body{
      margin: 0;
      padding: 0;
      background-image: url(../../images/grid.png);
    }
    canvas{
      background-color: rgba(255, 0, 0, 0.1);
    }
  </style>
</head>
<body>

  <canvas id="tutorial" width="300" height="300px">
    你的浏览器不兼容Canvas,请升级您的浏览器!
  </canvas>

  <script>
    window.onload = function() {
      let canvasEl = document.getElementById('tutorial')
      if(!canvasEl.getContext){
        return
      }
      let ctx = canvasEl.getContext('2d') // 2d | webgl

      let sun = new Image()
      sun.src = '../../images/canvas_sun.png'
      // sun.onload = function() {
      //   // draw
      // }
      let earth = new Image()
      earth.src = '../../images/canvas_earth.png'
      let moon = new Image()
      moon.src = '../../images/canvas_moon.png'


      requestAnimationFrame(draw)

      /**
       1秒钟会回调 61次
      */
      function draw() {
        console.log('draw')
        ctx.clearRect(0, 0, 300, 300)
        ctx.save()

        // 1.绘制背景
        ctx.save()
        ctx.drawImage(sun, 0, 0) // 背景图
        ctx.translate(150, 150) // 移动坐标
        ctx.strokeStyle = 'rgba(0, 153, 255, 0.4)'
        ctx.beginPath() // 绘制轨道
        ctx.arc(0, 0, 105, 0, Math.PI * 2)
        ctx.stroke()
        ctx.restore()

        // 2.地球
        let time = new Date()
        let second = time.getSeconds()
        let milliseconds = time.getMilliseconds()
        ctx.save() // earth start
        ctx.translate(150, 150) // 中心点坐标系
        // 地球的旋转
        // Math.PI * 2  一整个圆的弧度
        // Math.PI * 2 / 60   分成 60 份
        // Math.PI * 2 / 60   1s
        // Math.PI * 2 / 60 / 1000    1mm

        // 1s 1mm
        // Math.PI * 2 / 60 * second + Math.PI * 2 / 60 / 1000 * milliseconds
        ctx.rotate(
          Math.PI * 2 / 60 * second +
          Math.PI * 2 / 60 / 1000 * milliseconds
        )
        ctx.translate(105, 0) // 圆上的坐标系
        ctx.drawImage(earth, -12, -12)

        // 绘制月球
        ctx.save() // moon start

        // 月球的旋转
        // Math.PI * 2   一圈   360
        // Math.PI * 2 / 10  1s(10s一圈)
        // Math.PI * 2 / 10 * 2  2s(10s一圈)

        // Math.PI * 2 / 10 / 1000  1mm 的弧度

        // 2s + 10mm = 弧度
        //  Math.PI * 2 / 10  * second + Math.PI * 2 / 10 / 1000 * milliseconds

        ctx.rotate(
          Math.PI * 2 / 10  * second +
          Math.PI * 2 / 10 / 1000 * milliseconds
        )
        ctx.translate(0, 28)
        ctx.drawImage(moon, -3.5, -3.5)
        ctx.restore() // moon end

        // 绘制地球的蒙版
        // 这里的坐标系是哪个? 圆上的坐标系
        ctx.save()
        ctx.fillStyle = 'rgba(0, 0, 0, 0.4)'
        ctx.fillRect(0, -12, 40, 24)
        ctx.restore()

        ctx.restore() // earth end


        ctx.restore()
        requestAnimationFrame(draw)
      }

    }
  </script>
</body>
</html>
封装后的代码写法:
<!DOCTYPE html>
<html lang="en">
<head>
  <meta charset="UTF-8">
  <meta http-equiv="X-UA-Compatible" content="IE=edge">
  <meta name="viewport" content="width=device-width, initial-scale=1.0">
  <title>Document</title>
  <style>
    body{
      margin: 0;
      padding: 0;
      background-image: url(../../images/grid.png);
    }
    canvas{
      background-color: rgba(255, 0, 0, 0.1);
    }
  </style>
</head>
<body>

  <canvas id="tutorial" width="300" height="300px">
    你的浏览器不兼容Canvas,请升级您的浏览器!
  </canvas>

  <script>
    window.onload = function() {
      let canvasEl = document.getElementById('tutorial')
      if(!canvasEl.getContext){
        return
      }
      let ctx = canvasEl.getContext('2d') // 2d | webgl

      let sun = new Image()
      sun.src = '../../images/canvas_sun.png'
      // sun.onload = function() {
      //   // draw
      // }
      let earth = new Image()
      earth.src = '../../images/canvas_earth.png'
      let moon = new Image()
      moon.src = '../../images/canvas_moon.png'

      requestAnimationFrame(draw)

      /**
       1秒钟会回调 61次
      */
      function draw() {
        console.log('draw')
        ctx.clearRect(0, 0, 300, 300)
        ctx.save()
        // 1.绘制背景
        drawBg()
        // 2.地球
        drawEarth()
        ctx.restore()
        requestAnimationFrame(draw)
      }

      function drawBg() {
        ctx.save()
        ctx.drawImage(sun, 0, 0) // 背景图
        ctx.translate(150, 150) // 移动坐标
        ctx.strokeStyle = 'rgba(0, 153, 255, 0.4)'
        ctx.beginPath() // 绘制轨道
        ctx.arc(0, 0, 105, 0, Math.PI * 2)
        ctx.stroke()
        ctx.restore()
      }

      function drawEarth() {
        let time = new Date()
        let second = time.getSeconds()
        let milliseconds = time.getMilliseconds()
        ctx.save() // earth start
        ctx.translate(150, 150) // 中心点坐标系
        // 地球的旋转
        // Math.PI * 2  一整个圆的弧度
        // Math.PI * 2 / 60   分成 60 份
        // Math.PI * 2 / 60   1s
        // Math.PI * 2 / 60 / 1000    1mm

        // 1s 1mm
        // Math.PI * 2 / 60 * second + Math.PI * 2 / 60 / 1000 * milliseconds
        ctx.rotate(
          Math.PI * 2 / 60 * second +
          Math.PI * 2 / 60 / 1000 * milliseconds
        )
        ctx.translate(105, 0) // 圆上的坐标系
        ctx.drawImage(earth, -12, -12)
        // 3.绘制月球
        drawMoon(second, milliseconds)
        // 4.绘制地球的蒙版
        drawEarthMask()

        ctx.restore() // earth end
      }

      function drawMoon(second, milliseconds) {
        ctx.save() // moon start
        // 月球的旋转
        // Math.PI * 2   一圈   360
        // Math.PI * 2 / 10  1s(10s一圈)
        // Math.PI * 2 / 10 * 2  2s(10s一圈)

        // Math.PI * 2 / 10 / 1000  1mm 的弧度

        // 2s + 10mm = 弧度
        //  Math.PI * 2 / 10  * second + Math.PI * 2 / 10 / 1000 * milliseconds

        ctx.rotate(
          Math.PI * 2 / 10  * second +
          Math.PI * 2 / 10 / 1000 * milliseconds
        )
        ctx.translate(0, 28)
        ctx.drawImage(moon, -3.5, -3.5)
        ctx.restore() // moon end
      }

      function drawEarthMask() {
        // 这里的坐标系是哪个? 圆上的坐标系
        ctx.save()
        ctx.fillStyle = 'rgba(0, 0, 0, 0.4)'
        ctx.fillRect(0, -12, 40, 24)
        ctx.restore()
      }

    }
  </script>
</body>
</html>
(3)时钟动画
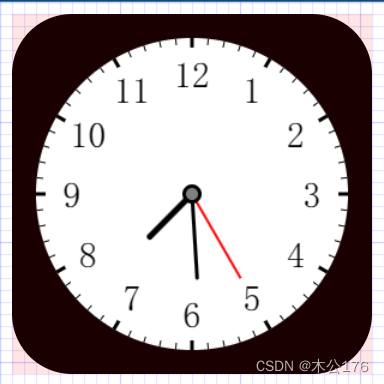
未封装的代码:
<!DOCTYPE html>
<html lang="en">
<head>
  <meta charset="UTF-8">
  <meta http-equiv="X-UA-Compatible" content="IE=edge">
  <meta name="viewport" content="width=device-width, initial-scale=1.0">
  <title>Document</title>
  <style>
    body{
      margin: 0;
      padding: 0;
      background-image: url(../../images/grid.png);
    }
    canvas{
      background-color: rgba(255, 0, 0, 0.1);
    }
    .clock{
      width: 300px;
      height: 300px;
      margin: 10px;
      background-color: black;
      border-radius: 50px;
    }
  </style>
</head>
<body>

  <div class="clock">
    <canvas id="tutorial" width="300" height="300px">
      你的浏览器不兼容Canvas,请升级您的浏览器!
    </canvas>
  </div>

  <script>
    window.onload = function() {
      let canvasEl = document.getElementById('tutorial')
      if(!canvasEl.getContext){
        return
      }
      let ctx = canvasEl.getContext('2d') // 2d | webgl


      requestAnimationFrame(draw)

      /**
       1秒钟会回调 61次
      */
      function draw() {
        ctx.clearRect(0, 0, 300, 300)
        ctx.save()

        // 1.绘制背景(白色圆)
        ctx.save()
        ctx.translate(150, 150)
        ctx.fillStyle ='white'
        ctx.beginPath()
        ctx.arc(0,0, 130, 0, Math.PI * 2)
        ctx.fill()
        ctx.restore()

        // 2.绘制的数字
        ctx.save()
        ctx.translate(150, 150)

        // 开始画 3 数字
        ctx.font = "30px fangsong"
        ctx.textBaseline = 'middle'
        ctx.textAlign = 'center'

        let numbers = [3, 4, 5, 6, 7, 8, 9, 10, 11, 12, 1, 2]
        for(let i =0; i<numbers.length; i++){
          // i = 3 , 0
          // i = 4 , 占 1份, Math.PI * 2 / 12 * i
          let x = Math.cos(Math.PI * 2 / 12 * i) * 100
          let y = Math.sin(Math.PI * 2 / 12 * i) * 100
          ctx.fillText(numbers[i], x, y)
        }
        ctx.restore()

        // 3.绘制时针
        let time = new Date()
        let hours = time.getHours()
        let minute = time.getMinutes()
        let second = time.getSeconds()
        ctx.save()
        ctx.translate(150, 150) // 坐标轴原点在园的中心

        // Math.PI * 2 一整个圆
        // Math.PI * 2 / 12  1h
        // Math.PI * 2 / 12 / 60  1min
        // Math.PI * 2 / 12 / 60 / 60  1secon

        // 1h + 1min + 1 second = 弧度?
        ctx.rotate(
          Math.PI * 2 / 12 * hours +
          Math.PI * 2 / 12 / 60 * minute +
          Math.PI * 2 / 12 / 60 / 60 * second
        )
        ctx.lineWidth = 5
        ctx.lineCap = 'round'
        ctx.beginPath()
        ctx.moveTo(0,0)
        ctx.lineTo(0, -50)
        ctx.stroke()
        ctx.restore()


        // 3.绘制分针
        ctx.save()
        ctx.translate(150, 150) // 坐标轴原点在园的中心

        // Math.PI * 2 一整个圆
        // Math.PI * 2 / 60  1min
        // Math.PI * 2 / 60 / 60  1sec

        // 59min + 59 second = 弧度?
        ctx.rotate(
          Math.PI * 2 / 60 * minute +
          Math.PI * 2 / 60 / 60 * second
        )
        ctx.lineWidth = 3
        ctx.lineCap = 'round'
        ctx.beginPath()
        ctx.moveTo(0,0)
        ctx.lineTo(0, -70)
        ctx.stroke()
        ctx.restore()


        // 4.绘制秒针
        ctx.save()
        ctx.translate(150, 150) // 坐标轴原点在园的中心

        // Math.PI * 2 一整个圆
        // Math.PI * 2 / 60   1sec

        // 1 second = 弧度?
        ctx.rotate(
          Math.PI * 2 / 60 * second
        )
        ctx.strokeStyle = 'red'
        ctx.lineWidth = 2
        ctx.lineCap = 'round'
        ctx.beginPath()
        ctx.moveTo(0,0)
        ctx.lineTo(0, -80)
        ctx.stroke()
        ctx.restore()


        // 5.绘制圆心
        ctx.save()
        ctx.translate(150, 150)

        ctx.beginPath()
        ctx.arc(0, 0, 8, 0, Math.PI*2)
        ctx.fill()

        ctx.fillStyle = 'gray'
        ctx.beginPath()
        ctx.arc(0, 0, 5, 0, Math.PI*2)
        ctx.fill()

        ctx.restore()

        // 6.画圆上的时针的刻度
        ctx.save()
        ctx.translate(150, 150)

        for(let j = 0; j< 12 ; j ++){
          ctx.rotate(Math.PI * 2 / 12 )
          ctx.lineWidth = 3
          ctx.beginPath()
          ctx.moveTo(0, -130)
          ctx.lineTo(0, -122)
          ctx.stroke()
        }

        ctx.restore()

        // 7.画圆上的分针的刻度
        ctx.save()
        ctx.translate(150, 150)
        for(let j = 0; j< 60 ; j ++){
          ctx.rotate(Math.PI * 2 / 60 )
          ctx.lineWidth = 1
          ctx.beginPath()
          ctx.moveTo(0, -130)
          ctx.lineTo(0, -125)
          ctx.stroke()
        }
        ctx.restore()


        ctx.restore()
        requestAnimationFrame(draw)
      }

    }
  </script>
</body>
</html>
封装后的代码写法:
<!DOCTYPE html>
<html lang="en">
<head>
  <meta charset="UTF-8">
  <meta http-equiv="X-UA-Compatible" content="IE=edge">
  <meta name="viewport" content="width=device-width, initial-scale=1.0">
  <title>Document</title>
  <style>
    body{
      margin: 0;
      padding: 0;
      background-image: url(../../images/grid.png);
    }
    canvas{
      background-color: rgba(255, 0, 0, 0.1);
    }
    .clock{
      width: 300px;
      height: 300px;
      margin: 10px;
      background-color: black;
      border-radius: 50px;
    }
  </style>
</head>
<body>

  <div class="clock">
    <canvas id="tutorial" width="300" height="300px">
      你的浏览器不兼容Canvas,请升级您的浏览器!
    </canvas>
  </div>

  <script>
    window.onload = function() {
      let canvasEl = document.getElementById('tutorial')
      if(!canvasEl.getContext){
        return
      }
      let ctx = canvasEl.getContext('2d') // 2d | webgl


      requestAnimationFrame(draw)

      /**
       1秒钟会回调 61次
      */
      function draw() {
        ctx.clearRect(0, 0, 300, 300)
        ctx.save()
        let time = new Date()
        let hours = time.getHours()
        let minute = time.getMinutes()
        let second = time.getSeconds()

        // 1.绘制背景(白色圆)
        drawBg()
        // 2.绘制的数字
        drawNumbers()
        // 3.绘制时针
        drawHours(hours, minute, second)
        // 3.绘制分针
        drawMinute(minute, second)
        // 4.绘制秒针
        drawSecond(second)
        // 5.绘制圆心
        drawCircle()
        // 6.画圆上的时针的刻度
        drawHoursTick()
        // 7.画圆上的分针的刻度
        drawMinuteTick()
        ctx.restore()
        requestAnimationFrame(draw)
      }

      function drawBg(){
        ctx.save()
        ctx.translate(150, 150)
        ctx.fillStyle ='white'
        ctx.beginPath()
        ctx.arc(0,0, 130, 0, Math.PI * 2)
        ctx.fill()
        ctx.restore()
      }

      function drawNumbers(){
        ctx.save()
        ctx.translate(150, 150)

        // 开始画 3 数字
        ctx.font = "30px fangsong"
        ctx.textBaseline = 'middle'
        ctx.textAlign = 'center'

        let numbers = [3, 4, 5, 6, 7, 8, 9, 10, 11, 12, 1, 2]
        for(let i =0; i<numbers.length; i++){
          // i = 3 , 0
          // i = 4 , 占 1份, Math.PI * 2 / 12 * i
          let x = Math.cos(Math.PI * 2 / 12 * i) * 100
          let y = Math.sin(Math.PI * 2 / 12 * i) * 100
          ctx.fillText(numbers[i], x, y)
        }
        ctx.restore()
      }
      function drawHours(hours, minute, second) {
        ctx.save()
        ctx.translate(150, 150) // 坐标轴原点在园的中心

        // Math.PI * 2 一整个圆
        // Math.PI * 2 / 12  1h
        // Math.PI * 2 / 12 / 60  1min
        // Math.PI * 2 / 12 / 60 / 60  1secon

        // 1h + 1min + 1 second = 弧度?
        ctx.rotate(
          Math.PI * 2 / 12 * hours +
          Math.PI * 2 / 12 / 60 * minute +
          Math.PI * 2 / 12 / 60 / 60 * second
        )
        ctx.lineWidth = 5
        ctx.lineCap = 'round'
        ctx.beginPath()
        ctx.moveTo(0,0)
        ctx.lineTo(0, -50)
        ctx.stroke()
        ctx.restore()
      }

      function drawMinute(minute, second) {
        ctx.save()
        ctx.translate(150, 150) // 坐标轴原点在园的中心

        // Math.PI * 2 一整个圆
        // Math.PI * 2 / 60  1min
        // Math.PI * 2 / 60 / 60  1sec

        // 59min + 59 second = 弧度?
        ctx.rotate(
          Math.PI * 2 / 60 * minute +
          Math.PI * 2 / 60 / 60 * second
        )
        ctx.lineWidth = 3
        ctx.lineCap = 'round'
        ctx.beginPath()
        ctx.moveTo(0,0)
        ctx.lineTo(0, -70)
        ctx.stroke()
        ctx.restore()
      }

      function drawSecond(second) {
        ctx.save()
        ctx.translate(150, 150) // 坐标轴原点在园的中心

        // Math.PI * 2 一整个圆
        // Math.PI * 2 / 60   1sec

        // 1 second = 弧度?
        ctx.rotate(
          Math.PI * 2 / 60 * second
        )
        ctx.strokeStyle = 'red'
        ctx.lineWidth = 2
        ctx.lineCap = 'round'
        ctx.beginPath()
        ctx.moveTo(0,0)
        ctx.lineTo(0, -80)
        ctx.stroke()
        ctx.restore()
      }

      function drawCircle() {
        ctx.save()
        ctx.translate(150, 150)

        ctx.beginPath()
        ctx.arc(0, 0, 8, 0, Math.PI*2)
        ctx.fill()

        ctx.fillStyle = 'gray'
        ctx.beginPath()
        ctx.arc(0, 0, 5, 0, Math.PI*2)
        ctx.fill()

        ctx.restore()
      }

      function drawHoursTick() {
        ctx.save()
        ctx.translate(150, 150)

        for(let j = 0; j< 12 ; j ++){
          ctx.rotate(Math.PI * 2 / 12 )
          ctx.lineWidth = 3
          ctx.beginPath()
          ctx.moveTo(0, -130)
          ctx.lineTo(0, -122)
          ctx.stroke()
        }

        ctx.restore()
      }

      function drawMinuteTick() {
        ctx.save()
        ctx.translate(150, 150)
        for(let j = 0; j< 60 ; j ++){
          ctx.rotate(Math.PI * 2 / 60 )
          ctx.lineWidth = 1
          ctx.beginPath()
          ctx.moveTo(0, -130)
          ctx.lineTo(0, -125)
          ctx.stroke()
        }
        ctx.restore()
      }


    }
  </script>
</body>
</html>