2020-2022年美赛O奖C题写信汇总(机翻)
2020
<1>
Dear Marketing Director of Sunshine Company , According to your requirements, we analyze the ratings and reviews of competitive products on Amazon for baby pacifier, microwave and hair dryer to be introduced and sold by your company. We form three models dubbed as Informative Evaluation Model to assess the amount of information of each review, Difference Equation Based Model to formulate the change of product’s reputation and Time Series Forecasting Based Evaluation Model to predict potential success or failure of the product. And we get some meaningful results, which contribute to attract consumers and develop adaptable online sales strategies.
First of all, We construct the Informative Evaluation Model to help you track informative reviews and ratings conveniently. This model can assess whether each review is informative based on star rating, review text, and helpful votes, then rank the reviews based on the amount of information. We believe this informative evaluation is critical to your work when handling a large amount of review information, for informative reviews often provide more constructive input into the design features and therefore are more referential in reputation analysis.
We get consumer’s preferences and concerns by sifting through the top 1% most informative ratings and reviews of baby pacifier, microwave and hair dryer. The popular design features by our analysis are as follows: • Baby pacifier: Various alternatives to size and safe materials are necessary. Besides, cute patterns are popular with babies.
• Microwaves: Multifunctional microwaves with rotating grills, accurate timers, multiple usage patterns, etc. are welcomed by consumers.
• Hair dryer: Consumers prefer hair dryers small with high-power (on the premise of safety). Some additional designs like folding handle are beneficial to attracting consumers.
Then we establish time-based measures to predict the increase or decrease of product reputation in the online marketplace. Our model can accurately predict the reputation change of a product over a long period of time in the future. This precise prediction makes sense for you to generate strategies before the decrease of the reputation.
Based on the reputation prediction, we stipulate that the degree to which reputation will increase or decrease in the future as judgment of the potential success or failure of the product. Our analysis shows that, overall, baby pacifiers are potentially successful products, while microwaves and hair dryers are at greater risk of failure.
According to our analysis results, we formulate reasonable sales strategies for your company: (1) We recommend that you put microwaves and hair dryers into the market when the reputation rises. While the reputation of baby pacifiers is on the rise, and it’s best to put them on the market now. (2) The more complete the product information is, the less loss will be caused by the unequal information between buyers and sellers. (3) We recommend that you increase your promotional efforts when there are more five-star ratings of your products to form positive feedback. (4) When your product’s reputation declines, focus on one-star ratings and reviews.
Thanks for taking the time out of your busy schedule to read my letter. Hope our advice can help.
MCM Team # 2002116
尊敬的阳光公司市场总监,根据您的要求,我们分析了亚马逊上贵公司将推出和销售的婴儿奶嘴、微波炉和吹风机等竞争产品的评级和评论。我们形成了三个模型:信息评价模型,用于评估每次评论的信息量;基于差分方程的模型,用于描述产品的声誉变化;基于时间序列预测的评价模型,用于预测产品的潜在成败。我们得到了一些有意义的结果,有助于吸引消费者和制定适应性强的在线销售策略。
首先,我们构建了信息性评估模型,帮助您方便地跟踪信息性评论和评分。该模型可以根据星级评分、评论文本和有帮助的投票来评估每个评论是否具有信息性,然后根据信息量对评论进行排名。我们相信,在处理大量评论信息时,这种信息丰富的评估对您的工作至关重要,因为信息丰富的评论通常会为设计功能提供更具建设性的意见,因此在声誉分析中更具参考价值。
我们通过筛选前1%最具信息量的评级和对婴儿奶嘴、微波炉和吹风机的评论来了解消费者的偏好和担忧。通过我们的分析,流行的设计特点如下:·婴儿奶嘴:尺寸和安全材料的各种替代是必要的。此外,可爱的图案在婴儿中很受欢迎。
·微波炉:多功能微波炉具有旋转烤架、精确的定时器、多种使用模式等,受到消费者欢迎。
·吹风机:消费者更喜欢体积小、功率大(在安全的前提下)的吹风机。一些额外的设计,如折叠手柄,有利于吸引消费者。
然后,我们建立了基于时间的度量来预测在线市场中产品声誉的增减。我们的模型可以准确地预测产品在未来很长一段时间内的声誉变化。这种准确的预测对你在声誉下降之前制定战略是有意义的。
在声誉预测的基础上,我们规定了未来声誉的增加或减少的程度作为产品潜在成败的判断。我们的分析表明,总的来说,婴儿奶嘴是潜在的成功产品,而微波炉和吹风机失败的风险更大。
根据我们的分析结果,我们为贵公司制定了合理的销售策略:(1)建议您在声誉上升时将微波炉和吹风机推向市场。虽然婴儿奶嘴的声誉正在上升,最好现在就把它们投放市场。(2)产品信息越完整,买卖双方信息不对称造成的损失越小。(3)当您的产品有更多的五星评级时,我们建议您加大促销力度,以形成积极的反馈。(4)当你的产品声誉下降时,专注于一星级的评级和评论。
感谢您在百忙之中抽出时间阅读我的信。希望我们的建议能有所帮助。
MCM团队#2002116
<2>
Dear director, Considering today’s increasingly fierce competition in e-commerce, accurately grasping customer needs and specifying appropriate marketing strategies are of vital importance to improve corporate profits and product visibility. As response to your company’s requirement, we are here pretty glad to have the opportunity to introduce our research and suggestions to you, with the hope that it may give you some insights of the future strategies.
- Pay attention to and properly guide the early reviews.
Throughout the whole records of consumers’ ratings and reviews for hair dryer, microwave and pacifiers, we find the the averaged number of helpful votes for a single review in the first 5 stage is above 3.2 times than that in recent period. Moreover, the descriptions in some reviews with rate 2 look even worser than that with rate 1, and so are descriptions in reviews with rate 4,5. Since helpful votes and the fitness of review description associate tightly with people’s belief and the reputation propagation of products, we suggest Sunshine to properly guide and closely track the trend of early reviews, e.g.
make guidelines of which rate corresponds to which extent of attitude, so as to smoothly go through the cold start stage.
- Keep a good image of brand for all three products.
Based on our statistics, the number of reviews has increased rapidly in recent years, which reflects the great prospects of the online sales market. Whereas at the same time, it should be noted that the star rating and averaged review length will experience large fluctuations in the early stage of the product launch. This phenomena may give customers a bad or fuzzy brand impression. Moreover as the data shows, the early review volume, an indirected reflection of brand popularity, has been hovering at a lower level. As a result, if Sunshine can perform well, e.g. keep a good image of brand, in the early stage, great chances are that it will take a lead in such a highly competitive market, which may exert continuously positive effects on your subsequent development.
- Apply our reputation index to monitor product dynamics.
Since the review and rating data is rich and complex, refining a comprehensive indicator that summarizes product reputation and sales is necessary for Sunshine to quickly adjust its promotion strategy.
In our project, we design a reputation index which takes into account the star rating, time gap of adjacent reviews, review helpfulness rate and readability , information of vine and verification. The time-varying coefficients of joint contribution are calculated by LSTM, whose losses on testing dataset are small enough to be emphasized. Note that the time gap of neighboring reviews is a reflection of product popularity and we assume it to be proportional to the sales volumn, hence our reputation metric can be a great indicator of not only people’s attitude towards products but Sunshine’s profits.
- Attach different importance to products’ properties according to people’s preferences.
Trough the text mining of LDA topic model, we extract 7 topics for each product, which represent the product properties that customers care about most. By an integrative consideration of reviews’ keywords, ratings, helpful votes and the time decay of ratings, we estimate customers’ preference vectors in 8 topics for each products, i.e.

As can be seen from the figures above, except for the tight control of products’ materials quality, we suggest that your company ensure the security, heat and after sales service of hair dryer and microwave, as well as the size, shape and packing of pacifier.
We are really appreciated for this opportunity to assist you in building up an online marketing strategy, and we are convinced that our proposal can be utilized in improvement of your competence for the three products. Please feel free to contact us for further information on the project.
Sincerely yours MCM 2020 Team
尊敬的总监,考虑到当今电子商务竞争日益激烈,准确把握客户需求,制定合适的营销策略,对提高企业利润和产品知名度至关重要。作为对贵公司要求的回应,我们很高兴有机会向您介绍我们的研究成果和建议,希望能给您一些关于未来战略的见解。
1.重视和妥善引导前期审查。
纵观消费者对吹风机、微波炉和安抚奶嘴的评分和评论的整个记录,我们发现前5个阶段的单条评论的平均帮助票数是最近一段时间的3.2倍以上。此外,评分为2的评论中的描述甚至比评分为1的评论中的描述更差,而评分为4、5的评论中的描述也是如此。由于帮助投票和评论描述的适合性与人们的信念和产品的声誉传播密切相关,我们建议阳光阳光适当地引导和密切跟踪早期评论的趋势,例如。
制定哪些速度与哪些态度相对应的指导方针,从而顺利度过冷启动阶段。
2.保持三个产品良好的品牌形象。
根据我们的统计,近年来评论数量增长迅速,这反映了网络销售市场的巨大前景。而与此同时,需要注意的是,星级评分和平均评论时长在产品发布的早期阶段会经历较大的波动。这种现象可能会给顾客留下不好的或模糊的品牌印象。此外,正如数据显示的那样,作为品牌受欢迎程度的间接反映,早期评论量一直徘徊在较低水平。因此,如果阳光能够在早期表现良好,例如保持良好的品牌形象,它很有可能在这样一个竞争如此激烈的市场中领先,这可能会对你未来的发展产生持续的积极影响。
3.使用我们的声誉指数来监测产品动态。
由于点评数据丰富复杂,因此,提炼一个汇总产品口碑和销量的综合指标,是阳光汽车快速调整促销策略的必要之举。
在我们的项目中,我们设计了一个信誉指数,该指数考虑了星级评分、相邻评论的时差、评论的有助率和可读性、VIN的信息和验证。用LSTM计算联合贡献的时变系数,其在测试数据集上的损失很小,值得注意。请注意,相邻评论的时间间隔是产品受欢迎程度的反映,我们假设它与销量成正比,因此我们的声誉指标不仅可以很好地指示人们对产品的态度,而且可以衡量阳光汽车的利润。
4.根据人们的喜好,对产品的性能给予不同的重视。
通过对LDA主题模型的文本挖掘,我们为每个产品提取了7个主题,代表了客户最关心的产品属性。通过综合考虑评论的关键词、评分、帮助投票和评分的时间衰减,我们估计了消费者对每个产品8个主题的偏好向量。
从上面的数字可以看出,除了严格控制产品的材料质量外,我们建议贵公司确保吹风机和微波炉的安全、热量和售后服务,以及奶嘴的大小、形状和包装。
我们非常感谢有这个机会帮助您建立在线营销策略,我们相信我们的建议可以用来提高您对这三种产品的竞争力。请随时与我们联系,了解有关该项目的进一步信息。
诚挚的您的MCM 2020团队
2021
<1>
Dear Sir/Madam, We are sorry for the unfortunate event of the Asian giant hornet invasion. We know how problematic this situation is for agriculture and how it causes worries in the community . To help with the endeavor to eradicate the pest, we propose a model to improve the efficiency of processing the reports, and provide insight into how they can be monitored.
Simply put, the model works in three steps:
-
Determine the current nesting area through processing current confirmed sightings.
-
Predict the distribution of future nests using data from the first step.
-
Judge the credibility of sightings by considering results from the two steps before and the characteristics of the hornet.
This model makes reliable guesses at where the nest of a hornet may be found by tracing the tracks of sighted workers, and makes predictions on where new nests may be found.
This information can aid wildlife officers in their search-and-destroy tasks, and also warn beekeepers of possible danger zones.
It can also sort pictures of sightings by placing them in different groups belonging to different insects. This helps improve the efficiency of the government agency in examining the reports by aiding entomologists through doing a rough screening of incoming pictures first. Besides this, factors such as geographical information and coordinates are also taken into consideration, because of the habits of the insect. The resulting algorithm can reach 98% when it comes to identifying only the pictures of the Asian giant hornet.
The model is also capable of updating itself when new information is given. Depending on the circumstance, the model will change: • by updating its figure set if any new photo comes in; • by adding a new site as a possible nest if confirmed sightings occur far away from any known nest; • every year by deleting information of current nests, since queens migrate and old nests die out.
Fighting a horde of invasive species can be a hard task, but our model can be of great help, especially when it comes to the examination of sighting reports. When the amount of sightings peaks at around august, your experts will be overloaded with pictures to examine.
Besides the aforementioned ability of roughly screening the photos, it is also capable of flagging and prioritizing the most probable photos for further examination. Our tests show that it can correctly prioritize 5 photos out of the bulk of 1400 photos for human intervention.
We can almost convince ourselves of victory when no new confirmed sighting occurs from May to November, since the hornets are most active at these times of the year. But to be more confident with this judgement, we would want to see a declining trend in the number of confirmed sightings to reassure ourselves of victory. According to our calculations, a trend of sighting numbers decreasing representing a probability of survival lower than 0.05 would be sufficient to demonstrate that the pest has been eradicated.
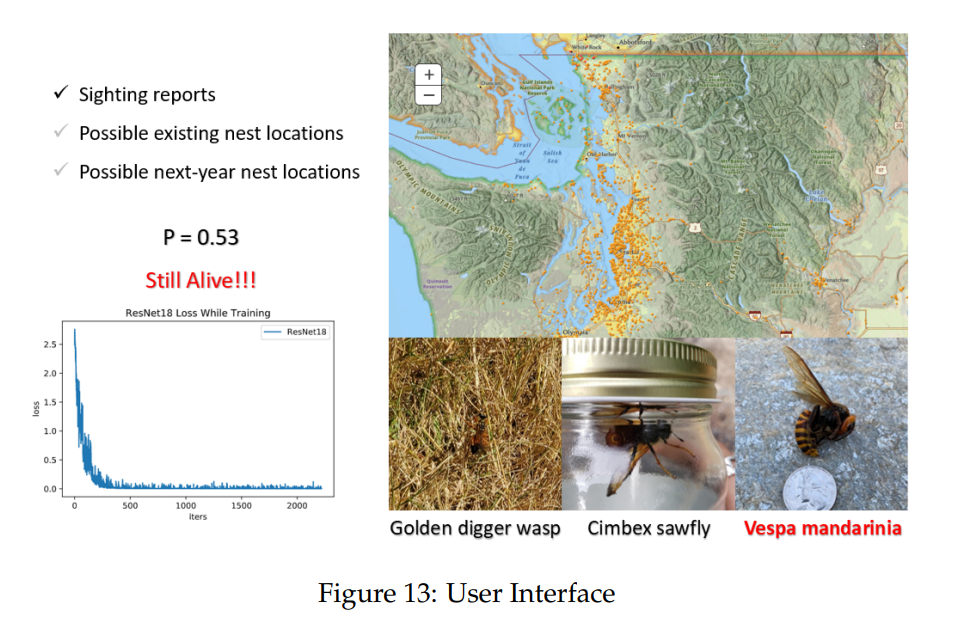
The Figure 13 above is an illustration of how the model will work: you can select the map view by checking the three boxes on the top-left. The three pictures below the map represent the results after expert analysis in the three groups. The figure on the bottom-left illustrates how the photo identification algorithm improves itself over time: it makes fewer mistakes. The text on the middle-left is the output of p and the predicted situation of the hornet colony .
We hope this model can serve as a valuable tool in our united effort to fight the horde.
After all, the eradication of this invasive species is the common goal of both our team and the civilians of Washington State. If there are any further questions or problems regarding this model, please contact us and we will do whatever we can to explain and/or improve the model.
We are looking forward to your good news.
Yours Sincerely, Team # 2101587
尊敬的先生/女士,我们对亚洲大黄蜂入侵的不幸事件表示歉意。我们知道这种情况对农业有多大的问题,也知道它如何引起社会的担忧。为了帮助根除害虫的努力,我们提出了一个模型来提高处理报告的效率,并对如何监控报告提供了见解。
简单地说,该模型分为三个步骤:
1.通过处理当前确认的目击事件来确定当前的筑巢区域。
2.使用第一步的数据预测未来巢穴的分布。
3.根据前两步的结果和大黄蜂的特征来判断目击的可信度。
这个模型通过追踪有视力的工蚁的足迹,可靠地猜测在哪里可以找到马蜂窝,并预测在哪里可以找到新的蜂巢。
这些信息可以帮助野生动物官员执行搜索和销毁任务,也可以警告养蜂人可能存在的危险区域。
它还可以对目击图片进行分类,方法是将它们归入属于不同昆虫的不同组。这有助于提高政府机构审查报告的效率,通过首先对传入图片进行粗略筛选来帮助昆虫学家。此外,由于昆虫的习性,地理信息和坐标等因素也被考虑在内。当只识别亚洲大黄蜂的图片时,所得到的算法可以达到98%。
该模型还能够在给定新信息时进行自我更新。根据情况的不同,模型将发生变化:·如果有新的照片进来,就更新它的图形集合;·如果确认目击到远离任何已知巢穴的地方,就增加一个新的地点作为可能的巢穴;·每年删除当前巢穴的信息,因为蜂王迁徙,旧巢穴灭绝。
与一群入侵物种作战可能是一项艰巨的任务,但我们的模型可以提供很大帮助,特别是在审查目击报告时。当目击事件的数量在8月份左右达到顶峰时,你的专家将会有大量的图片需要检查。
除了上面提到的粗略筛选照片的能力外,它还能够标记最有可能的照片并对其进行优先排序,以供进一步检查。我们的测试表明,它可以正确地对1400张照片中的5张照片进行优先排序,以供人工干预。
当5月至11月没有新的确认目击发现时,我们几乎可以说服自己取得胜利,因为黄蜂在一年中的这个时候最活跃。但为了对这一判断更有信心,我们希望看到确认目击事件数量的下降趋势,以使自己对胜利感到放心。根据我们的计算,目击数量减少代表生存概率低于0.05的趋势将足以证明害虫已被根除
上面的图13显示了模型的工作原理:您可以通过选中左上角的三个框来选择地图视图。地图下面的三张图代表了三组专家分析后的结果。左下角的图说明了照片识别算法如何随着时间的推移而自我改进:它犯的错误更少。左中的文本是p的输出和对马蜂群的预测情况。
我们希望这一模式能够成为我们共同努力打击部落的宝贵工具。
毕竟,根除这种入侵物种是我们团队和华盛顿州平民的共同目标。如果对该模型有任何进一步的疑问或问题,请与我们联系,我们将尽我们所能解释和/或改进该模型。
我们期待着你的好消息。
你们诚挚的,2101587队
<2>
TO: The Washington State Department of Agriculture FROM: MCM Team 2107870 DATE: February 8, 2021 SUBJECT: Analysis of Vespa mandarinia Sightings and Recommendations for Investigation We are writing to address the State of Washington’s ongoing efforts to detect occurrences and spread of the Vespa mandarinia species, commonly known as the Asian Giant Hornet. Vespa mandarinia poses a great threat to the Washington state ecology. In our new partnership, we are dedicated to protecting the State of Washington and greater area ecology, helping the community find safety in nature, and most importantly, developing a concrete metric that allows better allocation your resources in these efforts.
By sifting through the image, text and location data collected in your initial efforts to track public sightings of Vespa mandarinia, our team has developed a long-term process and metric which will assist your department in identifying which civilian submissions should be allocated highest priority and conversely lowest priority investigation. We will walk you through the development of the model used to process reports, and furthermore provide concrete recommendations to your department.
OUR APPROACH We developed a model with two analysis tracks: image data analysis and notes/date of detection analysis.
- The image data analysis track requires the input of still images of the insect being reported.
The output of this track is a list that links the GlobalIDs of the sighting to the probability that the image is of Vespa mandarinia. These probabilities range from 0 to 1. A value of 0 means the image is not of Vespa mandarinia, and a value of 1 means the image is an image of Vespa mandarinia.
- The notes/date of detection detection analysis requires the input of these two data points and outputs the a list linking the GlobalIDs of the sightings to the probability that the notes data of that sighting refers to Vespa mandarinia on a the same scale of 0 to 1.
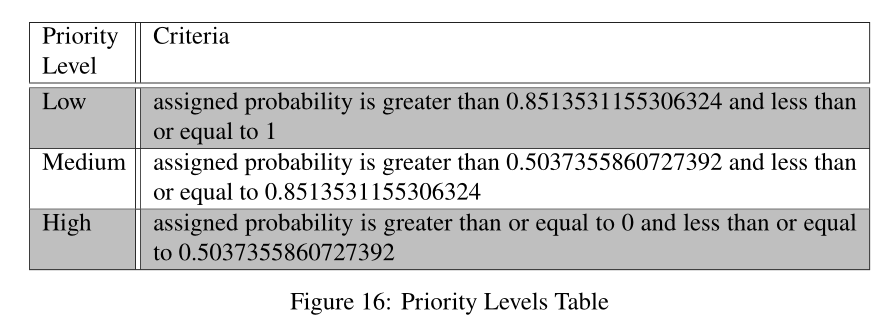
Our model takes these two lists from the separate tracks, as well as the location data of longitude and latitude, and combines them. Y ou are given a list of pairings between GlobalIDs and the probability that the reported sighting is not of Vespa mandarinia on a scale of 0 to 1. A value 1 indicates that the sighting is not Vespa mandarinia and 0 indicates that the sighting is Vespa mandarinia. The following table presents the priority levels assigned to the probability deliverable:
To continue our ongoing partnership, we also propose a model for future use that assigns a probability of a sighting being Vespa mandarinia based upon pest spread from past seasonal cycles. Such a model will be useful as more data on the location of positive sightings are collected.
OUR FINDINGS AND RECOMMENDATIONS Our short term recommendations follow as such: 1. The most urgent locations that should be investigated are: Whatcom county, Skagit County, and San Juan County. After running our model on all the unverified and unprocessed data, these three counties scored the highest probability of being a Vespa mandarinia sighting.
- Our short term logistical recommendation is that the Agricultural Department make great amendments to the civilian submission form. When preprocessing the initial data, our team had to remove many submissions because records contained incorrect dates and photos. The preprocessed notes suffered from noisy data because many submissions contained additional irrelevant description of possibly identifying Vespa mandarinia, but did not go into any details of what the alleged insect looked like. This makes distinction of ID increasingly difficult. We suggest specifying on the form uploads of “Insect Photos” and “Vivid Description of Insect Seen” to curate better civilian data.
Our long term recommendations follow as such: 1. Investigation into high priority sightings (according to the Priority Levels Table above) should be emphasized most; however, this is not to say that a sighting with a low priority level is not Vespa mandarinia. It is simply less likely to be Vespa mandarinia than the other sightings. For this reason, some level of investigation into all of the priority levels should be allocated; however, the most urgent are the sightings in the high priority level.
- Evidence of eradication of this pest in a region can be determined by this model when all of the reported sightings exist in the low priority level within a 30km radius of the region of interest for two Vespa mandarinia seasonal cycles (two years).
We appreciate your time and consideration and hope to expand upon this partnership to help ensure the ecological safety of the State of Washington in the future.
Sincerely, Team 2107870
致:华盛顿州农业部来源:MCM Team 2107870日期:2021年2月8日主题:对野黄蜂目击事件的分析和调查建议
我们写信是为了解决华盛顿州正在进行的检测野黄蜂物种(俗称亚洲大黄蜂)发生和传播的努力。野胡蜂对华盛顿州的生态构成了极大的威胁。在我们的新伙伴关系中,我们致力于保护华盛顿州和更大范围的生态,帮助社区在大自然中找到安全,最重要的是,制定具体的衡量标准,使您能够在这些努力中更好地分配资源。
通过筛选您在最初追踪公众目击野黄蜂时收集的图像、文本和位置数据,我们的团队制定了一个长期流程和衡量标准,将帮助您的部门确定哪些平民提交的文件应被分配最高优先级,反之亦然,应被分配最低优先级的调查。我们将向您介绍用于处理报告的模型的开发过程,并进一步向您的部门提供具体建议。
我们的方法我们开发了一个具有两个分析轨道的模型:图像数据分析和检测的笔记/日期分析。
1.图像数据分析轨迹需要输入被报告昆虫的静止图像。
这个轨迹的输出是一个列表,它将目击的GlobalID与图像是野黄蜂的概率联系起来。这些概率的范围从0到1。值0表示图像不是野胡蜂图像,值1表示图像是野胡蜂图像。
2.检测检测分析的笔记/日期需要这两个数据点的输入,并且输出将目击的GlobalID链接到该目击的笔记数据以0到1的相同尺度引用野黄蜂的概率的列表。
我们的模型从单独的轨道中获取这两个列表,以及经度和纬度的位置数据,并将它们结合在一起。你会得到一份GlobalID和报告的发现不是野胡蜂的概率之间的配对列表,范围从0到1。值1表示发现的不是野胡蜂,值0表示发现的是野胡蜂。下表列出了分配给可交付概率的优先级别:
为了继续我们正在进行的合作伙伴关系,我们还提出了一个未来使用的模型,该模型根据过去季节性周期传播的害虫来指定发现野胡椒的概率。随着更多关于正面目击事件位置的数据被收集,这样的模型将是有用的。
我们的发现和建议我们的短期建议如下:
1.最需要调查的紧急地点是:Whatcom县、Skagit县和San Juan县。在对所有未经验证和处理的数据运行我们的模型后,这三个县获得了最高的胡蜂目击概率。
2.我们的短期后勤建议是,农业部对民间提交的表格进行大的修改。在对初始数据进行预处理时,我们的团队不得不删除许多提交的数据,因为记录中包含错误的日期和照片。这些经过预处理的笔记受到了数据噪音的影响,因为许多意见书中包含了可能识别野黄蜂的额外无关描述,但没有详细说明所谓的昆虫是什么样子。这使得身份识别变得越来越困难。我们建议在表格上传中注明\“昆虫照片\”和\“所见昆虫的生动描述\”,以管理更好的民用数据。
我们的长期建议如下:
1.最应该强调对高优先级目击事件的调查(根据上面的优先级表);但这并不是说低优先级目击事件就不是黄蜂目击事件。与其他目击事件相比,这只是野黄蜂的可能性更小。为此,应对所有优先级别进行一定程度的调查;然而,最紧迫的是高优先级别的目击事件。
2.当所有报告的目击事件都存在于感兴趣区域半径30公里范围内的低优先级时,该模型可以确定在一个区域根除该害虫的证据,这两个季节周期(两年)。
我们感谢您的时间和考虑,并希望扩大这一伙伴关系,以帮助确保华盛顿州未来的生态安全。
诚挚的,2107870队
2022
<1>
This memo introduces our investment strategy model for you from four perspectives: the establishment of transaction strategy model, the robustness of the model, the sensitivity of the model, and investment returns.
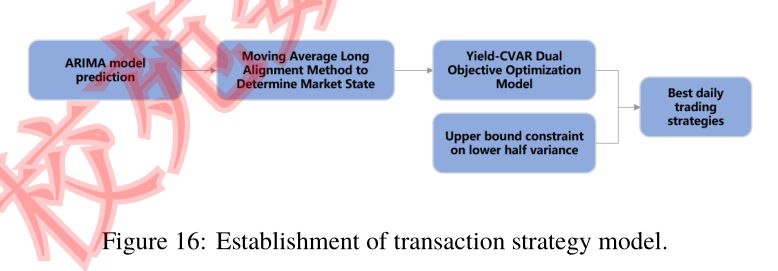
- Establishment of transaction strategy model.
It is common sense that accurately predicting the future trend of asset prices is the basic premise of correct investment decisions. We use the ARIMA model commonly used in time series analysis to determine reasonable model parameters based on known historical data to predict the next day’s price. Because too frequent trading will increase transaction costs and bring greater investment risks , we clarify the current market state and judge whether to trade at present based on the moving average long arrangement method. Finally, we established a revenue-CV AR dual-objective optimization model and obtained a series of feasible solutions through the NSGA-II algorithm, and then the daily trading strategy is obtained by combining the upper limit of the downside semi-variance of the asset portfolio. At the same time, our model can modify the upper limit of the risk constraint according to the investor’s degree of risk aversion, and obtain the best investment strategy that matches anyone’s risk tolerance.
- Robustness of the model.
In the prediction bias test, the MAPE values are all less than 0.1, very close to 0. R2-score values are all greater than 94%, close to 1, indicating that the model can accurately predict the key moment when the asset price fluctuates greatly, thus providing a good precondition for subsequent investment decisions.
After the investment strategy optimality test, our investment model can buy assets before the bull market, hold to rise, and accurately grasp the profit opportunities. At the same time, the model has the ability to survive the period of bear market smoothly, with high anti-risk fluctuation ability, and can keep the asset loss to a minimum in the bear market.
In addition, we apply random disturbance to the given investment strategies to generate 1000 groups of new simulated investment strategies. The comparison of returns shows that the average annual returns of simulated investments are lower than the investment strategies given by us, and the 5-year total returns of our investment strategies are higher than 93% of the simulated investment strategies, which is enough to prove that our investment model can provide you with a relatively profitable investment strategy while minimizing risk.
- Model sensitivity.
Since changes in the global financial and economic environment, domestic macro-politics, and economic environment will all have an impact on the market, the volatile assets transaction costs are likely to change accordingly. By adjusting the parameter settings of transaction costs, we find that our investment model is more sensitive to the transaction cost of bitcoin, and the model is more sensitive to the reduction of transaction cost relative to the increase of transaction cost. At the same time, after multiple robustness tests, our investment model also has good performance under different transaction costs, exceeding 90% of the simulated decisions, which is worthy of trust.
- Investment return.
The 5-year total rate of return on the investment reaches 616.63%, the average annual rate of return is 261.41%, and the highest annual rate of return is 664.68%, which means our model has strong profitability. The lowest annual rate of return is 55.6%, which means that the model can quickly adjust asset allocation and has strong anti-risk capabilities.
Should you need more information, we’ll be glad to introduce more about the Investment Strategy Model.
From 2016 to 2018, the market performance was relatively stable and the risk was small.
We are optimistic about the rise of bitcoin, choose to hold a large share of bitcoin with a relatively low valuation and hold a certain amount of gold to hedge risks, which accurately predict and grasp the upward trend of bitcoin. The three-year returns were 368.99%, 664.68%, and 102.48%.
In 2019-2021, the market performance was volatile, and bull and bear markets appeared frequently. In 2020, we accurately grasped the opportunities in the bitcoin market, buy at low prices, and achieve an annual return of 55%. In 2021, we will seize the opportunity to reduce bitcoin holdings and buy gold to take profit before the bear market comes. The yield in 2021 is 453.03%, finally achieved a 5-year cumulative growth of 616.63%.
Therefore, our investment strategy model can grasp the reasonable relationship between investment opportunities and trading volume, and have the ability to stop loss and take profit for the purpose of effectively avoiding risks, recommending profitable investment strategies that best suit your risk-resisting ability.
The above is the whole content of our model. Should you need more information, we’ll be glad to discuss our investment strategy models in detail at next meeting.
本备忘录从交易策略模型的建立、模型的稳健性、模型的敏感度和投资收益四个方面为您介绍了我们的投资策略模型。
1.交易策略模型的建立。
准确预测资产价格未来走势是正确投资决策的基本前提,这是常识。我们使用时间序列分析中常用的ARIMA模型,根据已知的历史数据确定合理的模型参数,以预测第二天的价格。由于过于频繁的交易会增加交易成本,带来更大的投资风险,因此我们明确了当前的市场状态,并基于移动平均线做多排列方法来判断目前是否进行交易。最后,建立了收益-CV-AR双目标优化模型,通过NSGA-II算法得到一系列可行解,然后结合资产组合下行半方差的上限得到每日交易策略。同时,我们的模型可以根据投资者的风险厌恶程度来修正风险约束的上限,从而得到与任何人的风险承受能力相匹配的最优投资策略。
2.模型的稳健性。
在预测偏差检验中,MAPE值均小于0.1,非常接近于0。R2-Score值均大于94%,接近1,表明该模型能够准确预测资产价格波动较大的关键时刻,为后续投资决策提供了良好的前提条件。
经过投资策略最优检验,我们的投资模式可以在牛市前买入资产,守住上涨,准确把握获利机会。同时,该模型具有平稳度过熊市时期的能力,具有较高的抗风险波动能力,能够将熊市中的资产损失保持在最低水平。
此外,我们对给定的投资策略施加随机干扰,以产生1,000组新的模拟投资策略。收益对比显示,模拟投资的年均收益低于我们给出的投资策略,我们投资策略的5年总收益高于模拟投资策略的93%,这足以证明我们的投资模型可以在最大限度降低风险的同时为您提供相对盈利的投资策略。
3.模型敏感性。
由于全球金融经济环境、国内宏观政治、经济环境的变化都会对市场产生影响,资产交易成本的波动也可能随之发生变化。通过调整交易成本的参数设置,我们发现我们的投资模型对比特币的交易成本更敏感,相对于交易成本的增加,该模型对交易成本的降低更敏感。同时,经过多次稳健性测试,我们的投资模型在不同交易成本下也有较好的表现,超过90%的模拟决策,值得信赖。
4.投资回报。
5年总投资收益率达到616.63,平均年收益率为261.41,最高年收益率为664.68,意味着我们的模式具有很强的盈利能力。最低年化收益率为55.6%,意味着该模型能够快速调整资产配置,具有较强的抗风险能力。
如果您需要更多的信息,我们很乐意为您介绍更多关于投资策略模型的信息。
2016年至2018年,市场表现相对平稳,风险较小。
我们看好比特币的崛起,选择持有估值相对较低的比特币并持有一定比例的黄金来对冲风险,这准确地预测和把握了比特币的上涨趋势。三年的回报率分别为368.99%、664.68%和102.48%。
2019-2021年,市场表现震荡,牛市和熊市频繁出现。2020年,我们准确把握比特币市场机遇,低价买入,实现了55%的年回报率。2021年,我们将抓住机遇,在熊市到来之前减持比特币,买入黄金获利了结。2021年的收益率为453.03%,最终实现了5年累计增长616.63%。
因此,我们的投资策略模型可以把握投资机会和交易量之间的合理关系,并具有止损获利能力,以有效规避风险为目的,推荐最适合您抗风险能力的盈利投资策略。
以上就是我们模型的全部内容。如果您需要更多信息,我们很乐意在下次会议上详细讨论我们的投资策略模型。
<2>
Our team was assigned to create a model that would calculate the optimal daily strategy to trade between cash, gold, and bitcoin in order to generate the most profit.
The model was initialized at $1000 cash on September 11, 2016 and terminated on September 11, 2021. Using price data that was recorded up to only the day of trading, we successfully created a model that predicted future trends and informed current investment strategies utilizing various trading and normalization methods.
Our model was created on the basis of two main trading strategies: momentum theory and reversion to the mean. The momentum of the financial asset is calculated through the price gradient – the change in price in an interval of time – and moving average – the summation of previous weighted prices divided by a sum of previous weights. If both the gradient and moving average are greater than 1 at the time of trading, a buy signal will be generated. Otherwise, a sell signal is issued. Since momentum trading determines trades when the price rises above the moving average, the reversion to mean strategy is used to catch price movements below it. This theory states that the farther the price deviates away from the moving average, the greater the probability it will move towards the average on its next time step. If the price falls far below the moving average, it is more likely to increase in the future, so our model will generate a buy signal. A combination of these two theories creates the trading strategy our model uses for normal market conditions.
The second part of trading is to determine how much to buy at each trade. We do this by calculating the profitability of the current market. The profitability is directly proportional to the gradient of the price, so the larger the magnitude the gradient has, the larger the amount of assets it will purchase.
In standard market conditions, the general sequence of asset trading is coded as follows: The model checks for sell indicators, selling any assets if demanded. The model checks the gold and bitcoin buy indicators, compares them to decide if and what to buy. If neither buy signals were issued, the model can choose to sell both assets.
When an asset is bought, it will not immediately be sold, even though a continuous buying and selling at any increase in value may seem profitable because of the transaction fees in place. Therefore, our model implements a holding period of z days where the asset is not bought or sold.
The strategy described previously was to operate during normal market conditions. In the case of extreme market conditions, a second sequence of logic is activated, overriding our previous methods. If the current gradient is calculated to fivetimes the average historical gradient, the extreme market conditions algorithm is run.
This means that the model will not sell until the price of the asset has returned to a price ∆P below its maximum over the interval. This method is used to prevent the premature selling that could have occurred if the normal strategy was implemented.
Following the extreme market conditions sequence, we run a no-buy condition where the model will not buy into the market for a certain period of time.
After running our model for the four-year period, we obtained a final asset value of $219,799 – a return on investment of 21,880%. Our model buys and sells at near optimal points and responds effectively to market crashes and critical points. Since our model’s purpose is profit, it will buy and sell assets with that sole intention, resulting in a final portfolio of largely bitcoin and less gold.
Though our model is profitable and effective, we recognize its strengths and weaknesses. We will be glad to discuss any further recommendations on improving it to increase its efficiency and profitability.
Thank you for supporting this endeavor.
Sincerely, Modeling Team
我们的团队被指派创建一个模型,该模型将计算在现金、黄金和比特币之间进行交易的最佳每日策略,以产生最大利润。
该模式于2016年9月11日以1000美元现金初始化,并于2021年9月11日终止。使用截至交易日的价格数据,我们成功地创建了一个模型,利用各种交易和标准化方法预测未来趋势,并为当前投资策略提供信息。
我们的模型建立在两个主要交易策略的基础上:动量理论和回归均值。金融资产的动量是通过价格梯度(一段时间内价格的变化)和移动平均数(以前加权价格的总和除以以前的权重之和)来计算的。如果交易时梯度和移动均线均大于1,则会产生买入信号。否则,就会发出卖出信号。由于动量交易决定了当价格升至移动平均线上方时的交易,回归均值策略被用来捕捉低于移动平均线的价格变动。这一理论指出,价格偏离移动平均线越远,在下一个时间步向移动平均线移动的可能性就越大。如果价格远低于移动均线,则未来上涨的可能性更大,因此我们的模型将产生买入信号。这两种理论的结合创造了我们的模型在正常市场条件下使用的交易策略。
交易的第二部分是确定在每笔交易中买入多少。我们通过计算当前市场的盈利能力来做到这一点。盈利能力与价格的梯度成正比,因此梯度越大,它将购买的资产数量就越大。
在标准市场条件下,资产交易的一般顺序如下:该模型检查卖出指标,如果需要,出售任何资产。该模型检查黄金和比特币的购买指标,将它们进行比较,以决定是否购买以及购买什么。如果两个买入信号都没有发出,该模型可以选择同时卖出两种资产。
当一项资产被购买时,它不会立即被出售,即使由于交易费用的存在,持续的买入和以任何增值的价格卖出似乎都是有利可图的。因此,我们的模型实现了z天的持有期,在此期间资产不被买卖。
之前描述的策略是在正常市场条件下运营。在极端市场条件下,第二个逻辑序列被激活,凌驾于我们之前的方法之上。如果当前坡度计算为5
乘以历史平均梯度,则运行极端市场条件算法。
这意味着,在资产价格回到低于其最大值的价格∆P之前,该模型将不会出售。这种方法被用来防止在实施正常策略时可能发生的过早抛售。
按照极端的市场条件序列,我们运行不买入条件,在此条件下,模型在一定时间内不会买入市场。
在运行我们的模型四年后,我们获得了最终资产价值219,799美元-投资回报率为21,880%。我们的模型在接近最优的点进行买卖,并对市场崩溃和临界点做出有效的反应。由于我们的模型的目的是盈利,它将以这个唯一的意图买卖资产,最终的投资组合主要是比特币,更少的是黄金。
虽然我们的模式是盈利和有效的,但我们认识到它的优势和劣势。我们将很高兴讨论关于改进它以提高其效率和盈利能力的任何进一步建议。
感谢您对这一努力的支持。
的方法之上。如果当前坡度计算为5乘以历史平均梯度,则运行极端市场条件算法。
这意味着,在资产价格回到低于其最大值的价格∆P之前,该模型将不会出售。这种方法被用来防止在实施正常策略时可能发生的过早抛售。
按照极端的市场条件序列,我们运行不买入条件,在此条件下,模型在一定时间内不会买入市场。
在运行我们的模型四年后,我们获得了最终资产价值219,799美元-投资回报率为21,880%。我们的模型在接近最优的点进行买卖,并对市场崩溃和临界点做出有效的反应。由于我们的模型的目的是盈利,它将以这个唯一的意图买卖资产,最终的投资组合主要是比特币,更少的是黄金。
虽然我们的模式是盈利和有效的,但我们认识到它的优势和劣势。我们将很高兴讨论关于改进它以提高其效率和盈利能力的任何进一步建议。
感谢您对这一努力的支持。
诚心诚意,模型团队