目录
资料
Prometheus是一个开源的系统监控和报警系统,同时也支持多种exporter采集数据,还支持pushgateway进行数据上报,Prometheus性能足够支撑上万台规模的集群。
- 官网:https://prometheus.io/
- 下载:https://prometheus.io/download/
- 手册:https://prometheus.io/docs/introduction/overview/
Prometheus 基于 Golang 编写,编译后的软件包,不依赖于任何的第三方依赖。只需要下载对应平台的二进制包,解压并且添加基本的配置即可正常启动 Prometheus Server。

下载
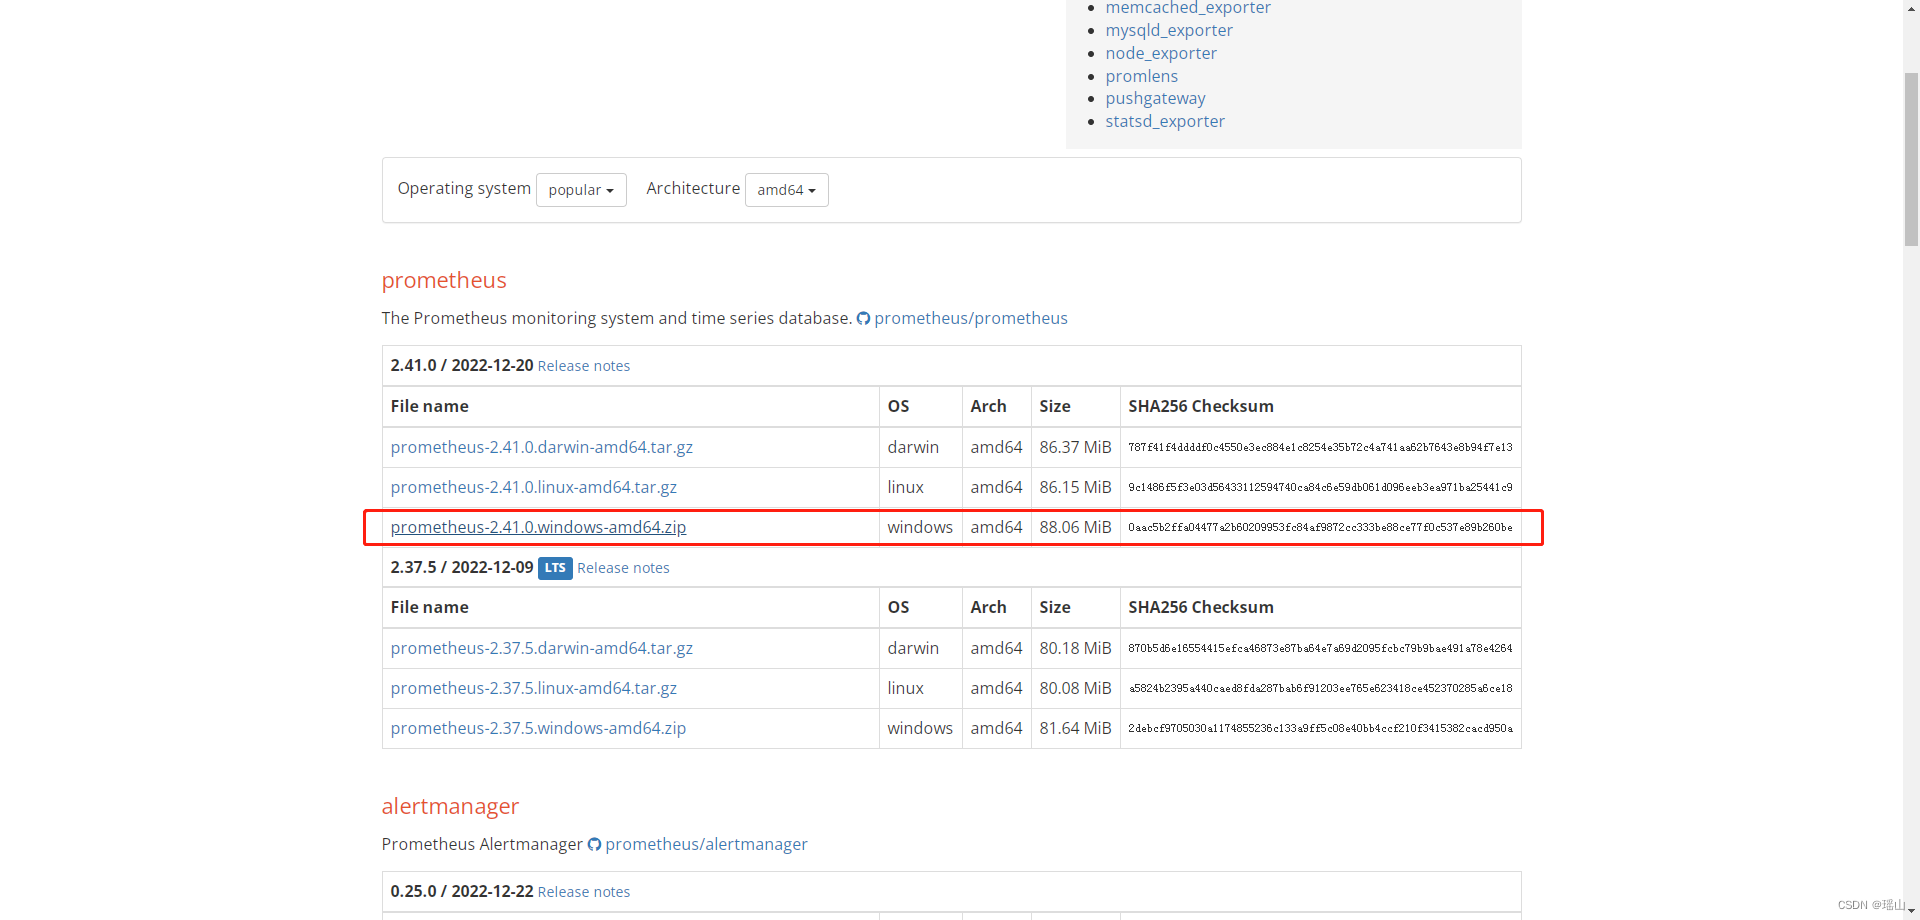
本地测试用, 暂时先用windows版本
下载过慢可以用这个:
解压
解压安装包, 打开配置文件 prometheus.yml, 默认配置如下
# my global config
global:
  scrape_interval: 15s # Set the scrape interval to every 15 seconds. Default is every 1 minute.
  evaluation_interval: 15s # Evaluate rules every 15 seconds. The default is every 1 minute.
  # scrape_timeout is set to the global default (10s).

# Alertmanager configuration
alerting:
  alertmanagers:
    - static_configs:
        - targets:
          # - alertmanager:9093

# Load rules once and periodically evaluate them according to the global 'evaluation_interval'.
rule_files:
  # - "first_rules.yml"
  # - "second_rules.yml"

# A scrape configuration containing exactly one endpoint to scrape:
# Here it's Prometheus itself.
scrape_configs:
  # The job name is added as a label `job=<job_name>` to any timeseries scraped from this config.
  - job_name: "prometheus"

    # metrics_path defaults to '/metrics'
    # scheme defaults to 'http'.

    static_configs:
      - targets: ["localhost:9090"]
-
global 配置块:此片段指定的是 prometheus 的全局配置, 比如采集间隔,抓取超时时间等。
-
scrape_interval:拉取数据的时间间隔,默认为 1 分钟默认继承 global 值。
-
scrape_timeout: 抓取超时时间,默认继承 global 值。
-
evaluation_interval:规则验证(生成 alert)的时间间隔,默认为 1 分钟。
-
- rule_files 配置块:此片段指定报警规则文件, prometheus 根据这些规则信息,会推送报警信息到alertmanager 中。
- scrape_configs 配置块:配置采集目标相关, prometheus 监视的目标。Prometheus自身的运行信息可以通过 HTTP 访问,所以Prometheus 可以监控自己的运行数据。指定抓取配置,prometheus 的数据采集通过此片段配置。
- job_name:监控作业的名称。他的下一集是instance,也就是target
- static_configs:表示静态目标配置,就是固定从某个 target 拉取数据。一个 scrape_config 片段指定一组目标和参数, 目标就是实例,指定采集的端点, 参数描述如何采集这些实例, 主要参数如下
- targets : 指定监控的目标, 其实就是从哪儿拉取数据。
- metric_path: 抓取路径, 默认是/metrics, *_sd_configs: 指定服务发现配置Prometheus 会从 http://server:9090/metrics 上拉取数据。
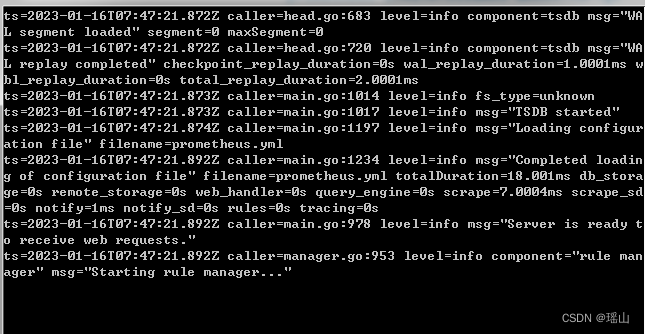
点击prometheus.exe运行