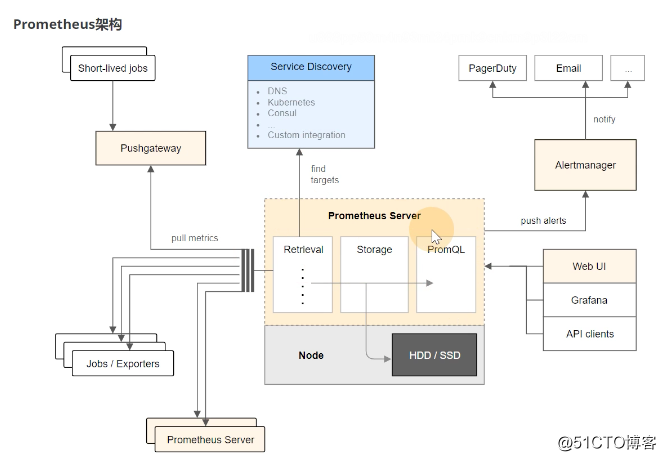
一、Prometheus架构图
二、通过docker方式直接运行一个Prometheus
docker run -d --name tmp -p 127.0.0.1:9090:9090 prom/prometheus:v2.19.2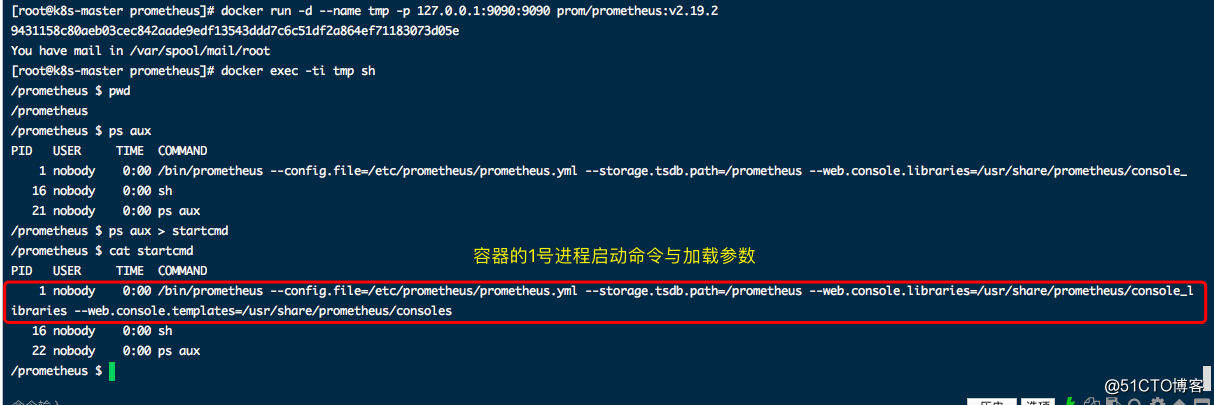
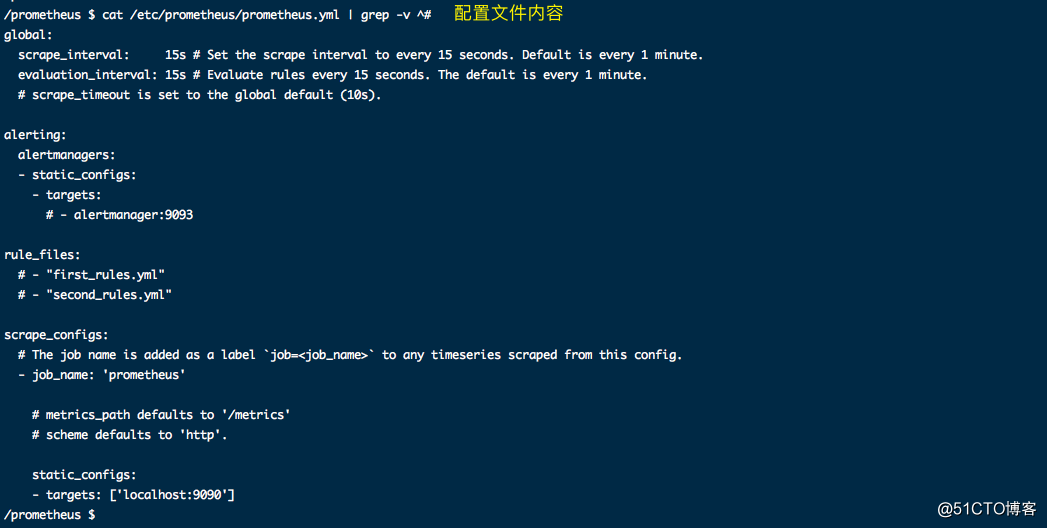
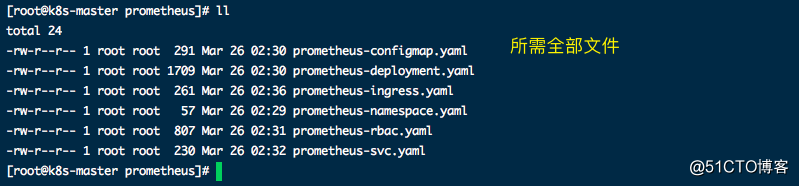
#我们需根据该容器的启动命令与配置文件内容,制作相应的yaml文件
三、通K8S运行Prometheus监控系统
1、prometheus-namespace.yaml
apiVersion: v1
kind: Namespace
metadata:
  name: monitor
2、prometheus-configmap.yaml
apiVersion: v1
kind: ConfigMap
metadata:
  name: prometheus-config
  namespace: monitor
data:
  prometheus.yml: |
    global:
      scrape_interval: 15s
      evaluation_interval: 15s
    scrape_configs:
    - job_name: 'prometheus'
      static_configs:
      - targets: ['localhost:9090']
3、prometheus-rbac.yaml
apiVersion: v1
kind: ServiceAccount
metadata:
  name: prometheus
  namespace: monitor
---
apiVersion: rbac.authorization.k8s.io/v1
kind: ClusterRole
metadata:
  name: prometheus
rules:
- apiGroups:
  - ""
  resources:
  - nodes
  - services
  - endpoints
  - pods
  - nodes/proxy
  verbs:
  - get
  - list
  - watch
- apiGroups:
  - "extensions"
  resources:
    - ingresses
  verbs:
  - get
  - list
  - watch
- apiGroups:
  - ""
  resources:
  - configmaps
  - nodes/metrics
  verbs:
  - get
- nonResourceURLs:
  - /metrics
  verbs:
  - get
---
apiVersion: rbac.authorization.k8s.io/v1beta1
kind: ClusterRoleBinding
metadata:
  name: prometheus
roleRef:
  apiGroup: rbac.authorization.k8s.io
  kind: ClusterRole
  name: prometheus
subjects:
- kind: ServiceAccount
  name: prometheus
  namespace: monitor
4、prometheus-deployment.yaml
apiVersion: apps/v1
kind: Deployment
metadata:
  name: prometheus
  namespace: monitor
  labels:
    app: prometheus
spec:
  selector:
    matchLabels:
      app: prometheus
  template:
    metadata:
      labels:
        app: prometheus
    spec:
      serviceAccountName: prometheus
      nodeSelector:
        app: prometheus
      initContainers:
      - name: "change-permission-of-directory"
        image: busybox
        command: ["/bin/sh"]
        args: ["-c", "chown -R 65534:65534 /prometheus"]
        securityContext:
          privileged: true
        volumeMounts:
        - mountPath: "/etc/prometheus"
          name: config-volume
        - mountPath: "/prometheus"
          name: data
      containers:
      - image: prom/prometheus:v2.19.2
        name: prometheus
        args:
        - "--config.file=/etc/prometheus/prometheus.yml"
        - "--storage.tsdb.path=/prometheus"  # 指定tsdb数据路径
        - "--web.enable-lifecycle"  # 支持热更新,直接执行localhost:9090/-/reload立即生效
        - "--web.console.libraries=/usr/share/prometheus/console_libraries"
        - "--web.console.templates=/usr/share/prometheus/consoles"
        ports:
        - containerPort: 9090
          name: http
        volumeMounts:
        - mountPath: "/etc/prometheus"
          name: config-volume
        - mountPath: "/prometheus"
          name: data
        resources:
          requests:
            cpu: 100m
            memory: 512Mi
          limits:
            cpu: 100m
            memory: 512Mi
      volumes:
      - name: data
        hostPath:
          path: /data/prometheus/
      - configMap:
          name: prometheus-config
        name: config-volume
5、prometheus-svc.yaml
apiVersion: v1
kind: Service
metadata:
  name: prometheus
  namespace: monitor
  labels:
    app: prometheus
spec:
  selector:
    app: prometheus
  type: ClusterIP
  ports:
    - name: web
      port: 9090
      targetPort: http
6、prometheus-ingress.yaml
apiVersion: extensions/v1beta1
kind: Ingress
metadata:
  name: prometheus
  namespace: monitor
spec:
  rules:
  - host: prometheus.xxxx.com
    http:
      paths:
      - path: /
        backend:
          serviceName: prometheus
          servicePort: 9090