seaborn从入门到精通04-主题颜色设置与总结
总结
本文主要是seaborn从入门到精通系列第4篇,本文介绍了seaborn的主题颜色设置并seaborn总结,同时介绍了较好的参考文档置于博客前面,读者可以重点查看参考链接。本系列的目的是可以完整的完成seaborn从入门到精通。重点参考连接

参考
seaborn官方
seaborn官方介绍
seaborn可视化入门
【宝藏级】全网最全的Seaborn详细教程-数据分析必备手册(2万字总结)
Seaborn常见绘图总结
Python-Seaborn绘制图形
FacetGrid
主题(style)
seaborn设置风格的方法主要有三种:
set,通用设置接口
set_style,风格专用设置接口,设置后全局风格随之改变
axes_style,设置当前图(axes级)的风格,同时返回设置后的风格系列参数,支持with关键字用法
seaborn中主要有以下几个主题:
sns.set_style(“whitegrid”) # 白色网格背景
sns.set_style(“darkgrid”) # 灰色网格背景
sns.set_style(“dark”) # 灰色背景
sns.set_style(“white”) # 白色背景
sns.set_style(“ticks”) # 四周加边框和刻度
环境(context)
设置环境的方法也有3种:
set,通用设置接口
set_context,环境设置专用接口,设置后全局绘图环境随之改变
plotting_context,设置当前图(axes级)的绘图环境,同时返回设置后的环境系列参数,支持with关键字用法
sns.plotting_context("notebook")  # 默认
sns.plotting_context("paper")
sns.plotting_context("talk")
sns.plotting_context("poster")
可以看出,4种默认绘图环境最直观的区别在于字体大小的不同,而其他方面也均略有差异。详细对比下4种绘图环境下的系列参数设置:
颜色(color_palette())
seaborn风格多变的另一大特色就是支持个性化的颜色配置。颜色配置的方法有多种,常用方法包括以下两个:
color_palette,基于RGB原理设置颜色的接口,可接收一个调色板对象作为参数,同时可以设置颜色数量
hls_palette,基于Hue(色相)、Luminance(亮度)、Saturation(饱和度)原理设置颜色的接口,除了颜色数量参数外,另外3个重要参数即是hls
同时,为了便于查看调色板样式,seaborn还提供了一个专门绘制颜色结果的方法palplot。
gallery
参考:http://seaborn.pydata.org/examples/index.html
import numpy as np
import pandas as pd
import seaborn as sns
import matplotlib.pyplot as plt
sns.set_theme(style="ticks")
# Create a dataset with many short random walks
rs = np.random.RandomState(4)
pos = rs.randint(-1, 2, (20, 5)).cumsum(axis=1)
pos -= pos[:, 0, np.newaxis]
step = np.tile(range(5), 20)
walk = np.repeat(range(20), 5)
df = pd.DataFrame(np.c_[pos.flat, step, walk],
columns=["position", "step", "walk"])
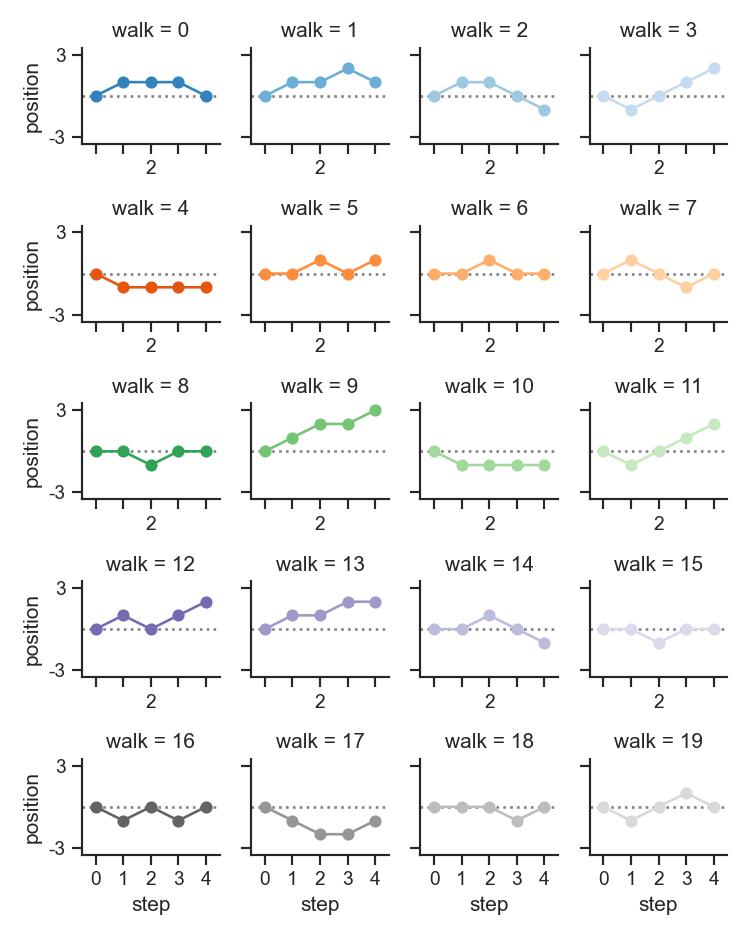
# Initialize a grid of plots with an Axes for each walk
grid = sns.FacetGrid(df, col="walk", hue="walk", palette="tab20c",
col_wrap=4, height=1.5)
# Draw a horizontal line to show the starting point
grid.refline(y=0, linestyle=":")
# Draw a line plot to show the trajectory of each random walk
grid.map(plt.plot, "step", "position", marker="o")
# Adjust the tick positions and labels
grid.set(xticks=np.arange(5), yticks=[-3, 3],
xlim=(-.5, 4.5), ylim=(-3.5, 3.5))
# Adjust the arrangement of the plots
grid.fig.tight_layout(w_pad=1)