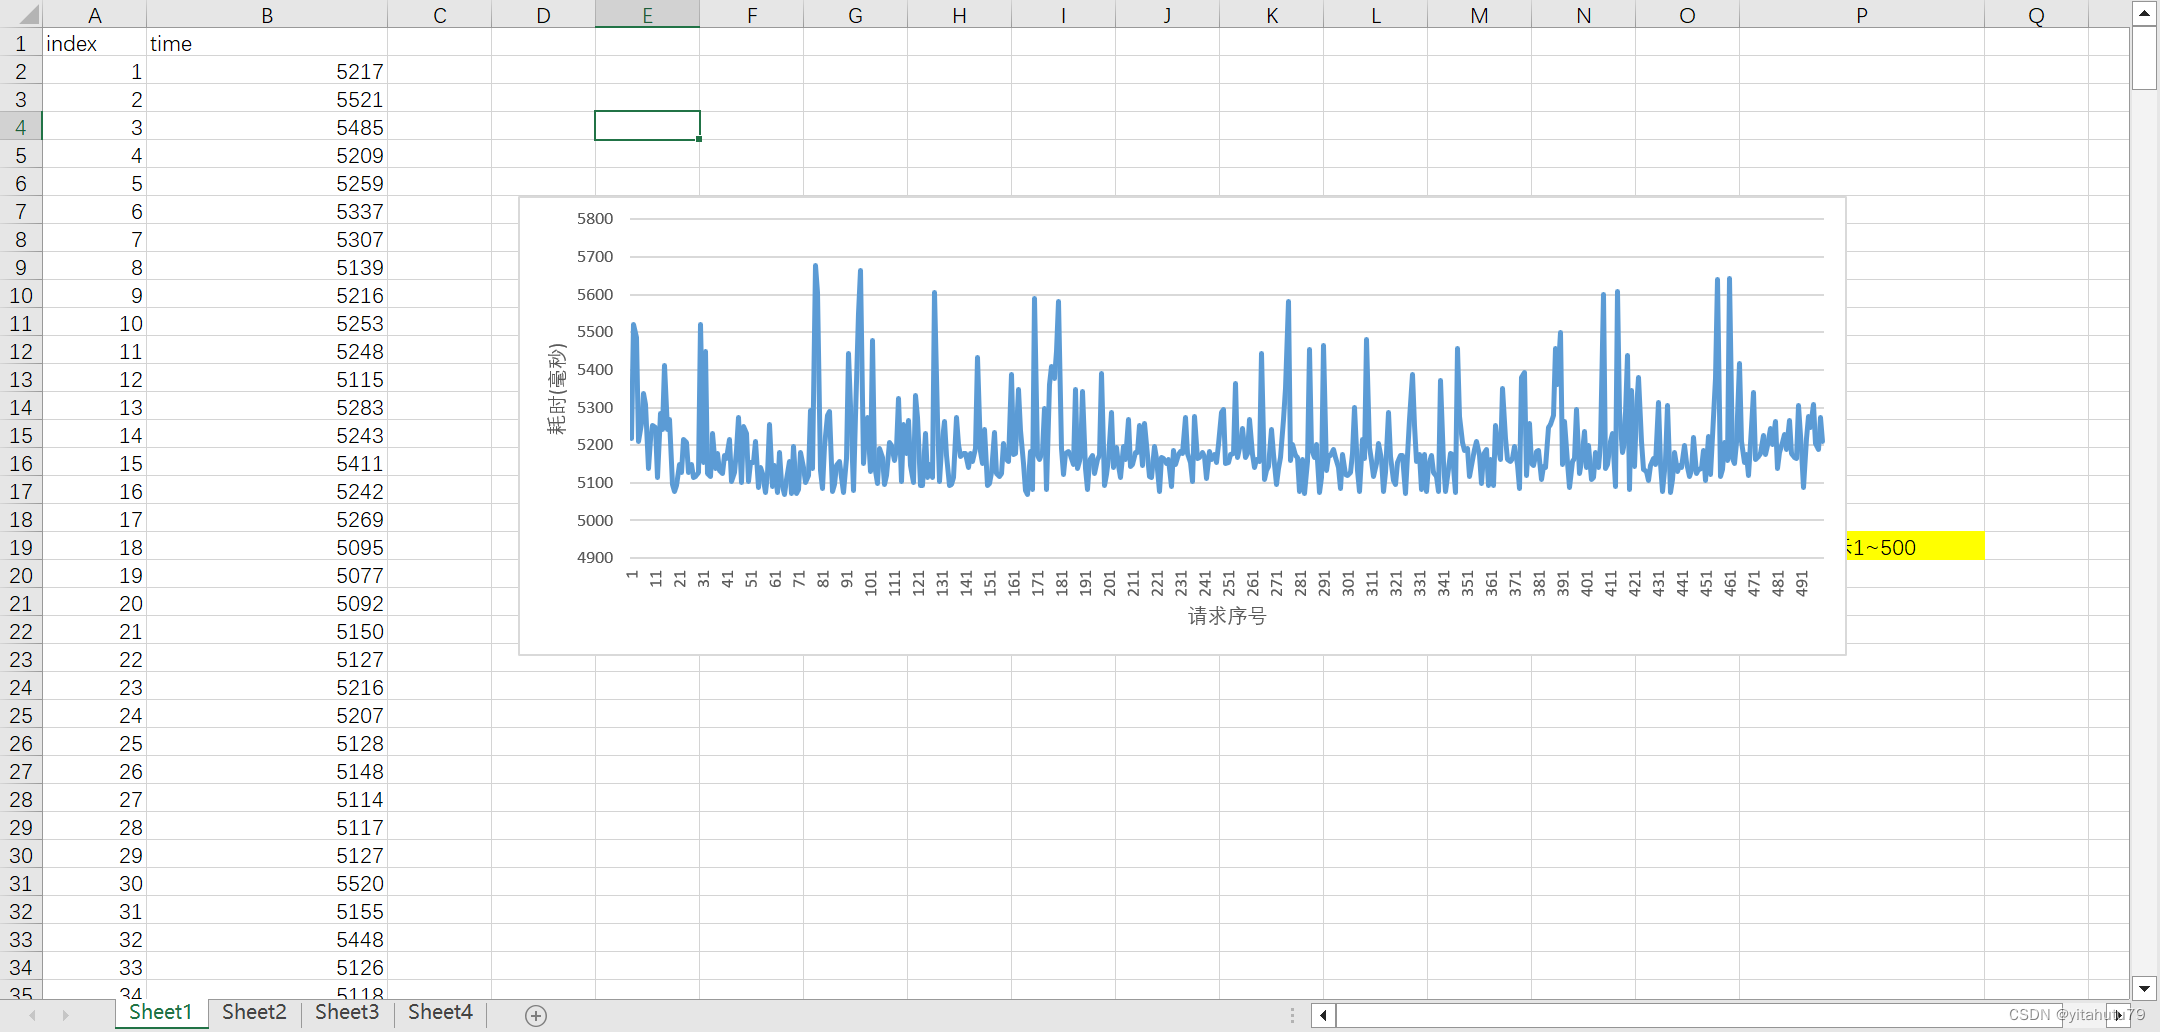
1.绘制折线图
import numpy as np
import pandas as pd
from pyecharts.charts import *
import pyecharts.options as opts
from matplotlib.font_manager import FontProperties
import matplotlib as mpl
import matplotlib.pyplot as plt
from matplotlib.ticker import FuncFormatter

df = pd.read_excel(r"C:\Users\LiJie\Desktop\demo.xlsx")

plt.plot(df["index"],df["time"],markersize='5',markeredgewidth=1.5)
plt.ylabel('耗时(ms)')
plt.xlabel('请求序号')
plt.show()

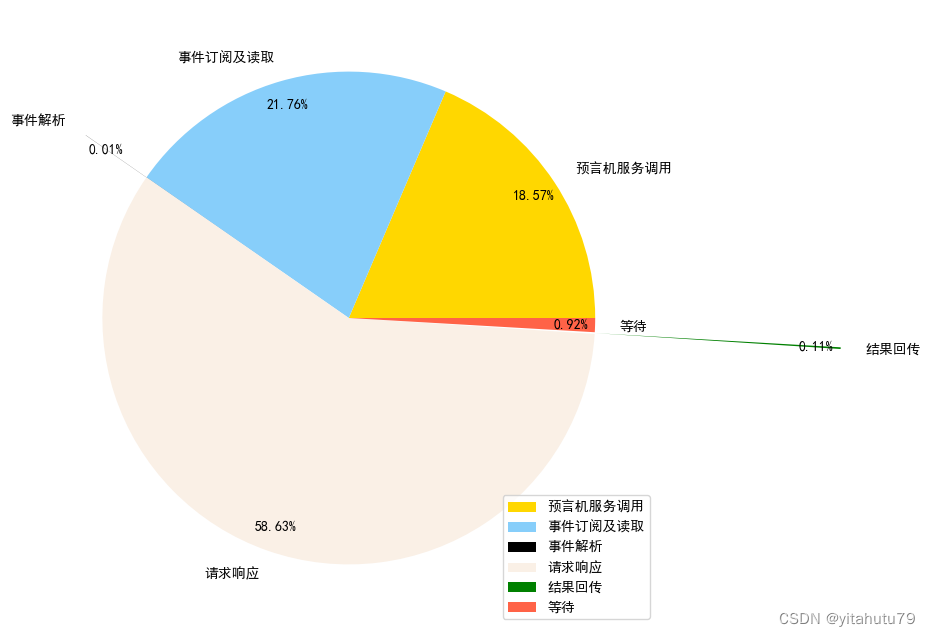
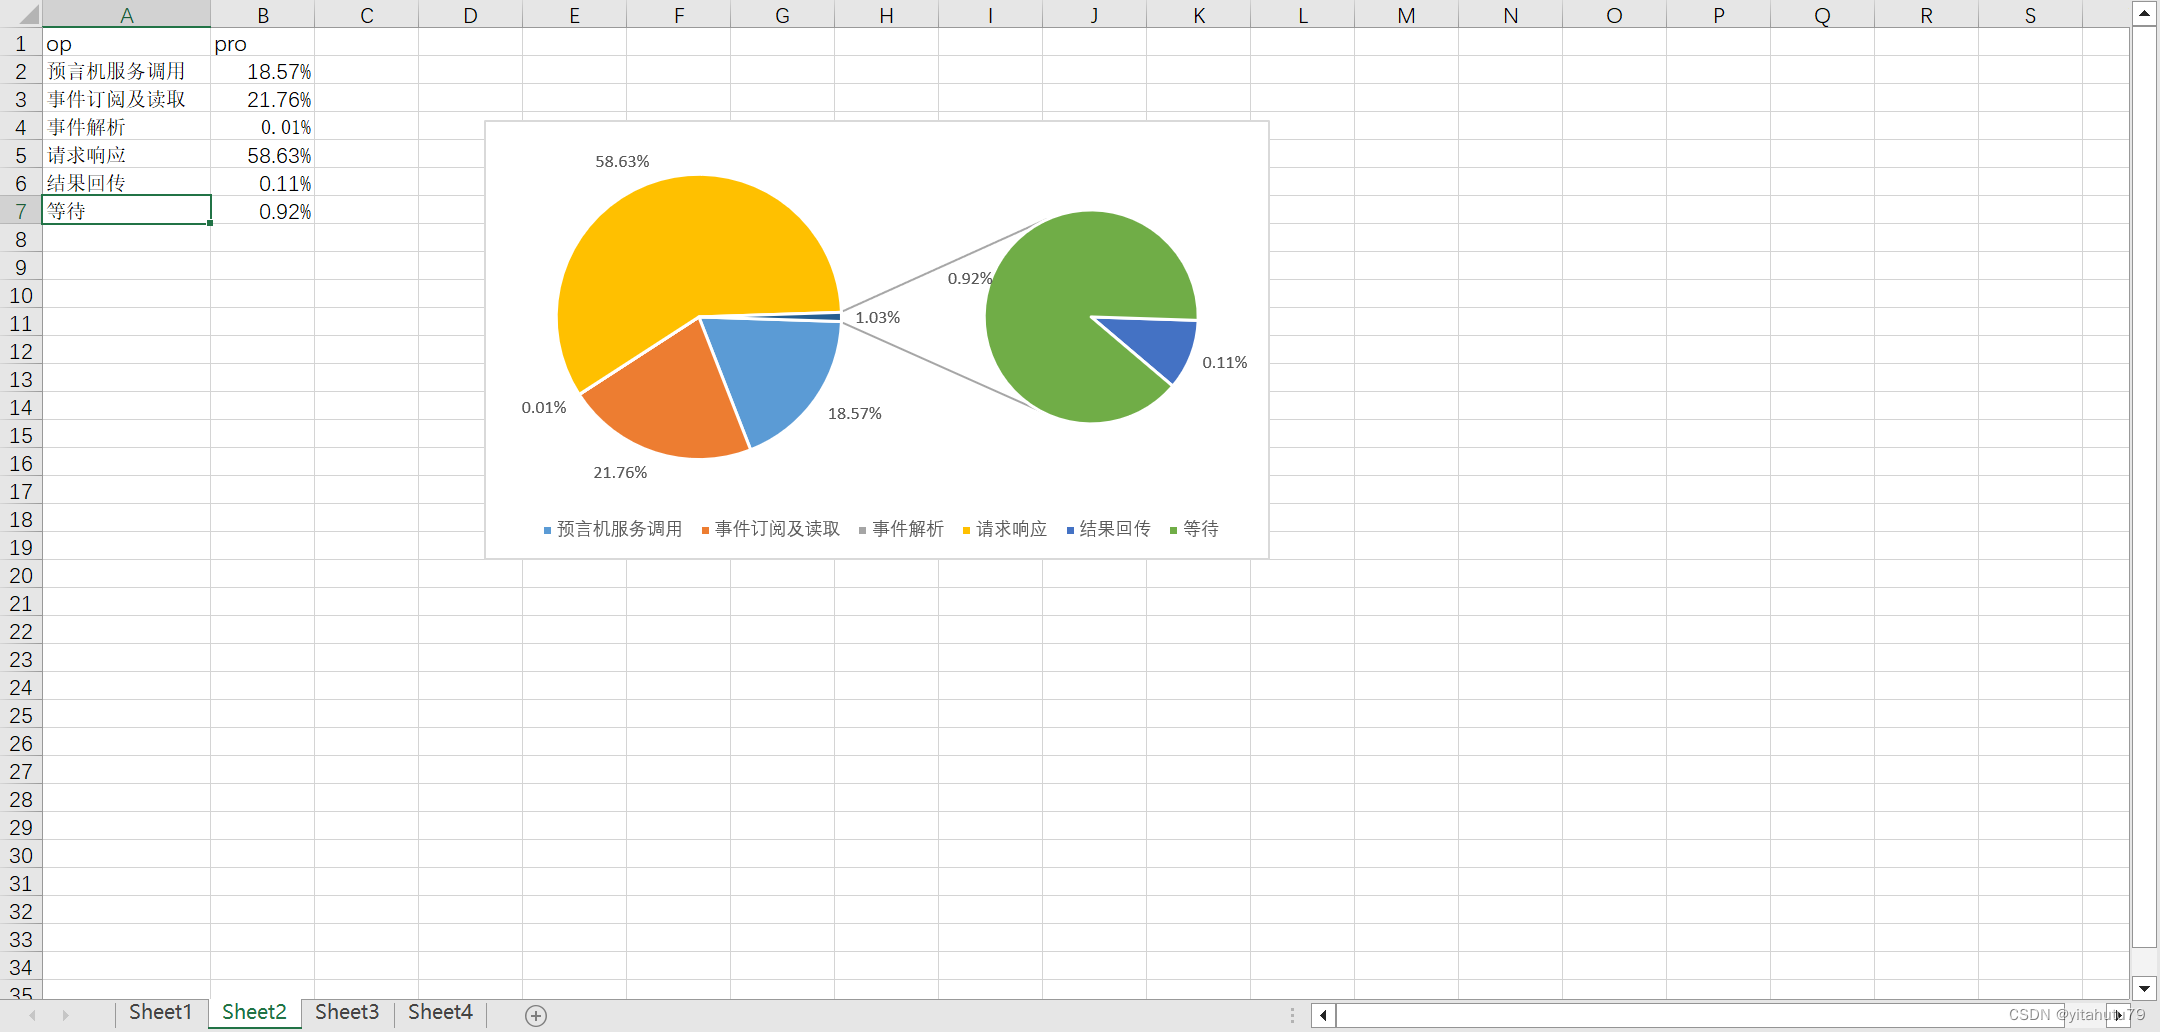
2.绘制饼图
import pandas as pd
import numpy as np

df = pd.read_excel(r"C:\Users\LiJie\Desktop\demo.xlsx",sheet_name='Sheet2')
labels = ["预言机服务调用","事件订阅及读取","事件解析","请求响应","结果回传","等待"]
x = df["pro"]

import matplotlib.pyplot as plt

plt.rcParams['font.sans-serif'] = 'simhei'
plt.rcParams['axes.unicode_minus'] = False
plt.figure(figsize=(8, 8))

colors = ['gold', 'lightskyblue','black', 'linen', 'green', 'tomato']
plt.pie(x, labels = labels, colors = colors,autopct="%1.2f%%",pctdistance=0.9,explode=(0,0,0.3,0,1,0))

plt.legend(loc ='lower right')
plt.show()
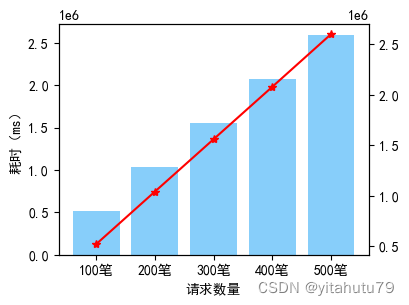
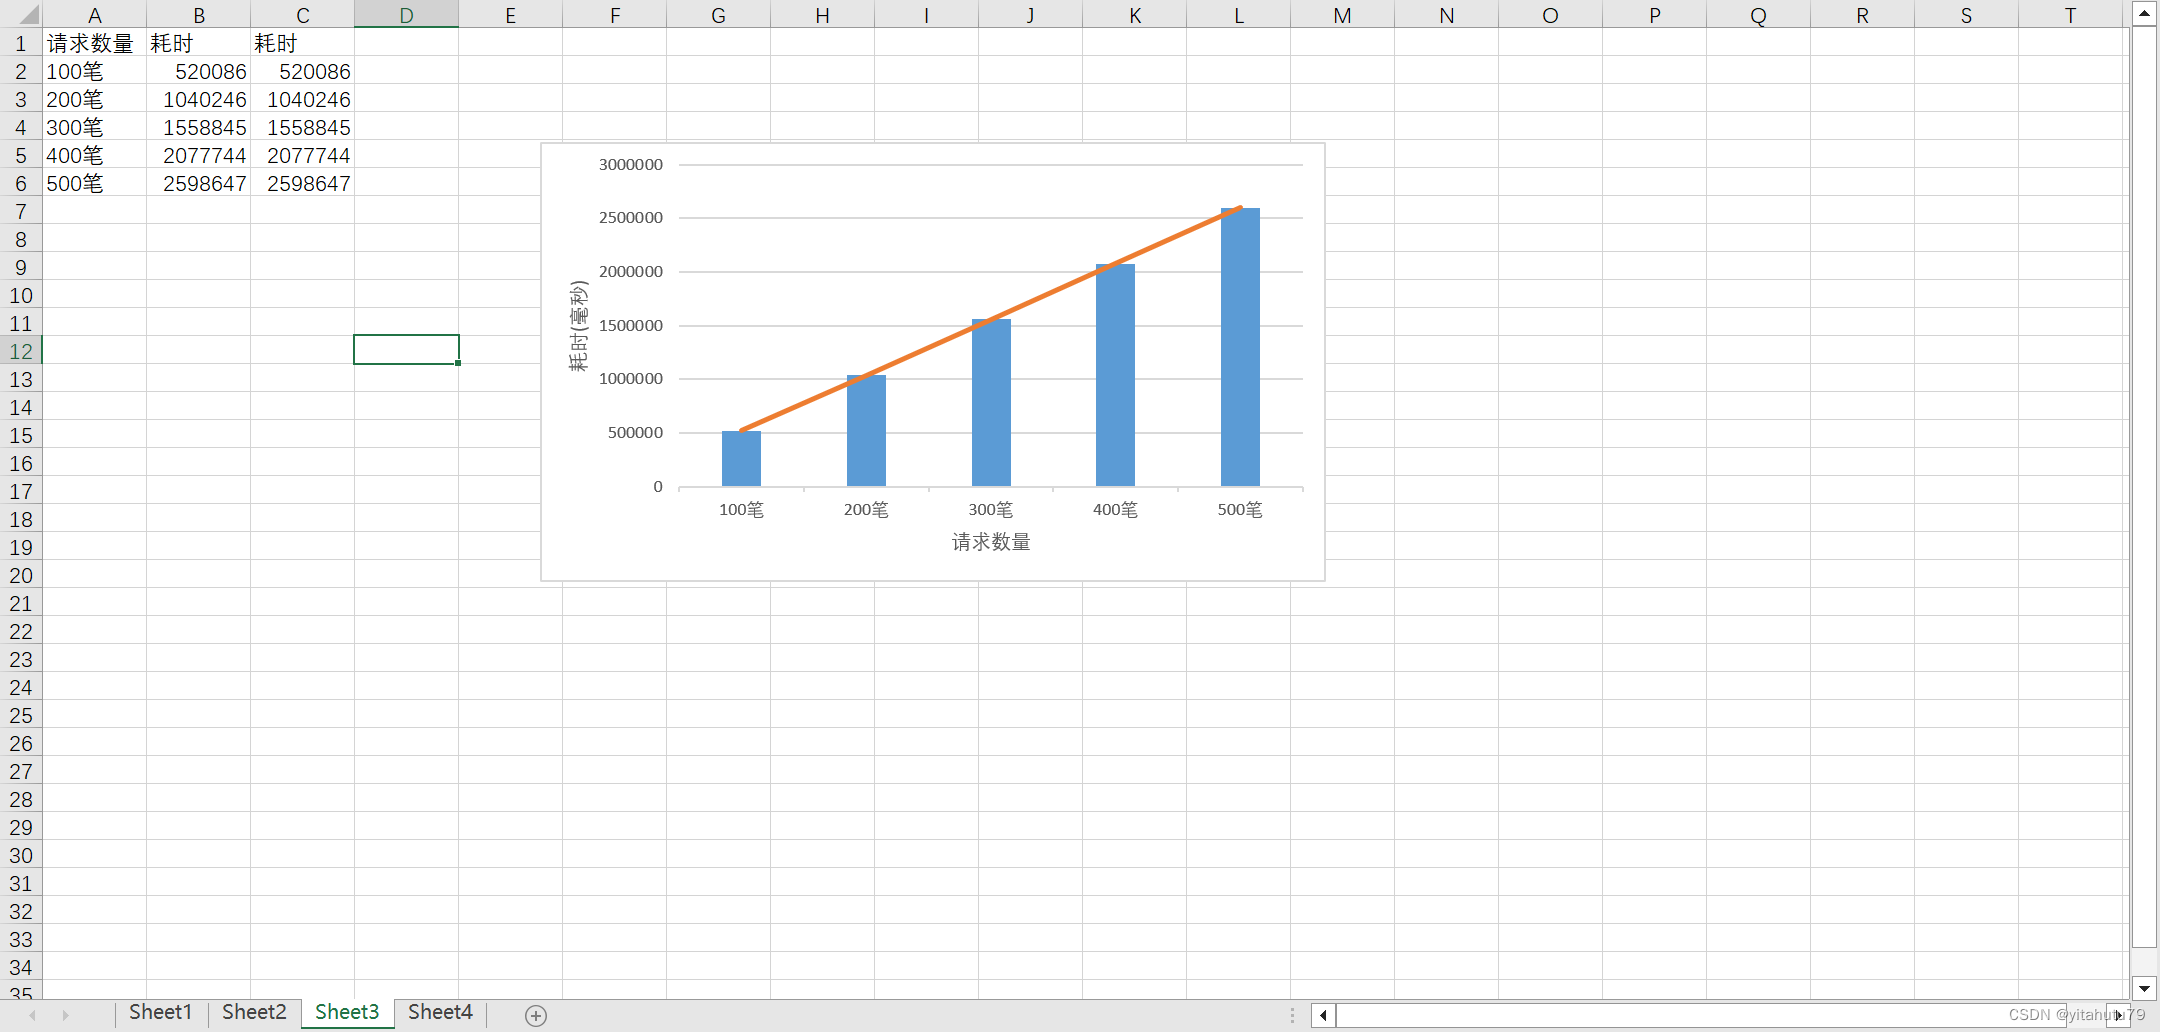
3.绘制柱状折线图
import pandas as pd
import numpy as np
import matplotlib.pyplot as plt

plt.rcParams['font.sans-serif']=['SimHei']
df = pd.read_excel(r"C:\Users\LiJie\Desktop\demo.xlsx",sheet_name='Sheet3')
x = plt.figure()
a = x.add_subplot(111)
a.bar(df["请求数量"],df["耗时"],color='lightskyblue')
plt.ylabel('耗时(ms)')
plt.xlabel('请求数量')
b = a.twinx()
b.plot(df["请求数量"],df["耗时"],color='r',marker='*')
plt.show()