1.下载 node_exporter
https://prometheus.io/download/
wget https://github.com/prometheus/node_exporter/releases/download/v1.4.0-rc.0/node_exporter-1.4.0-rc.0.linux-amd64.tar.gz

#node_exporter主要用来采集机器的性能指标数据,包括cpu,内存,磁盘,io等基本信息。
2. 解压运行 node_exporter
tar -xvf node_exporter-1.4.0-rc.0.linux-amd64.tar.gz -C /usr/local
cd /usr/local
mv node_exporter-1.4.0-rc.0.linux-amd64 node_exporter
/usr/local/node_exporter
nohup ./node_exporter &


./node_exporter --web.listen-address 10.2.1.231:9527
#node_exporter 默认使用端口9100,可以通过 --web.listen-address 指定监听的ip和端口
3.检查是否有监控数据输出
http://119.8.238.94:9100/metrics
#node_exporter 默认端口为 9100
4.prometheus 中添加主机监控
1)创建服务器监控动态配置文件
创建 /usr/local/prometheus/sd_config/host.yml 文件,并添加如下内容:
- targets: ['119.8.238.94:9100']
  labels:
    env: '订单库服务器'
    group: 'prd_mysql'
或者
- labels:
    service: host
    idc: su
    env: prd
  targets:
  - 119.8.238.94:9100
  - 119.8.238.95:9100
2)修改 prometheus 配置文件
- job_name: "host"
    file_sd_configs:
      - files: ['/usr/local/prometheus/sd_config/host.yml']
        refresh_interval: 120s
3)检查 prometheus 配置文件是否能正常读取
./promtool check config prometheus.yml4)动态调整 prometheus 配置
##启动时加上 --web.enable-lifecycle 参数,后期可以通过如下方式动态调整prometheus配置,动态调整方式如下:
curl -v --request POST 'http://localhost:9090/-/reload'
curl -X POST http://localhost:9090/-/reload
#如果启动时没有使用--web.enable-lifecycle,可以使用  kill -HUP pid 方案热加载
5.检查prometheus 中是否有新添加的instance
http://119.8.238.94:9090/
status->Targets


#如果有问题,可以在 nohup.out 日志中查看是否有相关报错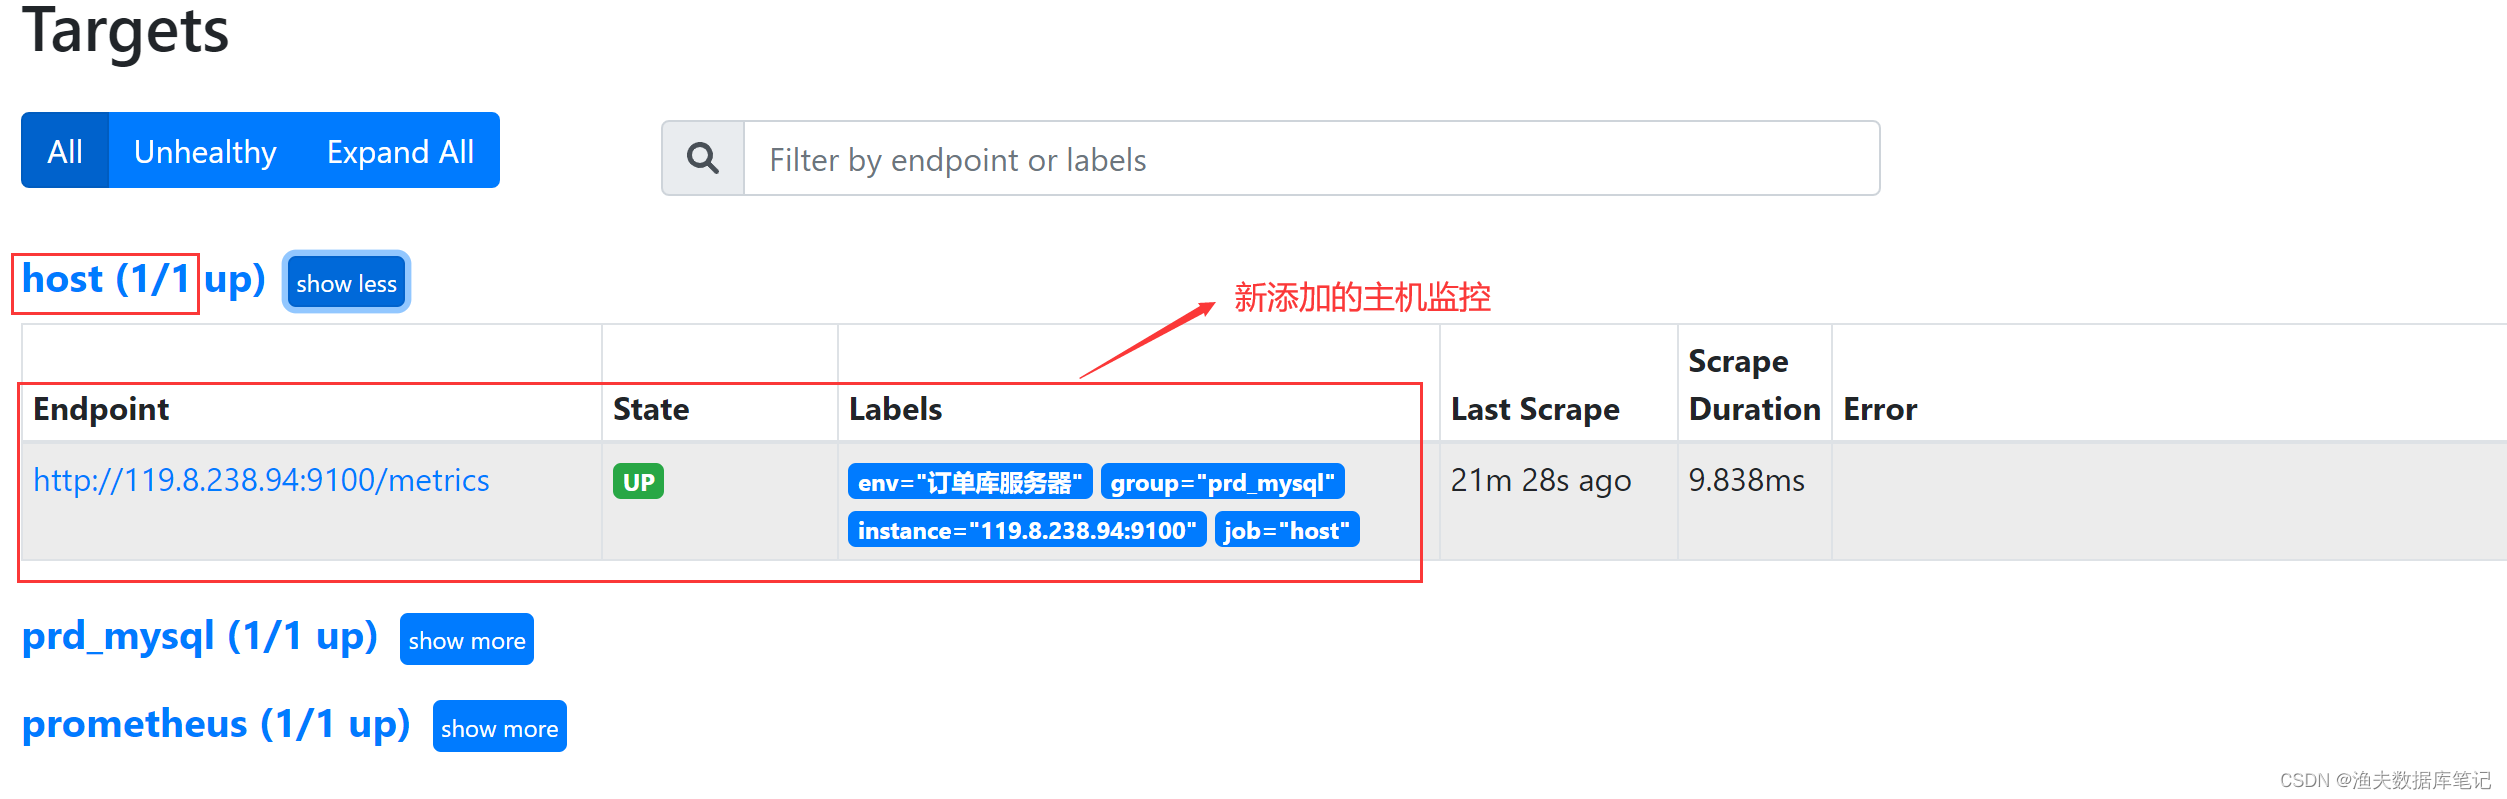
6. grafana 中添加 prometheus 数据源,并下载主机相关 dashboard
http://119.8.238.94:3000/1)grafana 添加数据源(如果数据源已添加该步忽略)
grafana 添加数据源方法,请参考
通过 Grafana 对prometheus 监控做可视化_渔夫数据库笔记的博客-CSDN博客
2)grafana 导入主机监控相关 dashboard(如果已导入该步骤忽略)
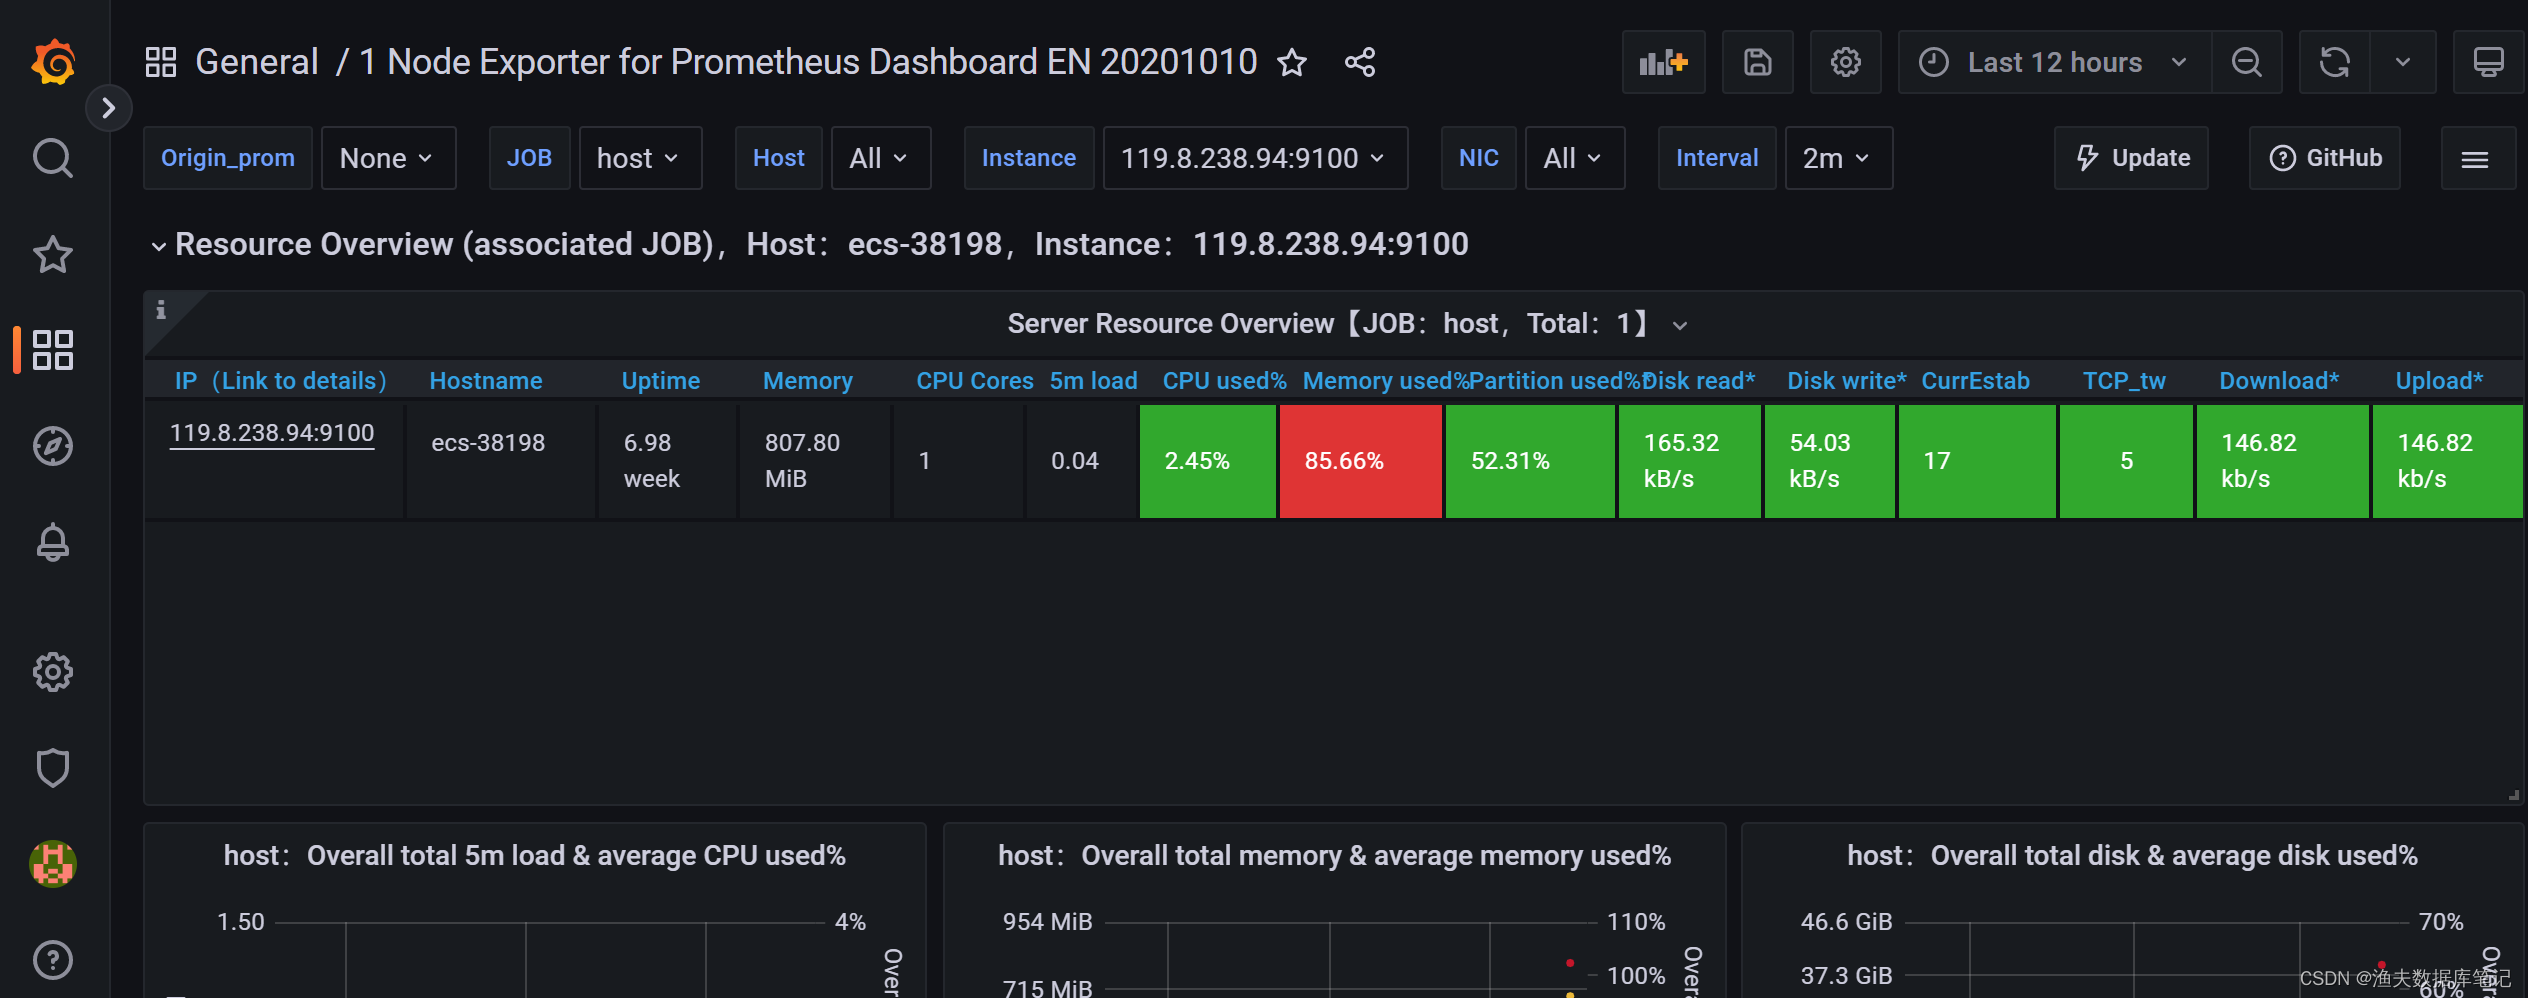
比如在线导入 11074 模板
3)11074 dashboard 模板导入后效果如下: