
作者 | Fengwen、BBuf
本文主要介绍在One-YOLOv5项目中计算mAP用到的一些numpy操作,这些numpy操作使用在utils/metrics.py中。本文是《YOLOv5全面解析教程④:目标检测模型精确度评估》的补充,希望能帮助到小伙伴们。
欢迎Star、试用One-YOLOv5:
https://github.com/Oneflow-Inc/one-yolov5
用到的numpy操作比如:np.cumsum()、np.interp()、np.maximum.accumulate()、np.trapz()等。接下来将在下面逐一介绍。
import numpy as npnp.cumsum()
返回元素沿给定轴的累积和。
numpy.cumsum(a, axis=None, dtype=None, out=None)源码(https://github.com/numpy/numpy/blob/v1.23.0/numpy/core/fromnumeric.py#L2497-L2571)
-
参数
-
a:数组
-
axis: 轴索引,整型,若a为n维数组,则axis的取值范围为[0,n-1]
-
dtype: 返回结果的数据类型,若不指定,则默认与a一致n
-
out: 数据类型为数组。用来放置结果的替代输出数组,它必须具有与输出结果具有相同的形状和数据缓冲区长度
-
返回
-
沿着指定轴的元素累加和所组成的数组,其形状应与输入数组a一致
更多信息请参阅读:
1.API_CN(https://www.osgeo.cn/numpy/reference/generated/numpy.cumsum.html?highlight=cumsum#numpy.cumsum)
2.API_EN(https://numpy.org/doc/stable/reference/generated/numpy.cumsum.html?highlight=cumsum#numpy.cumsum)
np.cumsum(a) # 计算累积和的轴。默认(无)是在展平的数组上计算cumsum。array([ 1, 3, 6, 10, 15, 21])
a = np.array([[1,2,3], [4,5,6]])
np.cumsum(a, dtype=float)     # 指定输出的特定的类型
array([ 1., 3., 6., 10., 15., 21.])
np.cumsum(a,axis=0) # 3列中每一列的行总和array([[1, 2, 3],
[5, 7, 9]])
x = np.ones((3,4),dtype=int)
np.cumsum( x ,axis=0)
array([[1, 1, 1, 1],
[2, 2, 2, 2],
[3, 3, 3, 3]])
np.cumsum(a,axis=1) # 2行中每行的列总和array([[ 1, 3, 6],
[ 4, 9, 15]])
np.interp()
-
参数
-
x: 数组待插入数据的横坐标
-
xp: 一维浮点数序列原始数据点的横坐标,如果period参数没有指定那么就必须是递增的 否则,在使用xp = xp % period正则化之后,xp在内部进行排序
-
fp: 一维浮点数或复数序列 原始数据点的纵坐标,和xp序列等长.
-
left: 可选参数,类型为浮点数或复数(对应于fp值) 当x < xp[0]时的插值返回值,默认为fp[0].
-
right: 可选参数,类型为浮点数或复数(对应于fp值),当x > xp[-1]时的插值返回值,默认为fp[-1].
-
period: None或者浮点数,可选参数横坐标的周期 此参数使得可以正确插入angular x-coordinates. 如果该参数被设定,那么忽略left参数和right参数
-
返回
-
浮点数或复数(对应于fp值)或ndarray. 插入数据的纵坐标,和x形状相同
注意!
在没有设置period参数时,默认要求xp参数是递增序列
# 插入一个值
import numpy as np
import matplotlib.pyplot as plt
x = 2.5
xp = [1, 2, 3]
fp = [3, 2, 0]
y = np.interp(x, xp, fp)  # 1.0
plt.plot(xp, fp, '-o')
plt.plot(x, y, 'x') # 画插值
plt.show()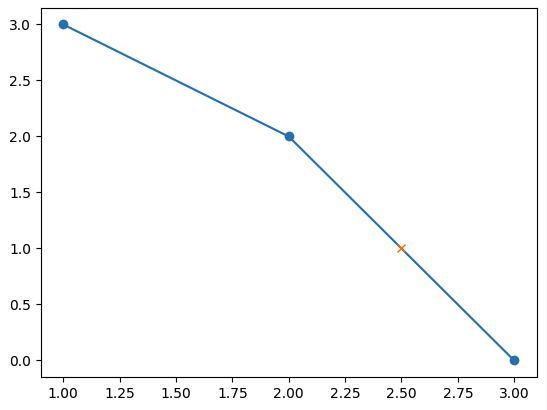
# 插入一个序列
import numpy as np
import matplotlib.pyplot as plt

x = [0, 1, 1.5, 2.72, 3.14]
xp = [1, 2, 3]
fp = [3, 2, 0]
y = np.interp(x, xp, fp)  # array([ 3. ,  3. ,  2.5 ,  0.56,  0. ])
plt.plot(xp, fp, '-o')
plt.plot(x, y, 'x')
plt.show()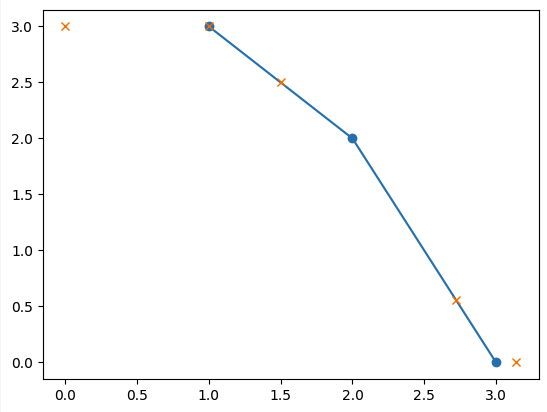
np.maximum.accumulate
计算数组(或数组的特定轴)的累积最大值
import numpy as np
d = np.random.randint(low = 1, high = 10, size=(2,3))
print("d:\n",d)
c = np.maximum.accumulate(d, axis=1)
print("c:\n",c)
d:
[[1 9 5]
[2 6 1]]
c:
[[1 9 9]
[2 6 6]]
np.trapz()
numpy.trapz(y, x=None, dx=1.0, axis=- 1) 使用复合梯形规则沿给定轴积分。
import matplotlib.pyplot as plt
import numpy as np
y = [1, 2, 3] ; x = [i+1 for i in range(len(y))]
print(np.trapz(x))
plt.fill_between(x, y)
plt.show() # (1 + 3)*(3 - 1)/2 = 4
4.0
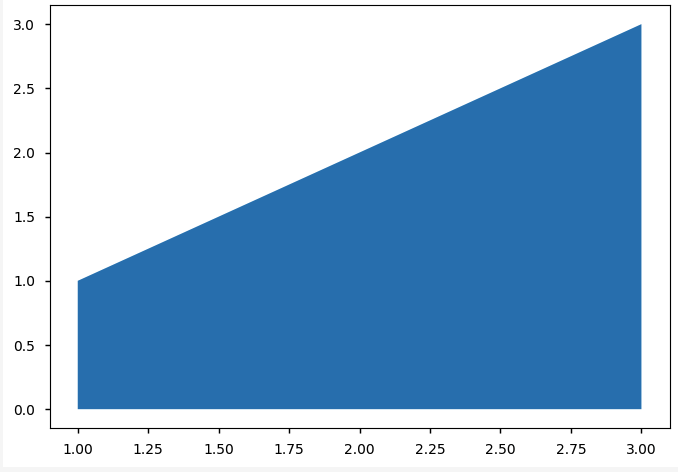
import matplotlib.pyplot as plt
import numpy as np
y = [1, 2, 3]
x = [4, 6, 8]
print(np.trapz(y,x))
plt.fill_between(x, y)
plt.show() # (3 + 1)*(8 - 4) / 2 = 8
8.0
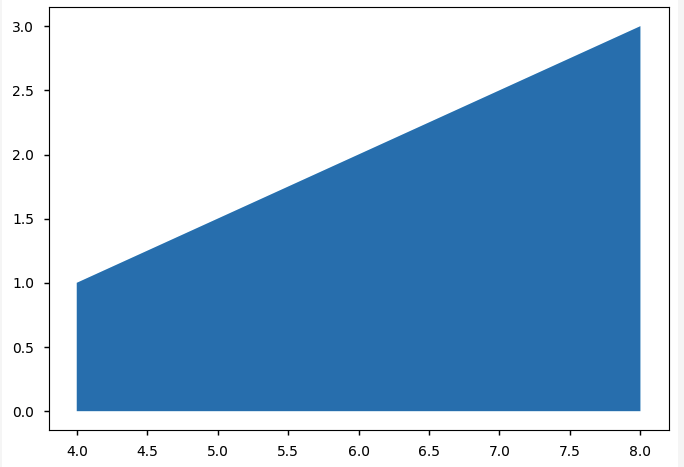
参考资料:
1. numpy API文档 CN:https://www.osgeo.cn/numpy/dev/index.html
2. numpy API文档 EN:https://numpy.org/doc/stable/reference/index.html
3. axis的基本使用:https://www.jb51.net/article/242067.htm
其他人都在看