代码自动生成器我之前也写过,和官方提供的各有优缺,这里这一期讲解一下官方版的咋用哈:
封面图

基本教程
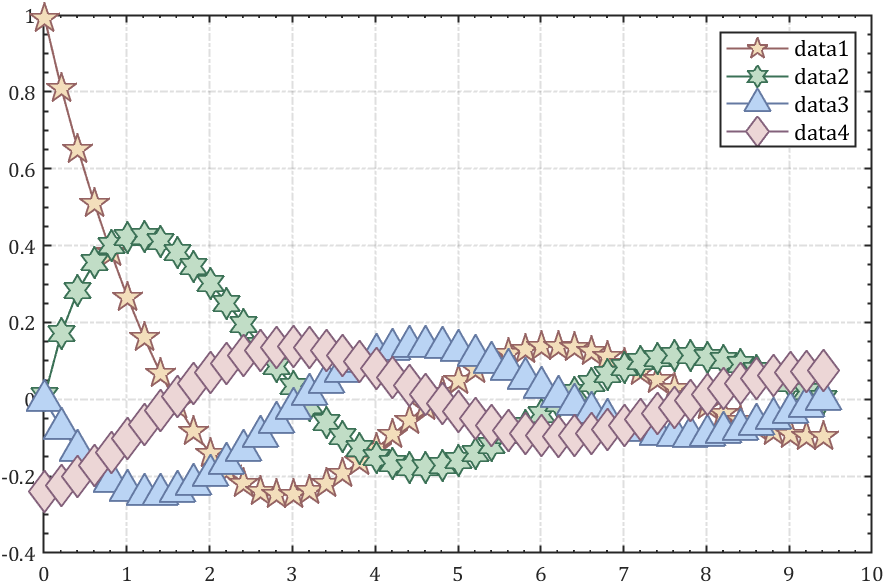
讲一下MATLAB自带的绘图代码生成器咋用哈,假如编写了如下代码:
t=0.01:0.2:3*pi;
hold on
plot(t,cos(t)./(1+t),'LineWidth',2)
plot(t,sin(t)./(1+t),'LineWidth',2)
plot(t,cos(t+pi/2)./(1+t+pi/2),'LineWidth',2)
plot(t,cos(t+pi)./(1+t+pi),'LineWidth',2)
legend

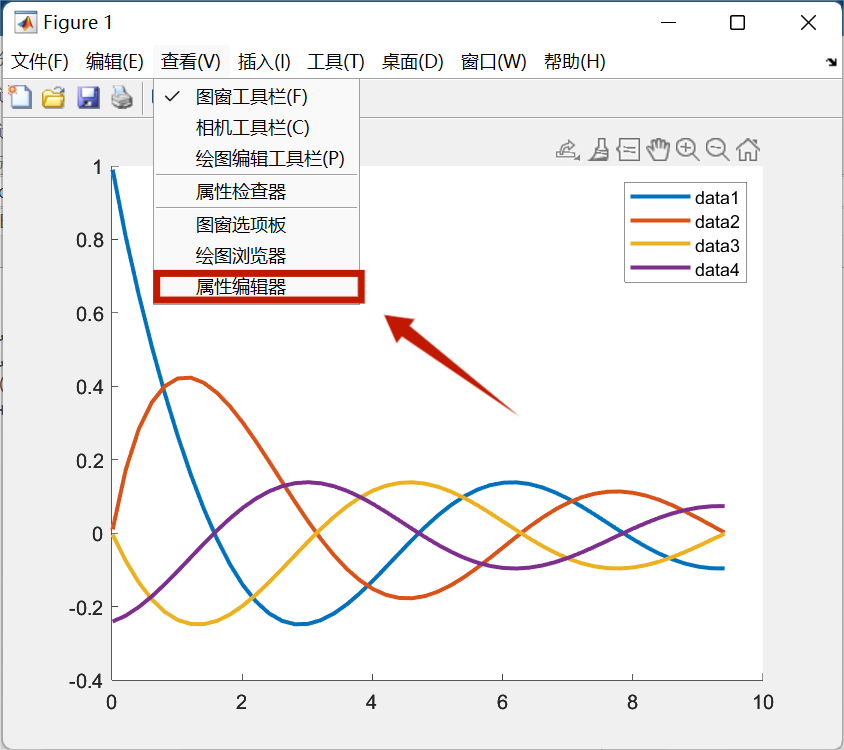
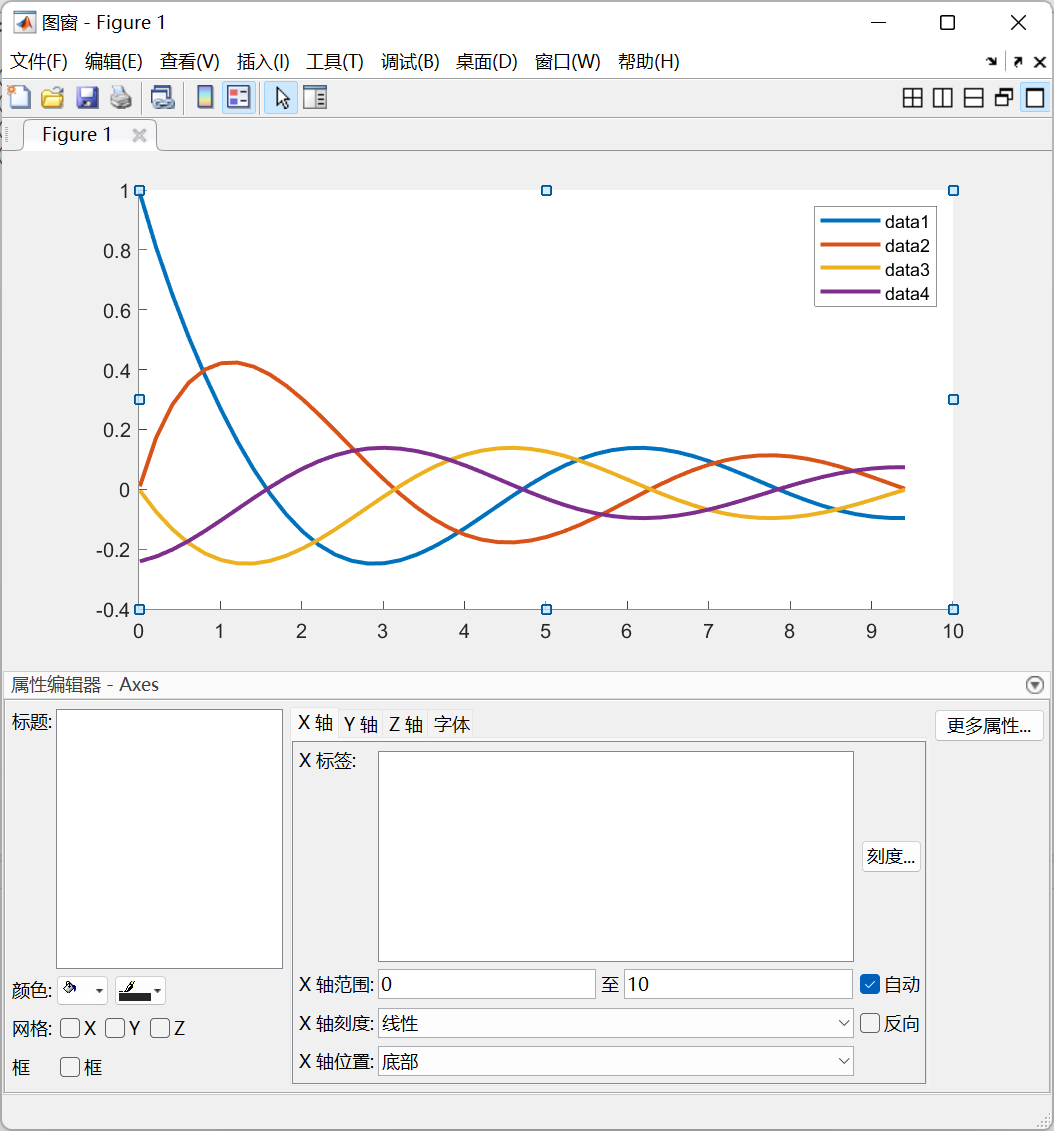
点击 查看→属性编辑器,即可进入属性编辑器,可以自由编辑图形对象的属性:
选中各个图形对象一通乱改即可:

点击 文件→生成代码,存储为绘图函数:
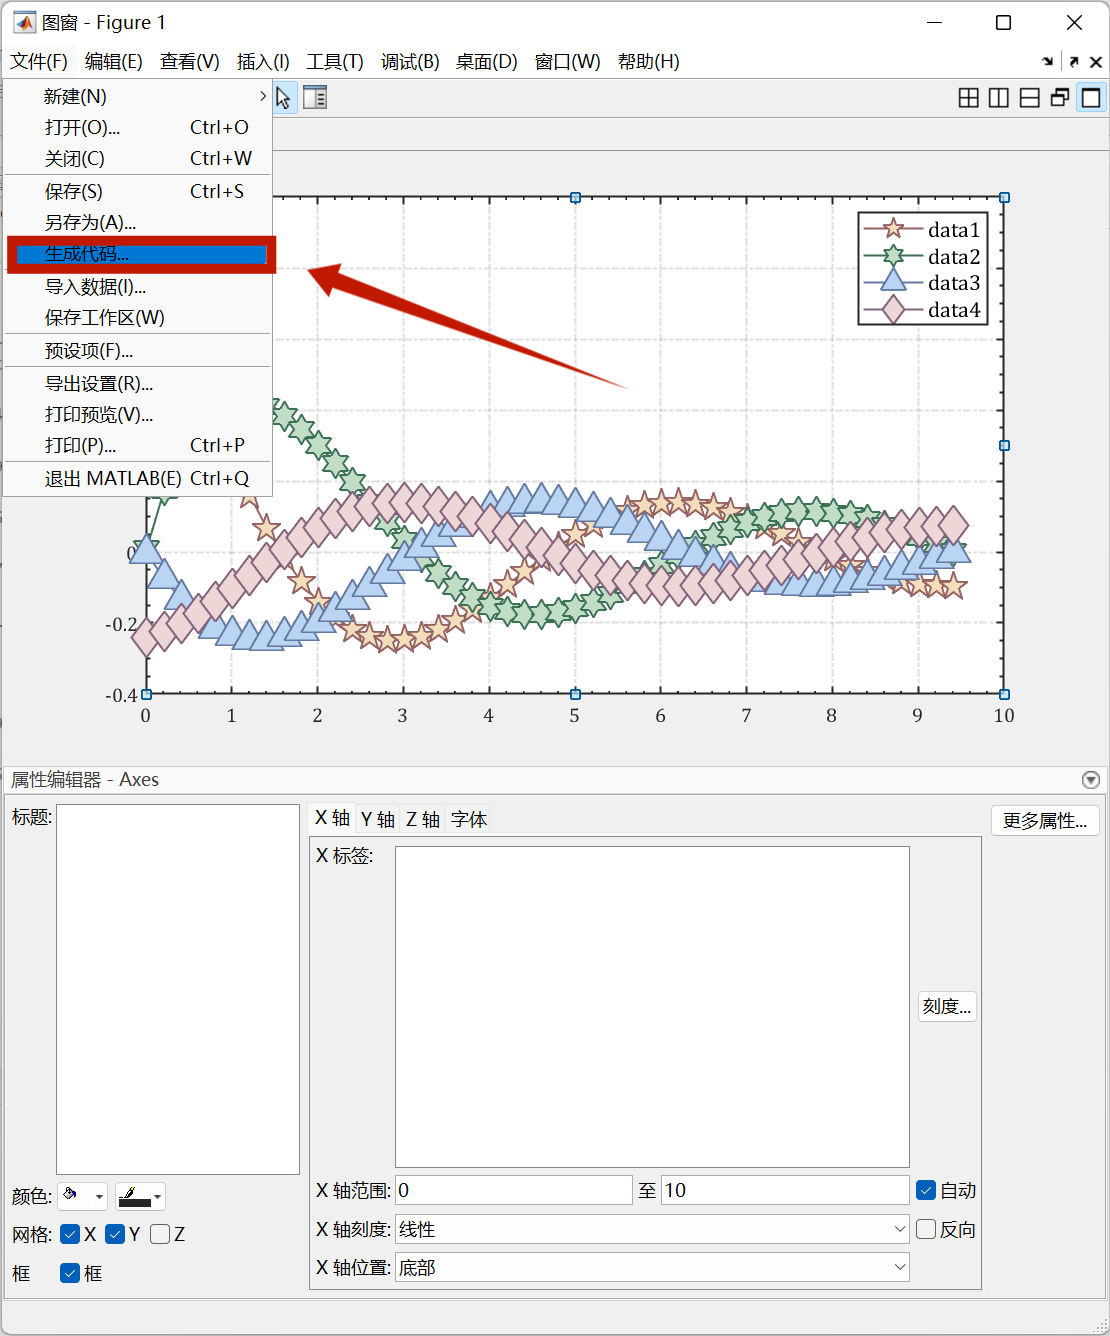
生成的代码长这样:
function createfigure(X1, YMatrix1)
%CREATEFIGURE(X1, YMatrix1)
%  X1:  plot x 数据的向量
%  YMATRIX1:  plot y 数据的矩阵

%  由 MATLAB 于 06-Feb-2023 00:20:41 自动生成

% 创建 figure
figure1 = figure;

% 创建 axes
axes1 = axes('Parent',figure1);
hold(axes1,'on');

% 使用 plot 的矩阵输入创建多个 line 对象
plot1 = plot(X1,YMatrix1,'MarkerSize',15,'LineWidth',1,'Parent',axes1);
set(plot1(1),...
    'MarkerFaceColor',[0.952941179275513 0.87058824300766 0.733333349227905],...
    'Marker','pentagram',...
    'Color',[0.584313750267029 0.388235300779343 0.388235300779343]);
set(plot1(2),...
    'MarkerFaceColor',[0.756862759590149 0.866666674613953 0.776470601558685],...
    'Marker','hexagram',...
    'Color',[0.23137255012989 0.443137258291245 0.337254911661148]);
set(plot1(3),...
    'MarkerFaceColor',[0.729411780834198 0.831372559070587 0.95686274766922],...
    'Marker','^',...
    'Color',[0.39215686917305 0.474509805440903 0.635294139385223]);
set(plot1(4),...
    'MarkerFaceColor',[0.925490200519562 0.839215695858002 0.839215695858002],...
    'Marker','diamond',...
    'Color',[0.513725519180298 0.380392163991928 0.482352942228317]);

box(axes1,'on');
hold(axes1,'off');
% 设置其余坐标区属性
set(axes1,'FontName','Cambria','GridLineStyle','-.','LineWidth',1,...
    'TickLength',[0.008 0.025],'XGrid','on','XMinorTick','on','YGrid','on',...
    'YMinorTick','on');
% 创建 legend
legend1 = legend(axes1,'show');
set(legend1,'FontSize',11);
可以另写个m文件调用,或者直接把调用这段代码的代码加在此文件最前面:
由于输入变量每组数据大小相同,因此直接就是以矩阵数据当作输入变量,每一列代表一组数据因此把之前的代码做如下改写:
t=0.01:0.2:3*pi;
t=t';

%  X1:  plot x 数据的向量
%  YMATRIX1:  plot y 数据的矩阵
X1=t;
YMatrix1=[cos(t)./(1+t),sin(t)./(1+t),cos(t+pi/2)./(1+t+pi/2),cos(t+pi)./(1+t+pi)];
createfigure(X1, YMatrix1)

不同数据长度
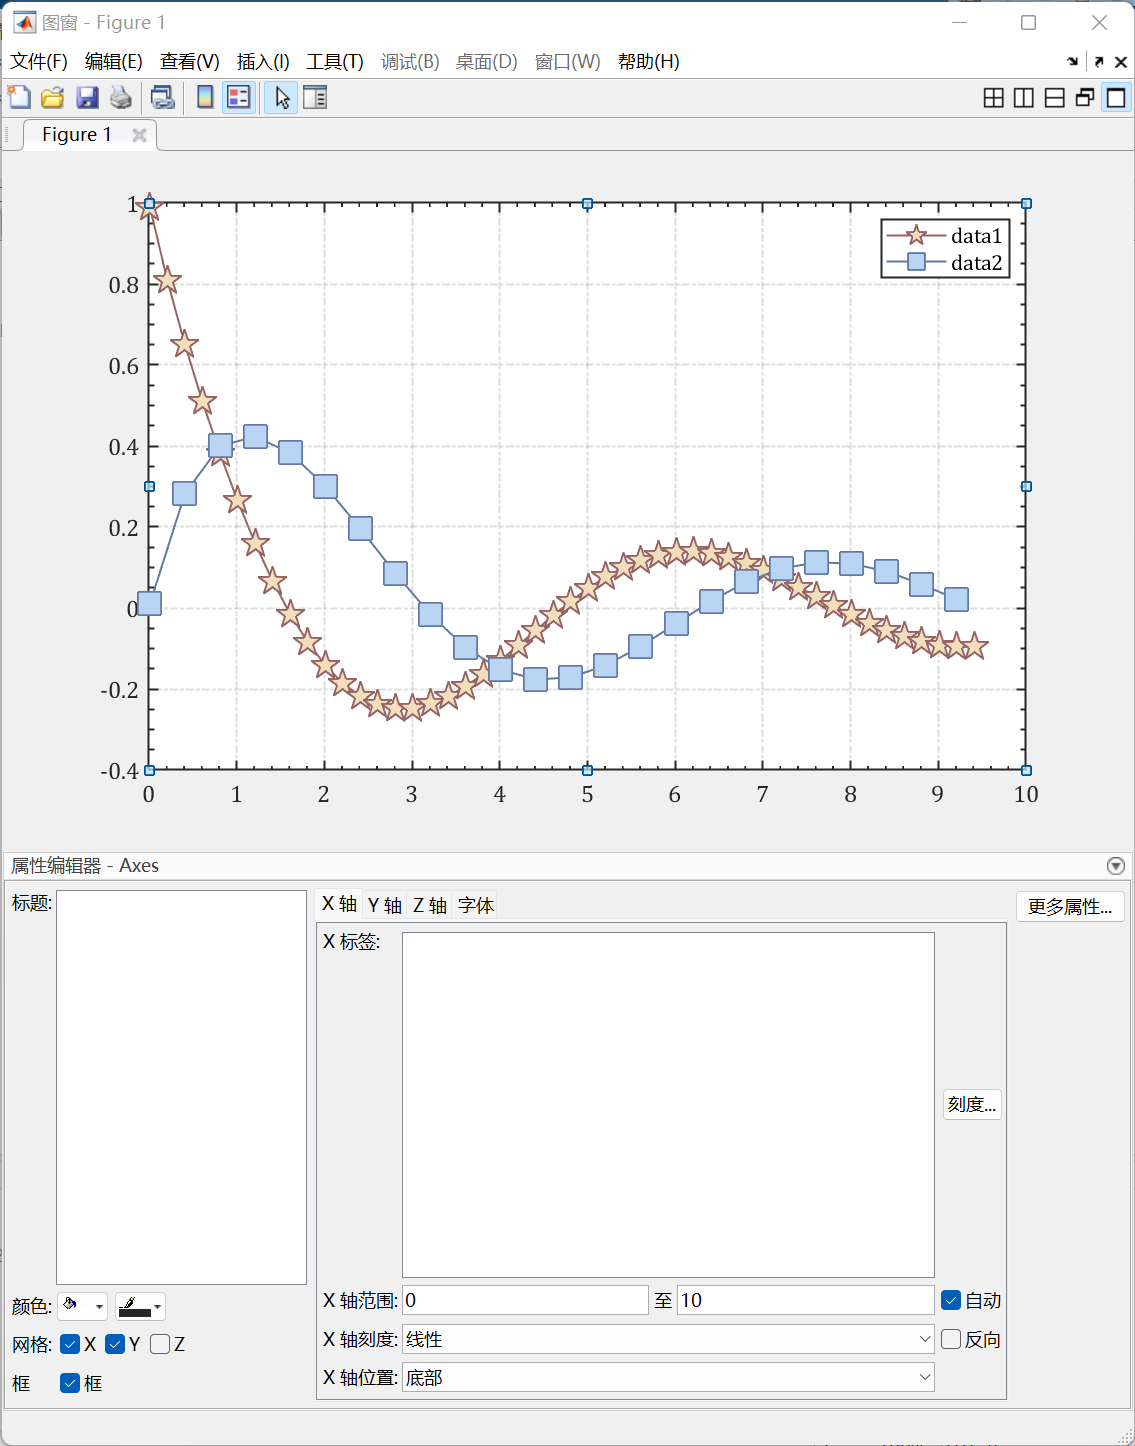
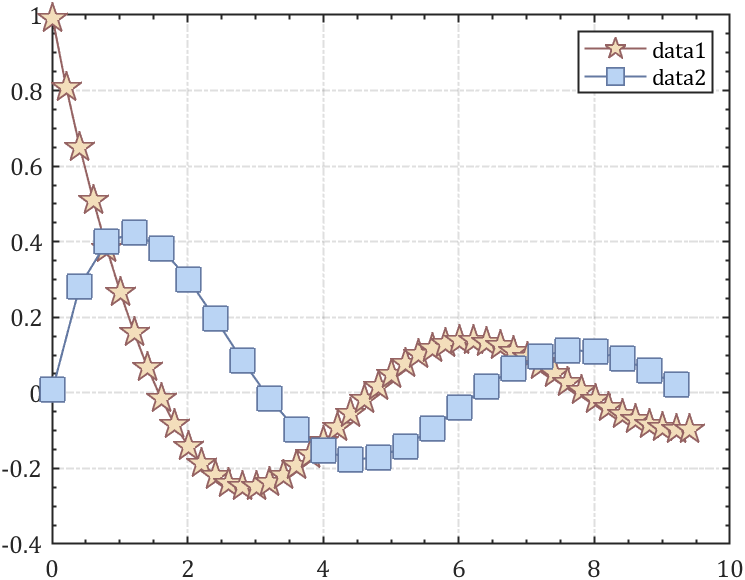
看了上面的教程很多人就会疑惑,嗯那万一每组数据不一样长咋办,也很简单,首先假设编写了如下代码:
t=0.01:0.2:3*pi;
t2=t(1:2:end);
hold on
plot(t,cos(t)./(1+t),'LineWidth',2)
plot(t2,sin(t2)./(1+t2),'LineWidth',2)
legend

进行修饰并生成代码:
function createfigure(X1, Y1, X2, Y2)
%CREATEFIGURE(X1, Y1, X2, Y2)
%  X1:  plot x 数据的向量
%  Y1:  plot y 数据的向量
%  X2:  plot x 数据的向量
%  Y2:  plot y 数据的向量

%  由 MATLAB 于 06-Feb-2023 01:11:27 自动生成

% 创建 figure
figure1 = figure;

% 创建 axes
axes1 = axes('Parent',figure1);
hold(axes1,'on');

% 创建 plot
plot(X1,Y1,...
    'MarkerFaceColor',[0.952941179275513 0.87058824300766 0.733333349227905],...
    'MarkerSize',15,...
    'Marker','pentagram',...
    'LineWidth',1,...
    'Color',[0.584313750267029 0.388235300779343 0.388235300779343]);

% 创建 plot
plot(X2,Y2,...
    'MarkerFaceColor',[0.729411780834198 0.831372559070587 0.95686274766922],...
    'MarkerSize',15,...
    'Marker','square',...
    'LineWidth',1,...
    'Color',[0.39215686917305 0.474509805440903 0.635294139385223]);

box(axes1,'on');
hold(axes1,'off');
% 设置其余坐标区属性
set(axes1,'FontName','Cambria','FontSize',12,'GridLineStyle','-.',...
    'LineWidth',1,'XGrid','on','XMinorTick','on','YGrid','on','YMinorTick','on');
% 创建 legend
legend(axes1,'show');
分成了X1,X2美滋滋:
t=0.01:0.2:3*pi;
t2=t(1:2:end);

createfigure(t,cos(t)./(1+t), t2,sin(t2)./(1+t2))
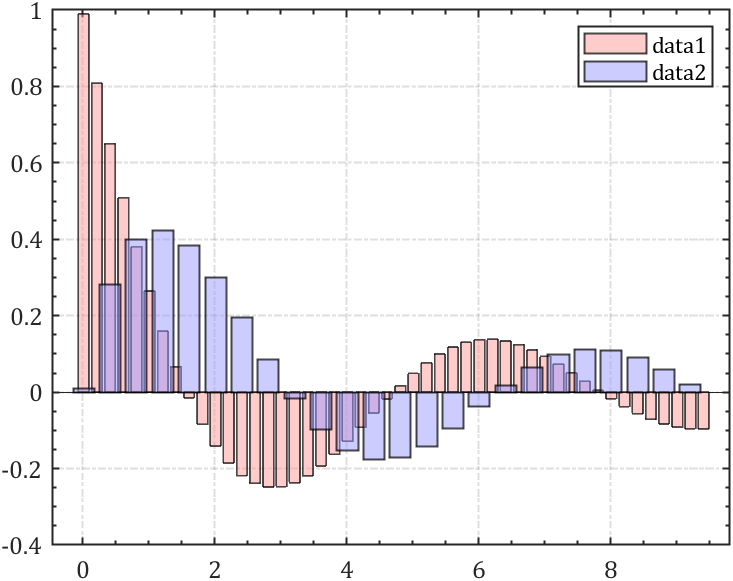
奇奇怪怪的area\bar
area函数bar函数这类本来就比较适合输入变量为矩阵的函数对于不等长的输入变量就极其不友好,尝试了多种输入变量构造格式,发现还是直接把生成函数改了比较方便(此处仅仅针对每组数据不等长情况,要是等长还是该咋画咋画):
假设编写了输入变量不等长基础绘图函数:
t=0.01:0.2:3*pi;
t2=t(1:2:end);
hold on
area(t,cos(t)./(1+t))
area(t2,sin(t2)./(1+t2))
legend
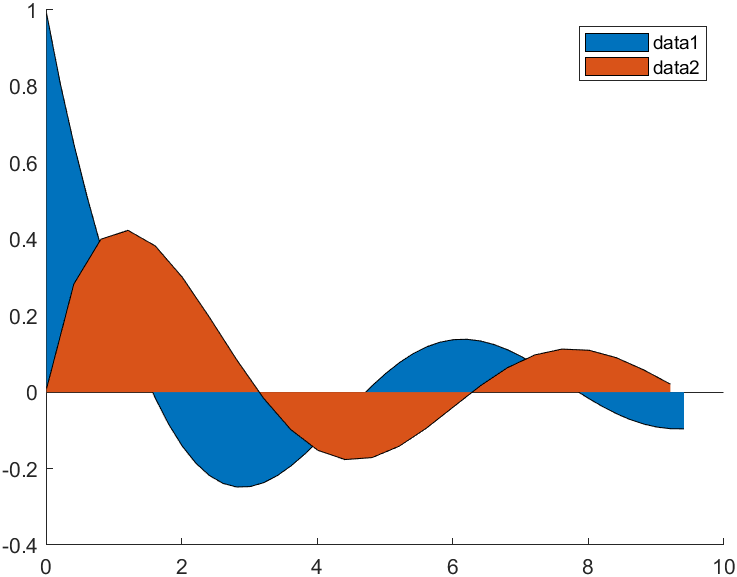
生成代码后发现并不像plot函数一样更多输入变量:
function createfigure(X1, ymatrix1)
%CREATEFIGURE(X1, ymatrix1)
%  X1:  area x
%  YMATRIX1:  area 矩阵数据

%  由 MATLAB 于 06-Feb-2023 00:53:40 自动生成

% 创建 figure
figure1 = figure;

% 创建 axes
axes1 = axes('Parent',figure1);
hold(axes1,'on');

% 使用 area 的矩阵输入创建多行
area1 = area(X1,ymatrix1,'FaceAlpha',0.5,'EdgeAlpha',0.7,'LineWidth',1);
set(area1(2),'FaceColor',[0.6 0.6 1]);
set(area1(1),'FaceColor',[1 0.6 0.6]);

box(axes1,'on');
hold(axes1,'off');
% 设置其余坐标区属性
set(axes1,'FontName','Cambria','FontSize',12,'GridLineStyle','-.',...
    'LineWidth',1,'XGrid','on','XMinorTick','on','YGrid','on','YMinorTick','on');
% 创建 legend
legend(axes1,'show');
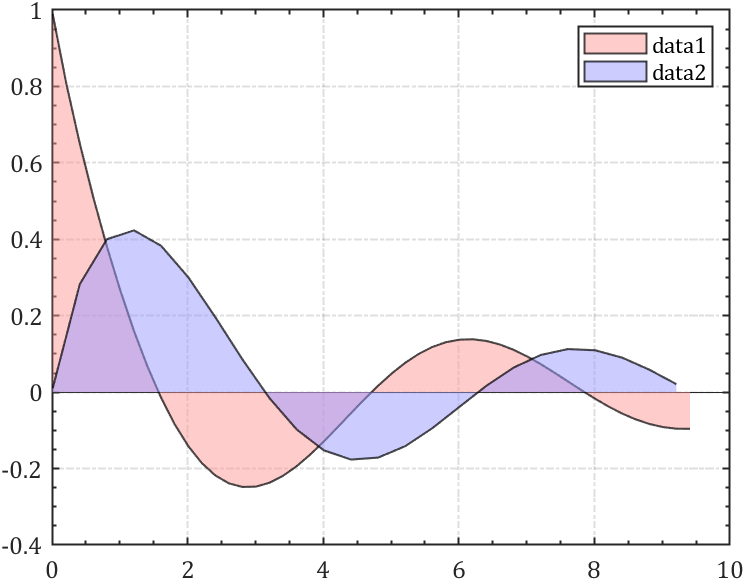
对其进行改写并调用(期待未来会发展的更好叭):
t=0.01:0.2:3*pi;
t2=t(1:2:end);
createfigure(t,cos(t)./(1+t),t2,sin(t2)./(1+t2))

function createfigure(X1,Y1,X2,Y2)
% 创建 figure
figure1 = figure;

% 创建 axes
axes1 = axes('Parent',figure1);
hold(axes1,'on');

% 使用 area 的矩阵输入创建多行
area1(1)= area(X1,Y1,'FaceAlpha',0.5,'EdgeAlpha',0.7,'LineWidth',1);
area1(2)= area(X2,Y2,'FaceAlpha',0.5,'EdgeAlpha',0.7,'LineWidth',1);
set(area1(2),'FaceColor',[0.6 0.6 1]);
set(area1(1),'FaceColor',[1 0.6 0.6]);

box(axes1,'on');
hold(axes1,'off');
% 设置其余坐标区属性
set(axes1,'FontName','Cambria','FontSize',12,'GridLineStyle','-.',...
    'LineWidth',1,'XGrid','on','XMinorTick','on','YGrid','on','YMinorTick','on');
% 创建 legend
legend(axes1,'show');
end
当然bar函数也是一样的改法:
t=0.01:0.2:3*pi;
t2=t(1:2:end);
createfigure(t,cos(t)./(1+t),t2,sin(t2)./(1+t2))

function createfigure(X1,Y1,X2,Y2)
% 创建 figure
figure1 = figure;

% 创建 axes
axes1 = axes('Parent',figure1);
hold(axes1,'on');

% 使用 bar 的矩阵输入创建多行
bar1(1) = bar(X1,Y1,'LineWidth',1,'FaceAlpha',0.5,'EdgeAlpha',0.7);
bar1(2) = bar(X2,Y2,'LineWidth',1,'FaceAlpha',0.5,'EdgeAlpha',0.7);
set(bar1(2),'FaceColor',[0.6 0.6 1]);
set(bar1(1),'FaceColor',[1 0.6 0.6]);

box(axes1,'on');
hold(axes1,'off');
% 设置其余坐标区属性
set(axes1,'FontName','Cambria','FontSize',12,'GridLineStyle','-.',...
    'LineWidth',1,'XGrid','on','XMinorTick','on','YGrid','on','YMinorTick','on');
% 创建 legend
legend(axes1,'show');
end
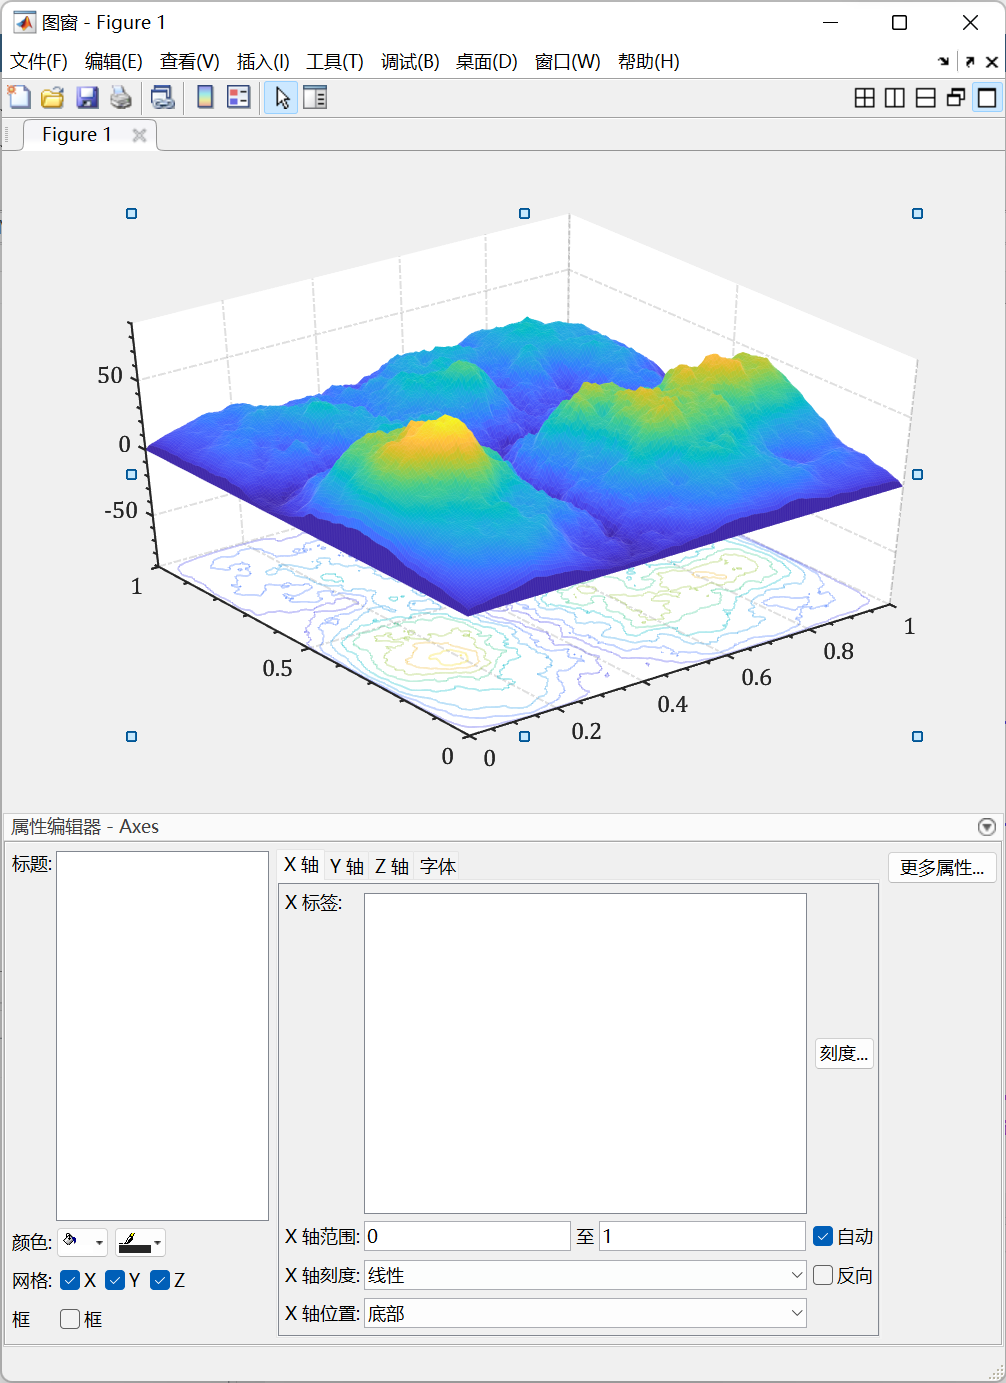
其他图形对象
随便举点例子,比如带等高线的曲面图:
X=linspace(0,1,200)';
CL=(-cos(X*2*pi)+1).^.2;
r=(X-.5)'.^2+(X-.5).^2;
surfc(X,X',abs(ifftn(exp(7i*rand(200))./r.^.9)).*(CL*CL')*30)

set(gca,'ZLim',[-90,90]);

修饰生成代码一气呵成:
function createfigure(xdata1, ydata1, zdata1)
%CREATEFIGURE(xdata1, ydata1, zdata1)
%  XDATA1:  surface xdata
%  YDATA1:  surface ydata
%  ZDATA1:  surface zdata

%  由 MATLAB 于 06-Feb-2023 01:33:59 自动生成

% 创建 figure
figure1 = figure;

% 创建 axes
axes1 = axes('Parent',figure1);
hold(axes1,'on');

% 创建 surf
surf(xdata1,ydata1,zdata1,'Parent',axes1,'EdgeAlpha',0.05,...
    'EdgeColor',[1 1 1]);

% 创建 contour
contour(xdata1,ydata1,zdata1,'LineWidth',1,'EdgeAlpha',0.3,...
    'ZLocation','zmin');

% 取消以下行的注释以保留坐标区的 Z 范围
zlim(axes1,[-90 90]);
view(axes1,[-37.5 39.2089494163424]);
grid(axes1,'on');
hold(axes1,'off');
% 设置其余坐标区属性
set(axes1,'Colormap',...
    [0.2422 0.1504 0.6603;0.2444 0.1534 0.6728;0.2464 0.1569 0.6847;0.2484 0.1607 0.6961;0.2503 0.1648 0.7071;0.2522 0.1689 0.7179;0.254 0.1732 0.7286;0.2558 0.1773 0.7393;0.2576 0.1814 0.7501;0.2594 0.1854 0.761;0.2611 0.1893 0.7719;0.2628 0.1932 0.7828;0.2645 0.1972 0.7937;0.2661 0.2011 0.8043;0.2676 0.2052 0.8148;0.2691 0.2094 0.8249;0.2704 0.2138 0.8346;0.2717 0.2184 0.8439;0.2729 0.2231 0.8528;0.274 0.228 0.8612;0.2749 0.233 0.8692;0.2758 0.2382 0.8767;0.2766 0.2435 0.884;0.2774 0.2489 0.8908;0.2781 0.2543 0.8973;0.2788 0.2598 0.9035;0.2794 0.2653 0.9094;0.2798 0.2708 0.915;0.2802 0.2764 0.9204;0.2806 0.2819 0.9255;0.2809 0.2875 0.9305;0.2811 0.293 0.9352;0.2813 0.2985 0.9397;0.2814 0.304 0.9441;0.2814 0.3095 0.9483;0.2813 0.315 0.9524;0.2811 0.3204 0.9563;0.2809 0.3259 0.96;0.2807 0.3313 0.9636;0.2803 0.3367 0.967;0.2798 0.3421 0.9702;0.2791 0.3475 0.9733;0.2784 0.3529 0.9763;0.2776 0.3583 0.9791;0.2766 0.3638 0.9817;0.2754 0.3693 0.984;0.2741 0.3748 0.9862;0.2726 0.3804 0.9881;0.271 0.386 0.9898;0.2691 0.3916 0.9912;0.267 0.3973 0.9924;0.2647 0.403 0.9935;0.2621 0.4088 0.9946;0.2591 0.4145 0.9955;0.2556 0.4203 0.9965;0.2517 0.4261 0.9974;0.2473 0.4319 0.9983;0.2424 0.4378 0.9991;0.2369 0.4437 0.9996;0.2311 0.4497 0.9995;0.225 0.4559 0.9985;0.2189 0.462 0.9968;0.2128 0.4682 0.9948;0.2066 0.4743 0.9926;0.2006 0.4803 0.9906;0.195 0.4861 0.9887;0.1903 0.4919 0.9867;0.1869 0.4975 0.9844;0.1847 0.503 0.9819;0.1831 0.5084 0.9793;0.1818 0.5138 0.9766;0.1806 0.5191 0.9738;0.1795 0.5244 0.9709;0.1785 0.5296 0.9677;0.1778 0.5349 0.9641;0.1773 0.5401 0.9602;0.1768 0.5452 0.956;0.1764 0.5504 0.9516;0.1755 0.5554 0.9473;0.174 0.5605 0.9432;0.1716 0.5655 0.9393;0.1686 0.5705 0.9357;0.1649 0.5755 0.9323;0.161 0.5805 0.9289;0.1573 0.5854 0.9254;0.154 0.5902 0.9218;0.1513 0.595 0.9182;0.1492 0.5997 0.9147;0.1475 0.6043 0.9113;0.1461 0.6089 0.908;0.1446 0.6135 0.905;0.1429 0.618 0.9022;0.1408 0.6226 0.8998;0.1383 0.6272 0.8975;0.1354 0.6317 0.8953;0.1321 0.6363 0.8932;0.1288 0.6408 0.891;0.1253 0.6453 0.8887;0.1219 0.6497 0.8862;0.1185 0.6541 0.8834;0.1152 0.6584 0.8804;0.1119 0.6627 0.877;0.1085 0.6669 0.8734;0.1048 0.671 0.8695;0.1009 0.675 0.8653;0.0964 0.6789 0.8609;0.0914 0.6828 0.8562;0.0855 0.6865 0.8513;0.0789 0.6902 0.8462;0.0713 0.6938 0.8409;0.0628 0.6972 0.8355;0.0535 0.7006 0.8299;0.0433 0.7039 0.8242;0.0328 0.7071 0.8183;0.0234 0.7103 0.8124;0.0155 0.7133 0.8064;0.0091 0.7163 0.8003;0.0046 0.7192 0.7941;0.0019 0.722 0.7878;0.0009 0.7248 0.7815;0.0018 0.7275 0.7752;0.0046 0.7301 0.7688;0.0094 0.7327 0.7623;0.0162 0.7352 0.7558;0.0253 0.7376 0.7492;0.0369 0.74 0.7426;0.0504 0.7423 0.7359;0.0638 0.7446 0.7292;0.077 0.7468 0.7224;0.0899 0.7489 0.7156;0.1023 0.751 0.7088;0.1141 0.7531 0.7019;0.1252 0.7552 0.695;0.1354 0.7572 0.6881;0.1448 0.7593 0.6812;0.1532 0.7614 0.6741;0.1609 0.7635 0.6671;0.1678 0.7656 0.6599;0.1741 0.7678 0.6527;0.1799 0.7699 0.6454;0.1853 0.7721 0.6379;0.1905 0.7743 0.6303;0.1954 0.7765 0.6225;0.2003 0.7787 0.6146;0.2061 0.7808 0.6065;0.2118 0.7828 0.5983;0.2178 0.7849 0.5899;0.2244 0.7869 0.5813;0.2318 0.7887 0.5725;0.2401 0.7905 0.5636;0.2491 0.7922 0.5546;0.2589 0.7937 0.5454;0.2695 0.7951 0.536;0.2809 0.7964 0.5266;0.2929 0.7975 0.517;0.3052 0.7985 0.5074;0.3176 0.7994 0.4975;0.3301 0.8002 0.4876;0.3424 0.8009 0.4774;0.3548 0.8016 0.4669;0.3671 0.8021 0.4563;0.3795 0.8026 0.4454;0.3921 0.8029 0.4344;0.405 0.8031 0.4233;0.4184 0.803 0.4122;0.4322 0.8028 0.4013;0.4463 0.8024 0.3904;0.4608 0.8018 0.3797;0.4753 0.8011 0.3691;0.4899 0.8002 0.3586;0.5044 0.7993 0.348;0.5187 0.7982 0.3374;0.5329 0.797 0.3267;0.547 0.7957 0.3159;0.5609 0.7943 0.305;0.5748 0.7929 0.2941;0.5886 0.7913 0.2833;0.6024 0.7896 0.2726;0.6161 0.7878 0.2622;0.6297 0.7859 0.2521;0.6433 0.7839 0.2423;0.6567 0.7818 0.2329;0.6701 0.7796 0.2239;0.6833 0.7773 0.2155;0.6963 0.775 0.2075;0.7091 0.7727 0.1998;0.7218 0.7703 0.1924;0.7344 0.7679 0.1852;0.7468 0.7654 0.1782;0.759 0.7629 0.1717;0.771 0.7604 0.1658;0.7829 0.7579 0.1608;0.7945 0.7554 0.157;0.806 0.7529 0.1546;0.8172 0.7505 0.1535;0.8281 0.7481 0.1536;0.8389 0.7457 0.1546;0.8495 0.7435 0.1564;0.86 0.7413 0.1587;0.8703 0.7392 0.1615;0.8804 0.7372 0.165;0.8903 0.7353 0.1695;0.9 0.7336 0.1749;0.9093 0.7321 0.1815;0.9184 0.7308 0.189;0.9272 0.7298 0.1973;0.9357 0.729 0.2061;0.944 0.7285 0.2151;0.9523 0.7284 0.2237;0.9606 0.7285 0.2312;0.9689 0.7292 0.2373;0.977 0.7304 0.2418;0.9842 0.733 0.2446;0.99 0.7365 0.2429;0.9946 0.7407 0.2394;0.9966 0.7458 0.2351;0.9971 0.7513 0.2309;0.9972 0.7569 0.2267;0.9971 0.7626 0.2224;0.9969 0.7683 0.2181;0.9966 0.774 0.2138;0.9962 0.7798 0.2095;0.9957 0.7856 0.2053;0.9949 0.7915 0.2012;0.9938 0.7974 0.1974;0.9923 0.8034 0.1939;0.9906 0.8095 0.1906;0.9885 0.8156 0.1875;0.9861 0.8218 0.1846;0.9835 0.828 0.1817;0.9807 0.8342 0.1787;0.9778 0.8404 0.1757;0.9748 0.8467 0.1726;0.972 0.8529 0.1695;0.9694 0.8591 0.1665;0.9671 0.8654 0.1636;0.9651 0.8716 0.1608;0.9634 0.8778 0.1582;0.9619 0.884 0.1557;0.9608 0.8902 0.1532;0.9601 0.8963 0.1507;0.9596 0.9023 0.148;0.9595 0.9084 0.145;0.9597 0.9143 0.1418;0.9601 0.9203 0.1382;0.9608 0.9262 0.1344;0.9618 0.932 0.1304;0.9629 0.9379 0.1261;0.9642 0.9437 0.1216;0.9657 0.9494 0.1168;0.9674 0.9552 0.1116;0.9692 0.9609 0.1061;0.9711 0.9667 0.1001;0.973 0.9724 0.0938;0.9749 0.9782 0.0872;0.9769 0.9839 0.0805],...
    'FontName','Cambria','FontSize',12,'GridLineStyle','-.','LineWidth',1,...
    'Projection','perspective','TickLength',[0.01 0.015],'XMinorTick','on',...
    'YMinorTick','on','ZMinorTick','on');
调用:
X=linspace(0,1,200)';
CL=(-cos(X*2*pi)+1).^.2;
r=(X-.5)'.^2+(X-.5).^2;
xdata1=X;
ydata1=X';
zdata1=abs(ifftn(exp(7i*rand(200))./r.^.9)).*(CL*CL')*30;
createfigure(xdata1, ydata1, zdata1)


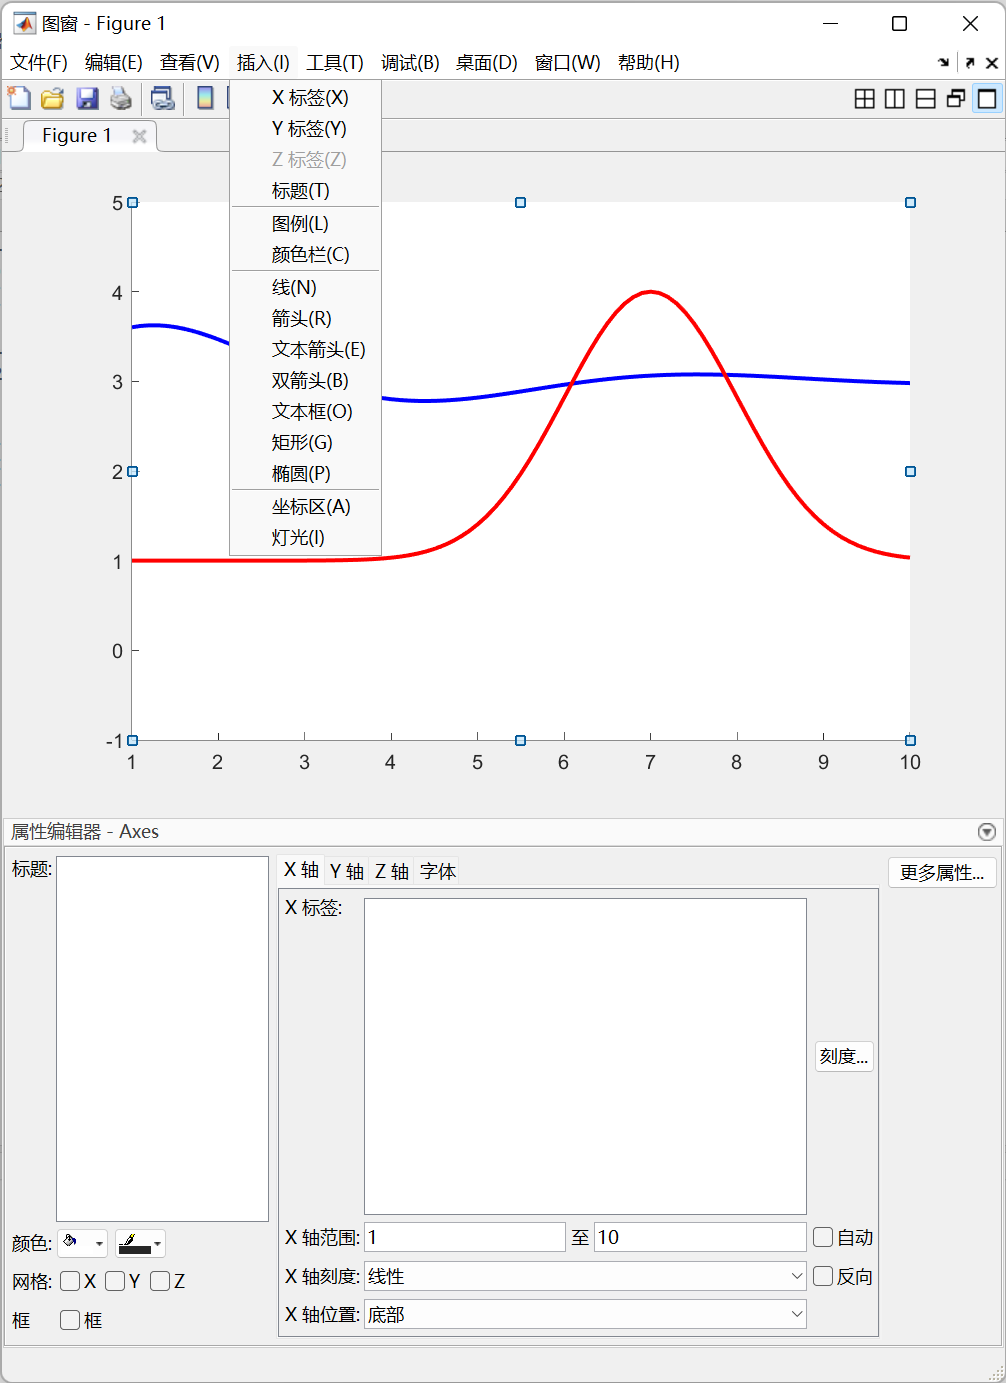
注释添加
添加的标注也能被添加到生成的代码中,简简单单举个例子:
x=1:0.1:10;
y1=sin(x).*exp(-x/3) + 3;
y2=3*exp(-(x-7).^2/2) + 1;
hold on
plot(x,y1,'b','LineWidth',2);
plot(x,y2,'r','LineWidth',2);

ax=gca;
ax.XLim=[1,10];
ax.YLim=[-1,5];

可以点击插入文本框,箭头啥的标注:
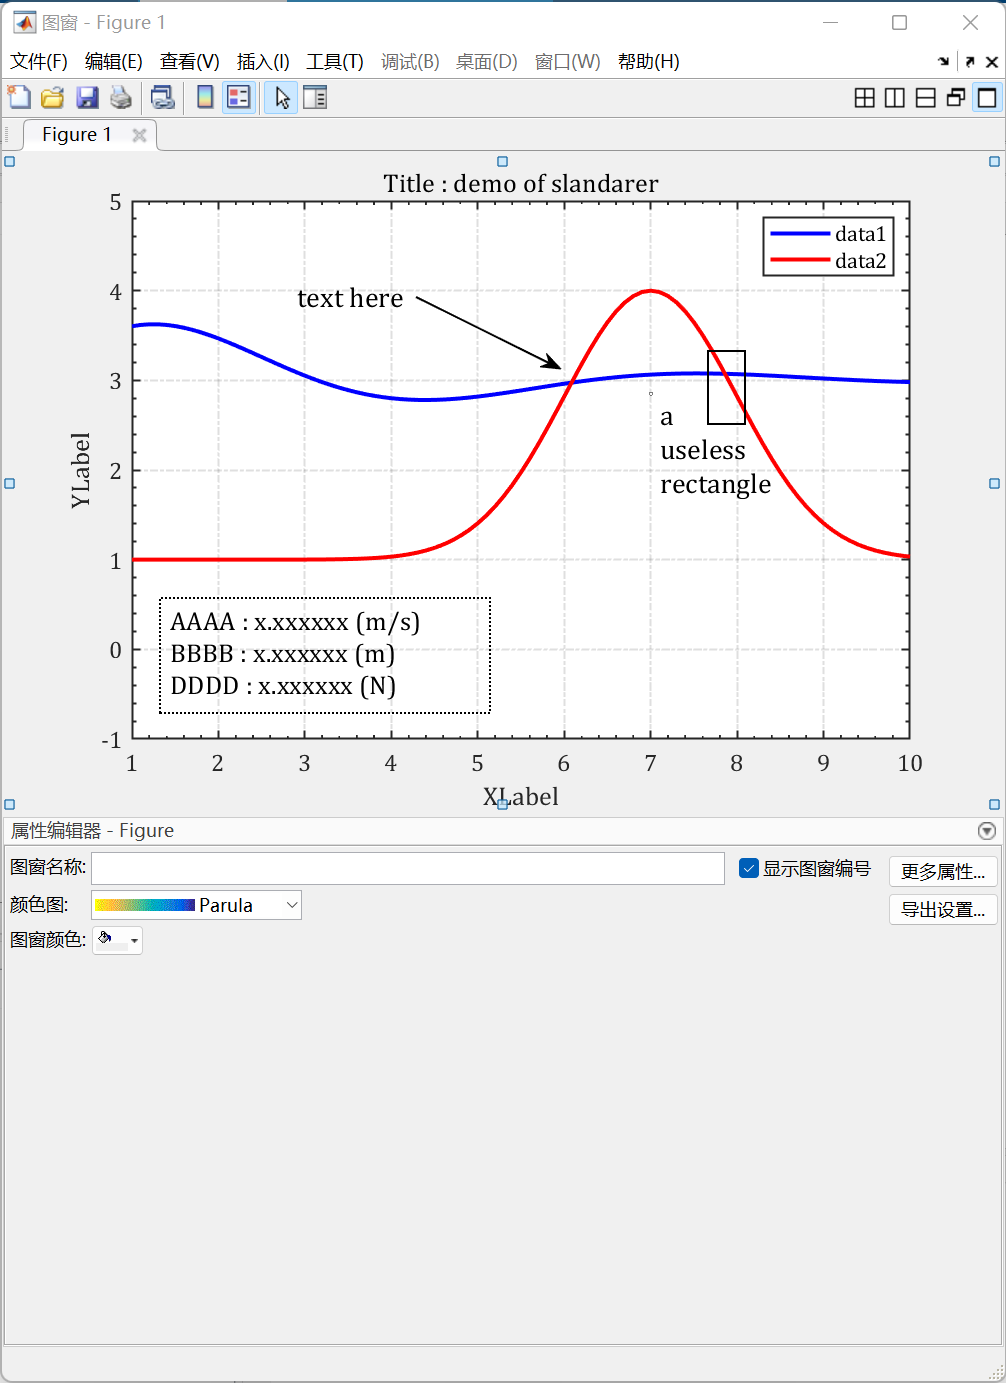
生成代码并调用:
function createfigure(X1, YMatrix1)
%CREATEFIGURE(X1, YMatrix1)
%  X1:  plot x 数据的向量
%  YMATRIX1:  plot y 数据的矩阵

%  由 MATLAB 于 06-Feb-2023 21:41:47 自动生成

% 创建 figure
figure1 = figure;

% 创建 axes
axes1 = axes('Parent',figure1);
hold(axes1,'on');

% 使用 plot 的矩阵输入创建多个 line 对象
plot1 = plot(X1,YMatrix1,'LineWidth',2);
set(plot1(1),'Color',[0 0 1]);
set(plot1(2),'Color',[1 0 0]);

% 创建 ylabel
ylabel('YLabel');

% 创建 xlabel
xlabel('XLabel');

% 创建 title
title('Title : demo of slandarer');

% 取消以下行的注释以保留坐标区的 X 范围
xlim(axes1,[1 10]);
% 取消以下行的注释以保留坐标区的 Y 范围
ylim(axes1,[-1 5]);
box(axes1,'on');
hold(axes1,'off');
% 设置其余坐标区属性
set(axes1,'FontName','Cambria','FontSize',12,'GridLineStyle','-.',...
    'LineWidth',1,'XGrid','on','XMinorTick','on','YGrid','on','YMinorTick','on');
% 创建 legend
legend(axes1,'show');

% 创建 textarrow
annotation(figure1,'textarrow',[0.412761714855434 0.557328015952144],...
    [0.779122541603631 0.670196671709531],'String','text here','LineWidth',1,...
    'FontSize',14,...
    'FontName','Cambria');

% 创建 rectangle
annotation(figure1,'rectangle',...
    [0.703891326021934 0.586989409984871 0.0368863409770688 0.110438729198186],...
    'LineWidth',1);

% 创建 textbox
annotation(figure1,'textbox',...
    [0.646061814556332 0.630862329803331 0.00199700897308086 0.00453857791225398],...
    'String',{

    'a useless rectangle'},...
    'FontSize',14,...
    'FontName','Cambria',...
    'FitBoxToText','off');

% 创建 textbox
annotation(figure1,'textbox',...
    [0.157530408773679 0.149773071104387 0.329009970089731 0.173978819969745],...
    'String',{

    'AAAA : x.xxxxxx (m/s)','BBBB : x.xxxxxx (m)','DDDD : x.xxxxxx (N)'},...
    'LineWidth',1,...
    'LineStyle',':',...
    'FontSize',13.2,...
    'FontName','Cambria',...
    'FitBoxToText','off');
x=1:0.1:10;
y1=sin(x).*exp(-x/3) + 3;
y2=3*exp(-(x-7).^2/2) + 1;

createfigure(x',[y1',y2'])
美滋滋:
