前言
之前做过一个需求是给echarts添加一个点击事件,当点击后与表格之类的进行数据联动。关于点击事件如何添加可以见:echarts常用配置、添加事件、添加自定义值
后来客户提出了一个优化项,就是当点击echarts图表后将点击的那个进行突出显示。当时一直没有思路,最近发现可以使用echarts提供的tooltip行为进行实现,详情见官方文档:action.tooltip
实现
demo
<template>
    <div id="demo"> </div>
    <el-button type="primary" @click="set">设置</el-button>
    <el-button type="primary" @click="cancel">取消</el-button>
</template>

<script setup lang="ts">
import {

     onMounted, ref } from 'vue';
import * as echarts from 'echarts';

const myChart = ref();

onMounted(() => {


    const chart = document.getElementById('demo');
    myChart.value = echarts.init(chart);
    const option = {


        tooltip: {


            trigger: 'axis',
            axisPointer: {


                type: 'shadow',
                shadowStyle: {


                    color: 'rgba(150,150,150,0.6)'
                }
            }
        },
        xAxis: {


            type: 'category',
            data: ['Mon', 'Tue', 'Wed', 'Thu', 'Fri', 'Sat', 'Sun']
        },
        yAxis: {


            type: 'value'
        },
        series: [
            {


                data: [150, 230, 224, 218, 135, 147, 260],
                type: 'line'
            },
            {


                data: [110, 230, 264, 280, 125, 147, 160],
                type: 'line'
            }
        ]
    };
    myChart.value.setOption(option);
});

// 设置第二个显示提示框
const set = () => {


    myChart.value.dispatchAction({


        type: 'showTip',
        seriesIndex: 0,
        dataIndex: 1
        // position: 'top'
    });
};
// 取消
const cancel = () => {


    // 隐藏 tooltip
    myChart.value.dispatchAction({

     type: 'hideTip' });
    // 隐藏 axisPointer
    myChart.value.dispatchAction({


        type: 'updateAxisPointer',
        currTrigger: 'leave'
    });
};
</script>

<style scoped>
#demo{


    width: 500px;
    height: 400px;
}
</style>
注意点:
myChart.value.dispatchAction({


    type: 'showTip',
    seriesIndex: 0,
    dataIndex: 1
    // position: 'top'
});
- seriesIndex ,series的下标,对应
options对象里的series,一般情况下写0就行。 - dataIndex,数据的下标
- position ,气泡显示的位置
效果图
问题
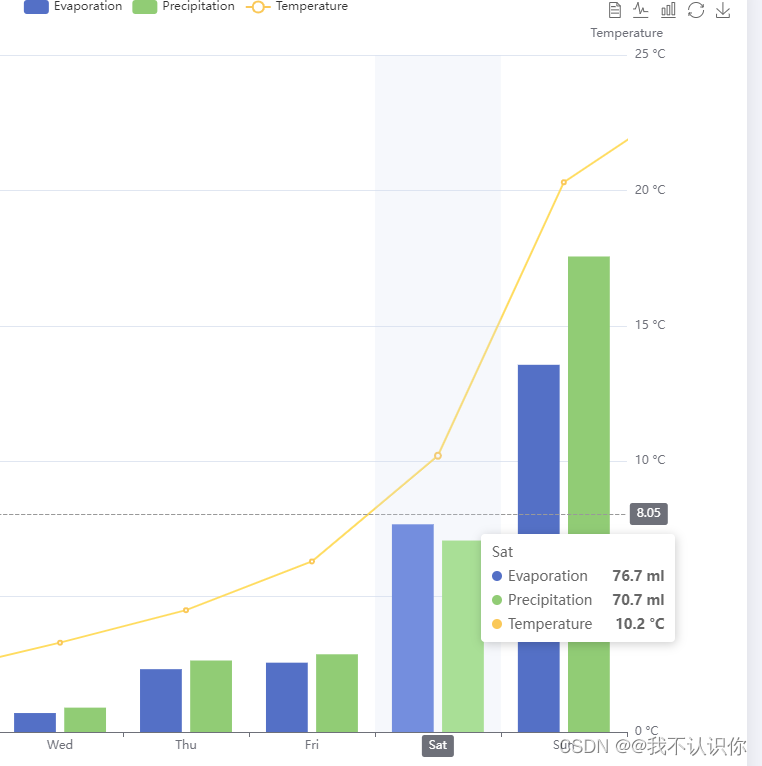
应该是我项目的问题,官方示例中,当鼠标移入后,气泡和阴影会同时显示,如下图。但是在demo中只有阴影显示了。如果将 trigger: 'axis',设置为 trigger: 'item',后
就只会显示气泡而不会显示阴影。
补充
可以通过定时器来实现一个轮播的效果,如下图: