1、演示效果
2、详细说明
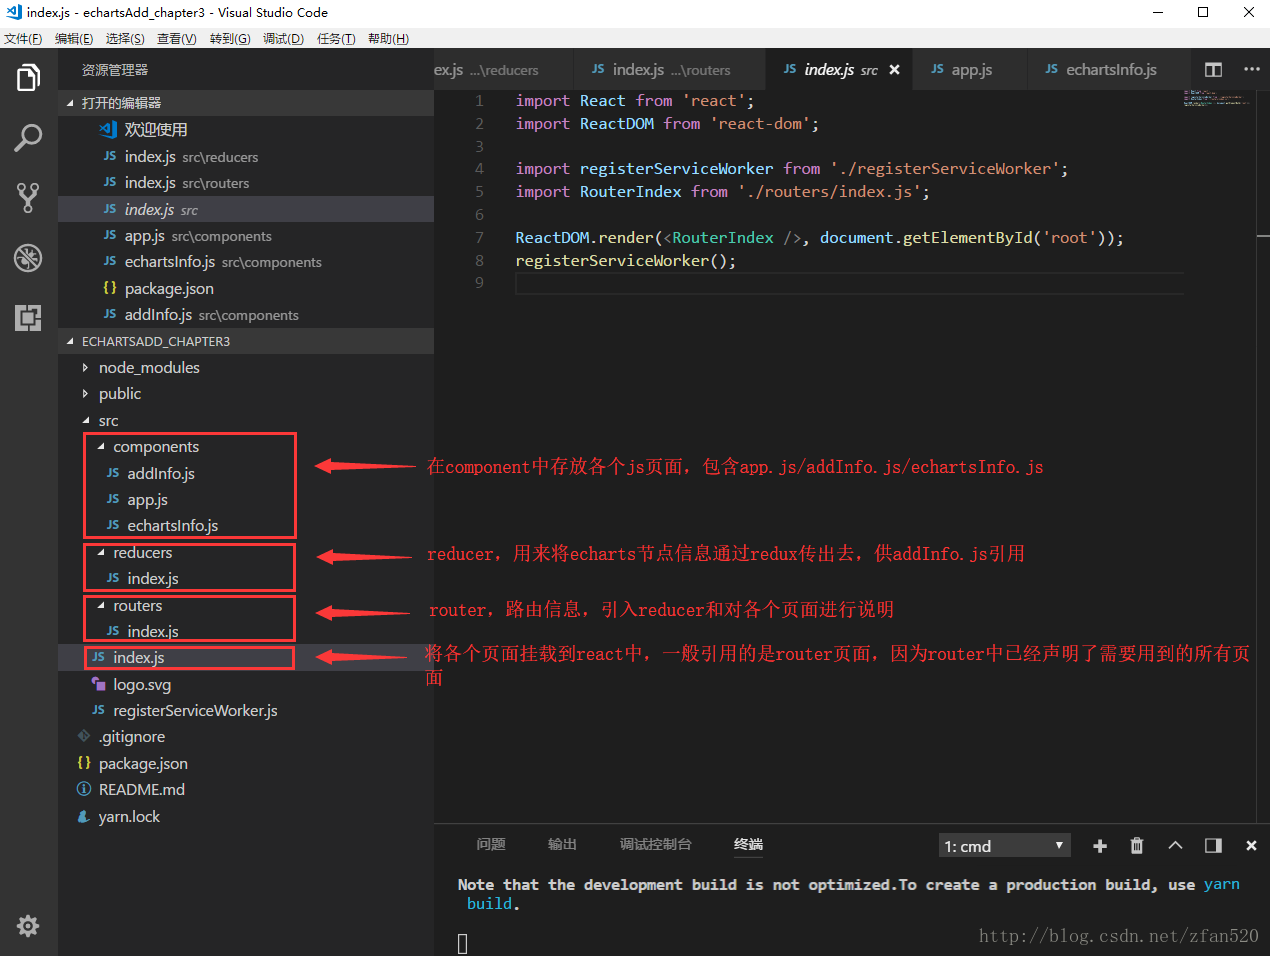
2.1 index.js引入路由信息
2.1.1 index.js加载ReactDOM
import React from 'react';
import ReactDOM from 'react-dom';

import registerServiceWorker from './registerServiceWorker';
//一般导入路由页面即可,注意import后面的名称第一个字母必须为大写
import RouterIndex from './routers/index.js';
//<引入名称 />表示以组件的形式挂载到ReactDOM当中
ReactDOM.render(<RouterIndex />, document.getElementById('root'));
registerServiceWorker();
2.1.2 routers中的index.js
import React, { Component } from 'react';
import { BrowserRouter } from 'react-router-dom';
import { createStore } from 'redux';
import { Provider } from 'react-redux';
//引入reducer页面
import Reducer from '../reducers/index.js';
//引入所使用的页面
import App from '../components/app.js';
//将reducer页面放入store中
const store = createStore(Reducer)
export default class RouterIndex extends Component {
    render() {
        return (
            //provider作为最好分发器,将store挂载到provider中,方便下面所引用的所有页面使用reducer存放的数据
            <Provider store={store}>
                <BrowserRouter>
                    <App path={'/App'} />
                </BrowserRouter>
            </Provider>
        )
    }
}
2.2父页面引入echarts和输入信息框
components中的app.js页面,详细说明请注意注释部分。
import React, { Component } from 'react';

import 'antd/dist/antd.css';  // Add
import { Layout, Card } from 'antd';
//子页面echartsInfo.js的引入
import EchartsInfo from './echartsInfo.js';
//子页面addInfo.js的引入
import AddInfo from './addInfo.js'
const {  Content, Sider } = Layout;

class App extends Component {
  constructor() {
    super()
    //定义需要用到的状态机
    this.state = {
      echartsoption: {
        ifAdd: false,
        selectName: '',
        selectIndex: -1,
        newcategory: -1,
        newname: ''
      }
    }
  }
  //定义添加节点信息的函数,供子页面addInfo.js调用传参
  handleAdd(sindex, sname, scategory, name, category) {
    this.setState({
      echartsoption: {
        ifAdd: true,
        selectIndex: sindex,
        selectName: sname,
        newcategory: category,
        newname: name,
      },
    })
  }

  render() {
    return (
        <Layout style={{ padding: '10px 0', background: '#fff' }}>
          <Sider width={700} style={{ background: '#fff', paddingLeft: '15px', paddingTop: '30px' }}>
            <Card>
              {/* EchartsInfo组件引用,同时将参数通过eventsOption传到echartsInfo中 */}
              <EchartsInfo eventsOption={this.state.echartsoption}></EchartsInfo>
            </Card>
          </Sider>
          <Content style={{ padding: '0 24px', minHeight: 280 }}>
           {/* AddInfo组件引用,同时将设定的函数通过handleAdd传到AddInfo中 */}
            <AddInfo handleAdd={this.handleAdd.bind(this)}></AddInfo>
          </Content>
      </Layout>
    );
  }
}
export default App;
2.3 Echarts呈现页面
components中的echartsInfo.js页面,详细说明请注意注释部分。
import React from 'react'
import echarts from 'echarts/lib/echarts' //必须
import 'echarts/lib/component/tooltip'
import 'echarts/lib/component/legend'

import 'echarts/lib/chart/graph'
import { connect } from 'react-redux';


class EchartsInfo extends React.Component {
  constructor(props) {
    super(props)
    this.initPie = this.initPie.bind(this);
    this.state = {
      //数据声明
      echartsdata: [
        { category: 0, name: "八年级数学知识结构体系" },
        { name: "三角形" },
        { name: "全等三角形" },
        { name: "轴对称" },
        { name: "整式的乘法与因式分解" },
        { name: "分式" },
        { name: "二次根式" },
        { name: "勾股定理" },
        { name: "平行四边形" },
        { name: "一次函数" },
        { name: "数据的分析" },
      ],
      //节点关系声明
      echartslinks: [
        { source: "八年级数学知识结构体系", target: "三角形" },
        { source: "八年级数学知识结构体系", target: "全等三角形" },
        { source: "八年级数学知识结构体系", target: "轴对称" },
        { source: "八年级数学知识结构体系", target: "整式的乘法与因式分解" },
        { source: "八年级数学知识结构体系", target: "分式" },
        { source: "八年级数学知识结构体系", target: "二次根式" },
        { source: "八年级数学知识结构体系", target: "勾股定理" },
        { source: "八年级数学知识结构体系", target: "平行四边形" },
        { source: "八年级数学知识结构体系", target: "一次函数" },
        { source: "八年级数学知识结构体系", target: "数据的分析" },
      ],
    }
  }
  initPie() {
    //定义数据格式
    var TestNodeOption = {
      animationDurationUpdate: 1500,
      animationEasingUpdate: 'quinticInOut',
      series: [
        {
          type: 'graph',
          zoom: 2,
          layout: 'force',
          hoverAnimation: true,
          name: 'graph',
          symbolSize: 30,
          roam: true,
          categories: [{
            name: '根节点',
            itemStyle: {
              normal: {
                color: "#009800", //颜色
              }
            }
          }, {
            name: '一级节点',
            itemStyle: {
              normal: {
                color: "#f2b368",
              }
            }
          }],
          // 节点标签
          label: {
            normal: {
              show: true,
              position: 'top',//设置label显示的位置
              // formatter: '{c}',//设置label读取的值为value
              textStyle: {
                fontSize: '12rem'
              },
            }
          },
          //放大程度
          force: {
            repulsion: 200
          },
          edgeSymbolSize: [4, 50],
          // 数据
          data: this.state.echartsdata,
          // 建立关系
          links: this.state.echartslinks,
        }],
    };
    var myChart = echarts.init(this.ID) //初始化echarts
    //通过父组件传过来的值
    var ifAdd = this.props.eventsOption.ifAdd
    var selectName = this.props.eventsOption.selectName
    var TimeFn = null
    /*     var dataFromDB = this.state.echartsdata
        var linksFromDB = this.state.echartslinks */
    //记录前一次选中的节点,未单击节点时先前选中节点信息为空
    var preSelectName = null;
    var preSelectCategory = null;
    //设置options,即加载数据,第一次加载的数据为上面定义的TestNodeOption
    if (myChart.getOption() === undefined) {
      myChart.setOption(TestNodeOption)
    }
    //之后的加载均在已有的数据的基础之上
    else myChart.setOption(myChart.getOption())
    //方便initpie中定义的函数使用this控制状态机
    var that = this;

    if (ifAdd) {
      addNode();
    }
    //************选中节点的添加事件**************
    function addNode() {
      let options = myChart.getOption();//获取已生成图形的Option param
      let nodesOption = options.series[0].data;//获得所有节点的数组
      let linksOption = options.series[0].links;//获得所有连接的数组
      //添加新节点的数据
      let newNode = {
        name: that.props.eventsOption.newname,//that相当于this,但用this会报错
        draggable: true,
        category: that.props.eventsOption.newcategory//that相当于this,但用this会报错
      }
      nodesOption.push(newNode);
      //添加新节点的链接信息
      let newLink = {
        source: selectName,
        target: newNode.name
      }
      linksOption.push(newLink);
      //对添加的节点信息进行加载
      myChart.setOption(options);
    }
    //**************************


    //************节点加载单击事件**************
    myChart.on('click', transIndex.bind(this))
    //单击事件,选中节点,并把节点信息通过reducer传出去
    function transIndex(param) {
      clearTimeout(TimeFn)
      TimeFn = setTimeout(() => {
        const { setEchartState } = this.props;
        let options = myChart.getOption();
        let nodesOption = options.series[0].data;
        //选中节点改变category-------
        for (let m in nodesOption) {
          if (preSelectName != null && preSelectName === nodesOption[m].name) {
            nodesOption[m].category = preSelectCategory;
          }
          if (nodesOption[m].name === param.data.name) {
            nodesOption[m].category = 1;
          }
        }
        if (preSelectName !== param.data.name) {
          preSelectName = param.data.name;
          preSelectCategory = param.data.category;
        }
        //将节点信息丢给reducer
        setEchartState({
          type: 'EchartsIndexName',
          payload: {
            index: param.dataIndex,
            name: param.data.name,
            knowid: param.data.knowid,
            category: param.data.category,
          }
        })
        //echarts加载修改后的数据
        myChart.setOption(options);
      }, 300)
    }
    //**************************

  }
  //初始化时加载的周期函数
  componentDidMount() {
    this.initPie()
  }


  //当shouldComponentUpdate返回为true是加载的更新函数
  componentDidUpdate() {
    this.initPie()
  }


  //当父页面传过来的props和已经接收过的props不一致以及上一次加载时的state和本次state不一致时,返回ture,否则返回false
  //返回结果,决定了是否调用componentDidUpdate周期函数
  shouldComponentUpdate(nextProps, nextState) {
    //根据子页面已有的props信息和再次传过来的props信息进行判断,若相同
    //再判断子页面上一次的state与本次修改后的state是否相同,若也相同,则无需进行componentDidUpdate操作
    //只要有一个不同,则需要加载componentDidUpdate,即更新操作
    return (nextProps.eventsOption !== this.props.eventsOption || nextState.echartsdata.length !== this.state.echartsdata.length);
  }
  render() {
    const { width = "100%", height = '700px' } = this.props
    return <div ref={ID => this.ID = ID} style={{ width, height }}></div>
  }
}
//reducer中固有的函数,获取reducer中的state
function mapStateToProps(state) {
  return {
  };
}

//reducer中固有的函数,向reducer中传递state,在store中保存
function mapDispatchToProps(dispatch) {
  return {
    setEchartState: (state) => dispatch(state)
  };
}

export default connect(
  mapStateToProps,
  mapDispatchToProps
)(EchartsInfo);
2.4 Reducer 获取节点信息以及存储
import { combineReducers } from 'redux'

  //定义函数reducer_echarts,对设置的状态进行匹配,若匹配成功,则存储为EchartsIndexName
  //否则仍然返回原先的state
  function reducer_echarts(state = {}, action) {
    switch (action.type) {
        case 'EchartsIndexName':
            return { EchartsIndexName: action.payload };
        default:
            return state;
    }
}

  export default combineReducers({
   reducer_echarts
})
2.5 添加节点信息页面
components中的addInfo.js页面,详细说明请注意注释部分。
import React, { Component } from 'react';
import { connect } from 'react-redux';
import 'antd/dist/antd.css';  // Add
import { Form, Input, Button, Card } from 'antd';

const FormItem = Form.Item;


class AddInfo extends Component {
  constructor(props) {
    super(props);
    this.state = {
      echartsoption: {
        selectName: '',
        selectIndex: -1,
        ifAdd: false,
        selectcategory: -1,
        newname:''
      }
  }
}
//利用状态机记录输入信息的名称
  changename(e) {
    this.setState({
      newname: e.target.value
    });
  }
//利用状态机记录输入信息的类别
  changecategory(e) {
    this.setState({
      newcategory: +e.target.value
    });
  }
  //单击节点时,调用app中传过来的函数,将对应的参数传至父组件,即app.js组件
  handleClick() {
    //获取reucer中的信息
    const { EchartsIndexName } = this.props;
    //利用this.props,调用app中handleAdd函数,将添加节点信息的值传过去
    this.props.handleAdd(EchartsIndexName.index,EchartsIndexName.name,EchartsIndexName.category,this.state.newname,this.state.category);
  }

  render() {
    return (
        <Card style={{ height: '750px', marginTop: '30px' }}>
            <Form style={{ paddingTop: '10px' }}>
              <FormItem
                label="知识点名称"
                labelCol={{ span: 4 }}
                wrapperCol={{ span: 8 }}
                hasFeedback
              >
                <Input onChange={this.changename.bind(this)} />
              </FormItem>
              <FormItem
                label="知识点类别"
                labelCol={{ span: 4 }}
                wrapperCol={{ span: 8 }}
                hasFeedback
              >
              <span><Input onChange={this.changecategory.bind(this)} />请输入0-9以内的数字</span>
              </FormItem>
              <FormItem>
                {/* 单击按钮触发handleClick事件*/}
                <Button type="primary" style={{ marginLeft: "100px" }} onClick={this.handleClick.bind(this)}>确定</Button>
              </FormItem>
            </Form>
        </Card>

    );
  }
}
AddInfo = Form.create()(AddInfo);

function mapStateToProps(state) {
  return {
    EchartsIndexName: state.reducer_echarts.EchartsIndexName
  };
}
function mapDispatchToProps(dispatch) {
  return {
  };
}
export default connect(
  mapStateToProps,
  mapDispatchToProps
)(AddInfo);
3、源码下载
源代码已放置在github中:https://github.com/shaolong88/echarts_add
如果有任何问题均可在博客中反馈。
4、结束语
其实在这篇博客之前,我写过一篇类似的博客,名称为“按钮实现echarts的添加与删除”,链接是http://blog.csdn.net/zfan520/article/details/78623272。在这篇博客中,我阐述了删除和添加两个操作,但有点冗余,这篇博客是我在经过反复精简之后所写,所以内容较为可以接受,但是里面还有一个问题,就是reduer和router还可以进一步的删减,这个后期我还会再次晚上,请大家关注gitlab中的源码即可。