文章目录
1、前言
本文介绍如何在 K8s 集群中为 PolarDB-X 数据库配置监控。
2、安装 PolarDB-X Monitor
PolarDB-X 通过 Prometheus 和 Grafana 来监控 PolarDB-X 集群。PolarDB-X Monitor 集成了 kube-promethus 组件栈,通过安装 PolarDB-X Monitor 即可一键部署监控所需的资源和组件。
1、前置要求
- 已经准备了一个运行中的 K8s 集群,并确保集群版本 >= 1.18.0
- 已经安装了 Helm 3
- 已经安装 PolarDB-X Operator 1.2.0 及以上的版本
2、Helm 包安装
首先创建一个名为 polardbx-monitor 的命名空间:
kubectl create namespace polardbx-monitor
安装 PolarDBXMonitor CRD:
注意:如果您的 PolarDB-X Operator 1.2.0 是通过 helm install 直接安装的,PolarDBXMonitor 的 CRD 会默认安装,可以跳过这步。如果您的 PolarDB-X Operator 是 从1.1.0 及以下的低版本通过 helm upgrade 升级而来,需要执行如下命令手工安装:
kubectl apply -f https://raw.githubusercontent.com/ApsaraDB/galaxykube/v1.1.0/charts/polardbx-operator/crds/polardbx.aliyun.com_polardbxmonitors.yaml
执行如下命令安装 PolarDB-X Monitor:
helm install --namespace polardbx-monitor polardbx-monitor polardbx-monitor-1.2.0.tgz
您也可以通过 PolarDB-X 的 Helm Chart 仓库安装:
helm repo add polardbx https://polardbx-charts.oss-cn-beijing.aliyuncs.com
helm install --namespace polardbx-monitor polardbx-monitor polardbx/polardbx-monitor
注:通过这种方式安装 Prometheus 和 Grafana 采用的都是默认配置便于快速体验。如果部署在生产集群,你可以参考: 配置 Prometheus + Grafana
注:如果您是在 minikube 上安装 PolarDB-X Monitor, 可能会因为资源不够导致组件无法创建,可以参考: 配置 Prometheus + Grafana
期望看到如下输出:
polardbx-operator monitor plugin is installed. Please check the status of components:

    kubectl get pods --namespace {

    {

     .Release.Namespace }}

Now start to monitor your polardbx cluster.
PolarDB-X Monitor 安装完成后,会在您 K8s 集群的 polardbx-monitor 命名空间下创建 prometheus 和 grafana 等组件,以此来监控 K8s 内的 PolarDB-X,通过如下命令检查相关组件是否正常,确认所有的 pod 都处于 Running 状态。
kubectl get pods -n polardbx-monitor
3、创建PolarDBXMonitor对象
PolarDB-X 集群的监控采集功能默认是关闭的,需要为您需要监控的 PolarDBXCluster 创建 PolarDBXMonitor对象进行开启。
kubectl apply -f polardbx-monitor.yaml
其中 polardbx-monitor.yaml 的yaml 描述如下:
apiVersion: polardbx.aliyun.com/v1
kind: PolarDBXMonitor
metadata:
  name: quick-start-monitor
spec:
  clusterName: quick-start
  monitorInterval: 30s
  scrapeTimeout: 10s
- spec.clusterName: 需要开启监控的 PolarDB-X 集群名称
- spec.monitorInterval: 监控数据采集频率,默认30s
- spec.scrapeTimeout: 监控数据采集的超时时间,默认10s。注意:scrapeTimeout 的值需要小于 monitorInterval
4、访问 Grafana Dashboard
默认情况下执行如下命令将 Grafana 端口转发到本地:
kubectl port-forward svc/grafana -n polardbx-monitor 3000
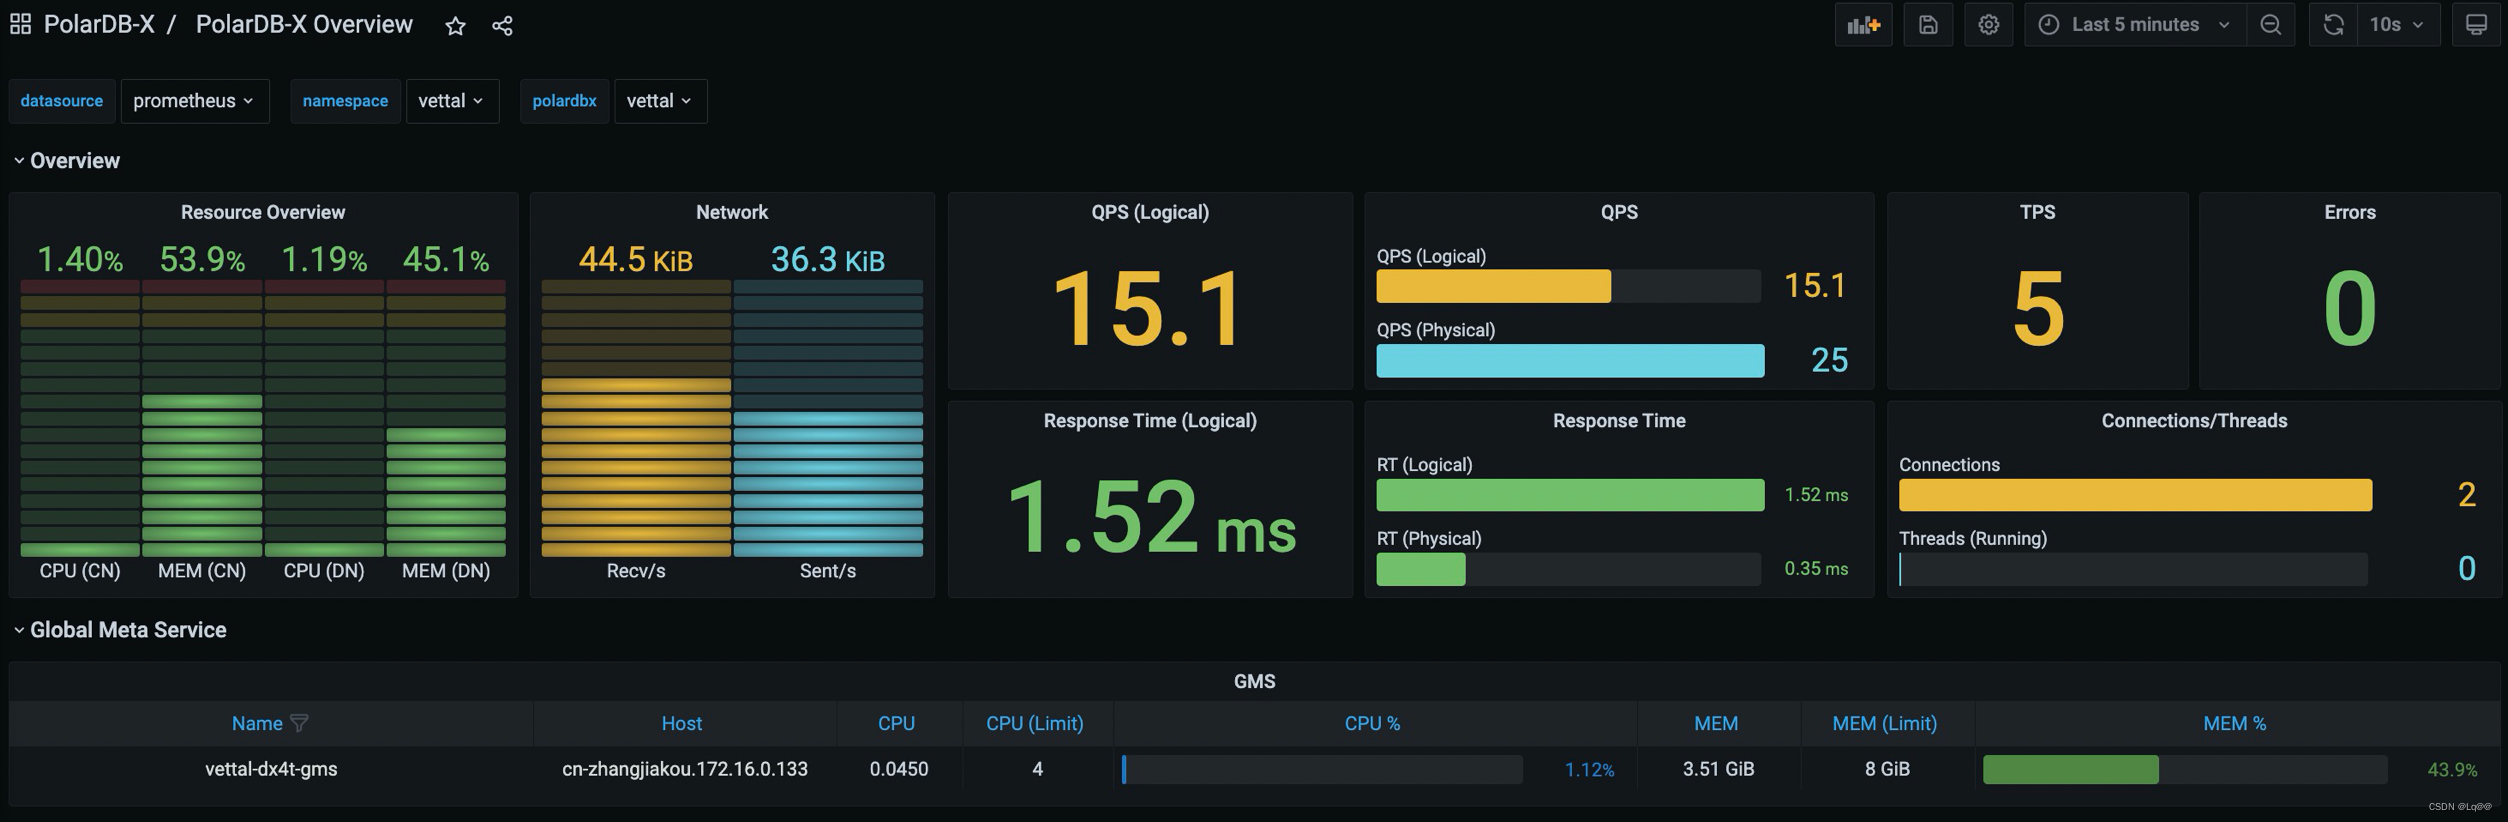
在浏览器中输入: http://localhost:3000, 即可访问到 PolarDB-X Dashboard,默认的用户名和密码都是 admin。
注:由于 Grafana 的配置存储在 ConfigMap 中,您在 Grafana 中修改的密码或者新增的 Dashboard 不会被持久化,一旦 Grafana Pod 重建,这部分配置会丢失,请注意提前保存。
如果您的 K8s 集群中支持 LoadBalancer,你可以为 Grafana 的 Service 配置 LoadBalancer 进行访问,参考:
如果您的 K8s 集群内有多个 PolarDB-X Cluster,可以通过 Grafana 页面上面的下拉框切换 Namespace 和 PolarDB-X Cluster。
访问 Prometheus:
默认情况下执行如下命令将 Prometheus 端口转发到本地:
kubectl port-forward svc/prometheus-k8s -n polardbx-monitor 9090
在浏览器中输入: http://localhost:9090, 即可访问到 Prometheus页面。
5、配置 Prometheus 和 Grafana
PolarDB-X Monitor 的 helm chart 采用了默认的 Prometheus 和 Grafana 配置,如果您想修改相关配置,可以使用如下的命令安装或者升级 PolarDB-X Monitor,通过 values.yaml 覆盖默认的配置。
helm install --namespace polardbx-monitor polardbx-monitor polardbx-monitor-1.2.0.tgz -f values.yaml

#或者:

helm upgrade --namespace polardbx-monitor polardbx-monitor polardbx-monitor-1.2.0.tgz -f values.yaml
values.yaml 文件包含了 Prometheus 和 Grafana 的相关配置项,下面针对常见的几种场景给出配置示例,详细的配置列表如下:
# monitor related components
monitors:
  # AlertManager related config.
  # AlertManager will not be installed by default
  alertManager:
    # AlertManager docker repo and image. It can be set to your private repo.
    repo: quay.io/prometheus
    image: alertmanager
    # AlertManager version
    version: v0.21.0
    # AlertManager replicas
    replicas: 0
    # AlertManager ports default: 9093
    port: 9093
    # The node selector labels, AlterManager pod will deploy only on the nodes with such labels
    nodeSelector:
      kubernetes.io/os: linux
    # ServiceAccount configuration of AlertManager. If ServiceAccount exists, set create to false
    serviceAccount:
      create: true

    # AlertManager service type, default: ClusterIP. Support NodePort, LoadBalancer, ClusterIP
    serviceType: ClusterIP

    # AlertManager resources, default is empty
    resources: {

    }

  # Grafana related configurations
  grafana:
    # Grafana docker repo and image. It can be set to your private repo.
    repo: grafana
    image: grafana
    version: 7.5.3
    # Grafana replicas, you can scale out/in grafana by this value.
    replicas: 1
    # Grafana port, default: 3000
    port: 3000
    # Grafana service type, default: ClusterIP. Support NodePort, LoadBalancer, ClusterIP
    serviceType: ClusterIP

    # Grafana resources configuration
    resources:
      requests:
        cpu: 2000m
        memory: 4Gi
      limits:
        cpu: 4000m
        memory: 8Gi
    # The node selector labels, Grafana pod will deploy only on the nodes with such labels
    nodeSelector:
      kubernetes.io/os: linux

    # ServiceAccount configuration of Grafana. If ServiceAccount exists, set create to false
    serviceAccount:
      create: true

  # KubeStateMetrics related configuration.
  # kube-state-metrics (KSM) is a simple service that listens to the Kubernetes API server and generates metrics
  # about the state of the objects.
  kubeStateMetrics:
    repo: quay.io/coreos
    image: kube-state-metrics
    version: v1.9.7
    replicas: 1

    # The node selector labels, KubeStateMetrics pod will deploy only on the nodes with such labels
    nodeSelector:
      kubernetes.io/os: linux

    # RBAC and ServiceAccount of KubeStateMetrics
    rbac:
      create: true
    serviceAccount:
      create: true

    resources: {

    }

  # KubeRBACProxy is a small HTTP proxy for a single upstream, that can perform RBAC authorization
  # against the Kubernetes API using SubjectAccessReview.
  kubeRBACProxy:
    repo: quay.io/brancz
    image: kube-rbac-proxy
    version: v0.8.0

    resources: {

    }

  # NodeExporter is Prometheus exporter for hardware and OS metrics exposed by *NIX kernels,
  # written in Go with pluggable metric collectors.
  # It is a DaemonSet deployed in K8s
  nodeExporter:
    # NodeExporter docker repo and image
    repo: quay.io/prometheus
    image: node-exporter
    version: v1.0.1
    # Node exporter port, update this value if port conflict
    port: 9100

    # Node exporter RBAC and ServiceAccount
    rbac:
      create: true
    serviceAccount:
      create: true

    # Node exporter resources, you can scale up/down
    resources:
      limits:
        cpu: 250m
        memory: 512Mi
      requests:
        cpu: 100m
        memory: 128Mi

  # PrometheusAdapter is an implementation of the custom.metrics.k8s.io API using Prometheus
  prometheusAdapter:
    # PrometheusAdapter docker repo and image
    repo: directxman12
    image: k8s-prometheus-adapter
    version: v0.8.2
    # PrometheusAdapter replicas
    replicas: 1

    # The node selector labels, PrometheusAdapter pod will deploy only on the nodes with such labels
    nodeSelector:
      kubernetes.io/os: linux

    # RBAC and ServiceAccount of PrometheusAdapter
    rbac:
      create: true
    serviceAccount:
      create: true

    resources: {

    }

  # Prometheus configuration
  prometheus:
    # Docker repo and image of Prometheus
    repo: quay.io/prometheus
    image: prometheus
    version: v2.22.1
    # Prometheus node replicas, you can scale out/in prometheus by this value
    replicas: 1
    # Prometheus service type, default: ClusterIP. Support NodePort, LoadBalancer, ClusterIP
    serviceType: ClusterIP

    # Prometheus node selector. The prometheus pod will deployed on the nodes with such labels
    nodeSelector:
      kubernetes.io/os: linux

    # Monitor data retention time
    retention: 1w
    # Monitor data retention size
    retentionSize: 200GB
    # Prometheus resources
    resources:
      requests:
        cpu: 4000m
        memory: 8Gi
      limits:
        cpu: 8000m
        memory: 16Gi

    # Prometheus RBAC and ServiceAccount
    rbac:
      create: true
    serviceAccount:
      create: true

    # Monitor data persist configuration, default is false
    persist: false
    # If persist is true, the monitor data storage class
    storageClassName: ssd
    # If persist is true, the monitor data storage size request
    storageRequest: 40G

  # The Prometheus Operator provides Kubernetes native deployment and management of Prometheus and related monitoring
  # components. The purpose of this component is to simplify and automate the configuration of a Prometheus based
  # monitoring stack for Kubernetes clusters.
  prometheusOperator:
    repo: quay.io/prometheus-operator
    image: prometheus-operator
    version: v0.44.1
    replicas: 1

    # The node selector labels, PrometheusOperator pod will deploy only on the nodes with such labels
    nodeSelector:
      kubernetes.io/os: linux

    # PrometheusOperator RBAC and ServiceAccount
    rbac:
      create: true
    serviceAccount:
      create: true

    resources:
      limits:
        cpu: 200m
        memory: 200Mi
      requests:
        cpu: 100m
        memory: 100Mi

  # PrometheusOperator related component
  prometheusConfigReloader:
    repo: quay.io/prometheus-operator
    image: prometheus-config-reloader
    version: v0.44.1
-
1、配置 LoadBalancer**
- 如果您的 K8s 集群支持 LoadBalancer,可以在安装或者升级 PolarDB-X Monitor 的时候通过 -f 参数指定如下配置:
monitors:
  grafana:
    serviceType: LoadBalancer
  prometheus:
    serviceType: LoadBalancer
-
2、持久化监控数据
- 默认配置创建的 Prometheus 集群的监控数据是不持久化的,存在数据丢失的风险,您可以通过如果的values.yaml 指定数据持久化的目录:
monitors:
  prometheus:
    persist: true
    # K8s 集群内支持的 storage class
    storageClassName: ssd
    # 存储空间的大小
    storageRequest: 100G
-
3、配置 Prometheus 和 Grafana 规格
- 默认配置中,Prometheus 集群包含1个节点,每个节点限定8C16G资源,Grafana包含1个节点,每个节点限定4C8G的资源,您可以通过如下配置项修改 Prometheus 和 Grafana集群的规格和节点数量:
monitors:
  grafana:
    resources:
      requests:
        cpu: 1000m
        memory: 2Gi
      limits:
        cpu: 2000m
        memory: 8Gi
  prometheus:
    resources:
      requests:
        cpu: 1000m
        memory: 2Gi
      limits:
        cpu: 2000m
        memory: 8Gi