PrometheusRule
用于配置 Prometheus 的 Rule 规则文件,包括 recording rules 和 alerting,可以自动被 Prometheus 加载。
配置 PrometheusRule
现在我们知道怎么自定义一个 ServiceMonitor 对象了,但是如果需要自定义一个报警规则的话呢?我们去查看 Prometheus Dashboard 的 Alert 页面下面就已经有很多报警规则了,这一系列的规则其实都来自于项目 GitHub - kubernetes-monitoring/kubernetes-mixin: A set of Grafana dashboards and Prometheus alerts for Kubernetes.,我们都通过 Prometheus Operator 安装配置上了。
但是这些报警信息是哪里来的呢?他们应该用怎样的方式通知我们呢?我们知道之前我们使用自定义的方式可以在 Prometheus 的配置文件之中指定 AlertManager 实例和报警的 rules 文件,现在我们通过 Operator 部署的呢?我们可以在 Prometheus Dashboard 的 Config 页面下面查看关于 AlertManager 的配置:
alerting:
  alert_relabel_configs:
    - separator: ;
      regex: prometheus_replica
      replacement: ☸ ➜1
      action: labeldrop
  alertmanagers:
    - follow_redirects: true
      enable_http2: true
      scheme: http
      path_prefix: /
      timeout: 10s
      api_version: v2
      relabel_configs:
        - source_labels: [__meta_kubernetes_service_name]
          separator: ;
          regex: alertmanager-main
          replacement: ☸ ➜1
          action: keep
        - source_labels: [__meta_kubernetes_endpoint_port_name]
          separator: ;
          regex: web
          replacement: ☸ ➜1
          action: keep
      kubernetes_sd_configs:
        - role: endpoints
          kubeconfig_file: ""
          follow_redirects: true
          enable_http2: true
          namespaces:
            own_namespace: false
            names:
              - monitoring
rule_files:
  - /etc/prometheus/rules/prometheus-k8s-rulefiles-0/*.yaml
上面 alertmanagers 的配置我们可以看到是通过 role 为 endpoints 的 kubernetes 的自动发现机制获取的,匹配的是服务名为 alertmanager-main,端口名为 web 的 Service 服务,我们可以查看下 alertmanager-main 这个 Service:
☸ ➜ kubectl describe svc alertmanager-main -n monitoring
Name:                     alertmanager-main
Namespace:                monitoring
Labels:                   app.kubernetes.io/component=alert-router
                          app.kubernetes.io/instance=main
                          app.kubernetes.io/name=alertmanager
                          app.kubernetes.io/part-of=kube-prometheus
                          app.kubernetes.io/version=0.24.0
Annotations:              <none>
Selector:                 app.kubernetes.io/component=alert-router,app.kubernetes.io/instance=main,app.kubernetes.io/name=alertmanager,app.kubernetes.io/part-of=kube-prometheus
Type:                     NodePort
IP Family Policy:         SingleStack
IP Families:              IPv4
IP:                       10.109.67.21
IPs:                      10.109.67.21
Port:                     web  9093/TCP
TargetPort:               web/TCP
NodePort:                 web  32033/TCP
Endpoints:                10.244.1.193:9093,10.244.2.208:9093,10.244.2.210:9093
Port:                     reloader-web  8080/TCP
TargetPort:               reloader-web/TCP
NodePort:                 reloader-web  30181/TCP
Endpoints:                10.244.1.193:8080,10.244.2.208:8080,10.244.2.210:8080
Session Affinity:         ClientIP
External Traffic Policy:  Cluster
Events:                   <none>
可以看到服务名正是 alertmanager-main,Port 定义的名称也是 web,符合上面的规则,所以 Prometheus 和 AlertManager 组件就正确关联上了。
而对应的报警规则文件位于:/etc/prometheus/rules/prometheus-k8s-rulefiles-0/ 目录下面所有的 YAML 文件。我们可以进入 Prometheus 的 Pod 中验证下该目录下面是否有 YAML 文件:
☸ ➜ kubectl exec -it prometheus-k8s-0 /bin/sh -n monitoringkubectl exec -it prometheus-k8s-0 -n monitoring -- /bin/sh
/prometheus ☸ ➜ ls /etc/prometheus/rules/prometheus-k8s-rulefiles-0/
monitoring-alertmanager-main-rules-79543974-2f8e-4c5f-9d23-2c349c38ff1d.yaml
monitoring-grafana-rules-8fc5e057-099e-4546-b6bd-d8fb1107c24d.yaml
monitoring-kube-prometheus-rules-79b18777-2df4-4e43-84a8-193053400842.yaml
monitoring-kube-state-metrics-rules-8341740e-f2b7-48e9-82c2-bd6b979f1da2.yaml
monitoring-kubernetes-monitoring-rules-4b169784-b211-4449-922f-52fb2efd839c.yaml
monitoring-node-exporter-rules-b5f0f4d3-aa18-4e7d-836f-ef0a8fda7569.yaml
monitoring-prometheus-k8s-prometheus-rules-9560ae4f-764c-4ba4-9a37-2fedb56773c7.yaml
monitoring-prometheus-operator-rules-7d3a1645-efe3-4214-b825-c77c39ceb0d4.yaml
/prometheus ☸ ➜ cat /etc/prometheus/rules/prometheus-k8s-rulefiles-0/monitoring-kube-prometheus-rules-79b18777-2df4-4e43-84a8-193053400842.yaml
groups:
- name: general.rules
  rules:
  - alert: TargetDown
    annotations:
      description: '{

   { printf "%.4g" ☸ ➜value }}% of the {

   { ☸ ➜labels.job }}/{

   { ☸ ➜labels.service
        }} targets in {

   { ☸ ➜labels.namespace }} namespace are down.'
      runbook_url: https://runbooks.prometheus-operator.dev/runbooks/general/targetdown
      summary: One or more targets are unreachable.
    expr: 100 * (count(up == 0) BY (job, namespace, service) / count(up) BY (job,
      namespace, service)) > 10
    for: 10m
    labels:
      severity: warning
......
这个 YAML 文件实际上就是我们之前创建的一个 PrometheusRule 文件包含的内容:
☸ ➜ cat kubePrometheus-prometheusRule.yaml
apiVersion: monitoring.coreos.com/v1
kind: PrometheusRule
metadata:
  labels:
    app.kubernetes.io/component: exporter
    app.kubernetes.io/name: kube-prometheus
    app.kubernetes.io/part-of: kube-prometheus
    prometheus: k8s
    role: alert-rules
  name: kube-prometheus-rules
  namespace: monitoring
spec:
  groups:
  - name: general.rules
    rules:
    - alert: TargetDown
      annotations:
        description: '{

   { printf "%.4g" ☸ ➜value }}% of the {

   { ☸ ➜labels.job }}/{

   { ☸ ➜labels.service
          }} targets in {

   { ☸ ➜labels.namespace }} namespace are down.'
        runbook_url: https://runbooks.prometheus-operator.dev/runbooks/general/targetdown
        summary: One or more targets are unreachable.
      expr: 100 * (count(up == 0) BY (job, namespace, service) / count(up) BY (job,
        namespace, service)) > 10
      for: 10m
      labels:
        severity: warning
......
我们这里的 PrometheusRule 的 name 为 kube-prometheus-rules,namespace 为 monitoring,我们可以猜想到我们创建一个 PrometheusRule 资源对象后,会自动在上面的 prometheus-k8s-rulefiles-0 目录下面生成一个对应的 <namespace>-<name>-<xxx-id>.yaml 文件,所以如果以后我们需要自定义一个报警选项的话,只需要定义一个 PrometheusRule 资源对象即可。
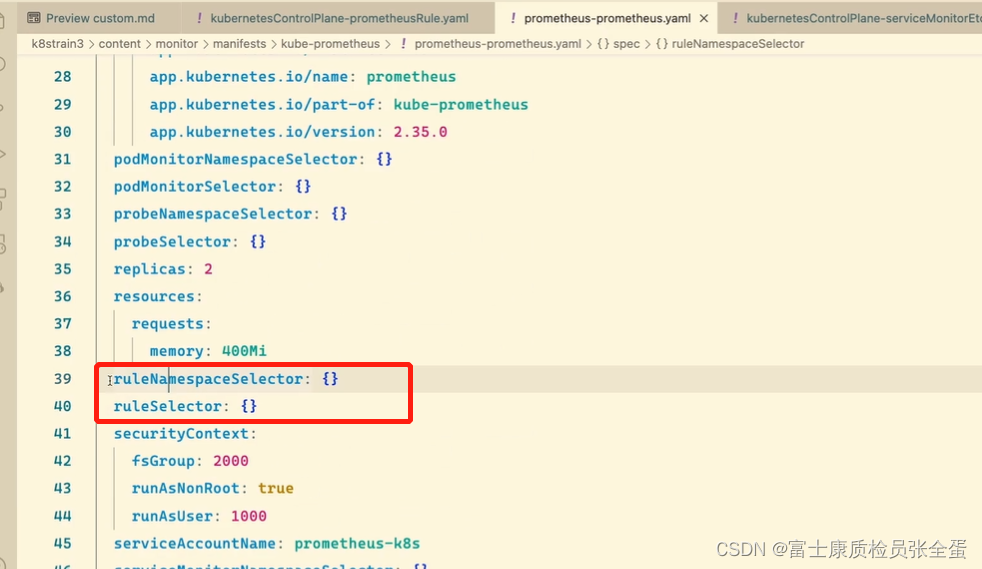
至于为什么 Prometheus 能够识别这个 PrometheusRule 资源对象呢?这就需要查看我们创建的 prometheus 这个资源对象了,里面有非常重要的一个属性 ruleSelector,用来匹配 rule 规则的过滤器,我们这里没有过滤,所以可以匹配所有的,假设要求匹配具有 prometheus=k8s 和 role=alert-rules 标签的 PrometheusRule 资源对象,则可以添加下面的配置:
ruleSelector:
  matchLabels:
    prometheus: k8s
    role: alert-rules
所以我们要想自定义一个报警规则,只需要创建一个能够被 prometheus 对象匹配的 PrometheusRule 对象即可,比如现在我们添加一个 etcd 是否可用的报警,我们知道 etcd 整个集群有一半以上的节点可用的话集群就是可用的,所以我们判断如果不可用的 etcd 数量超过了一半那么就触发报警,创建文件 prometheus-etcdRules.yaml:
apiVersion: monitoring.coreos.com/v1
kind: PrometheusRule
metadata:
labels:
prometheus: k8s
role: alert-rules
name: etcd-rules
namespace: monitoring
spec:
groups:
- name: etcd
rules:
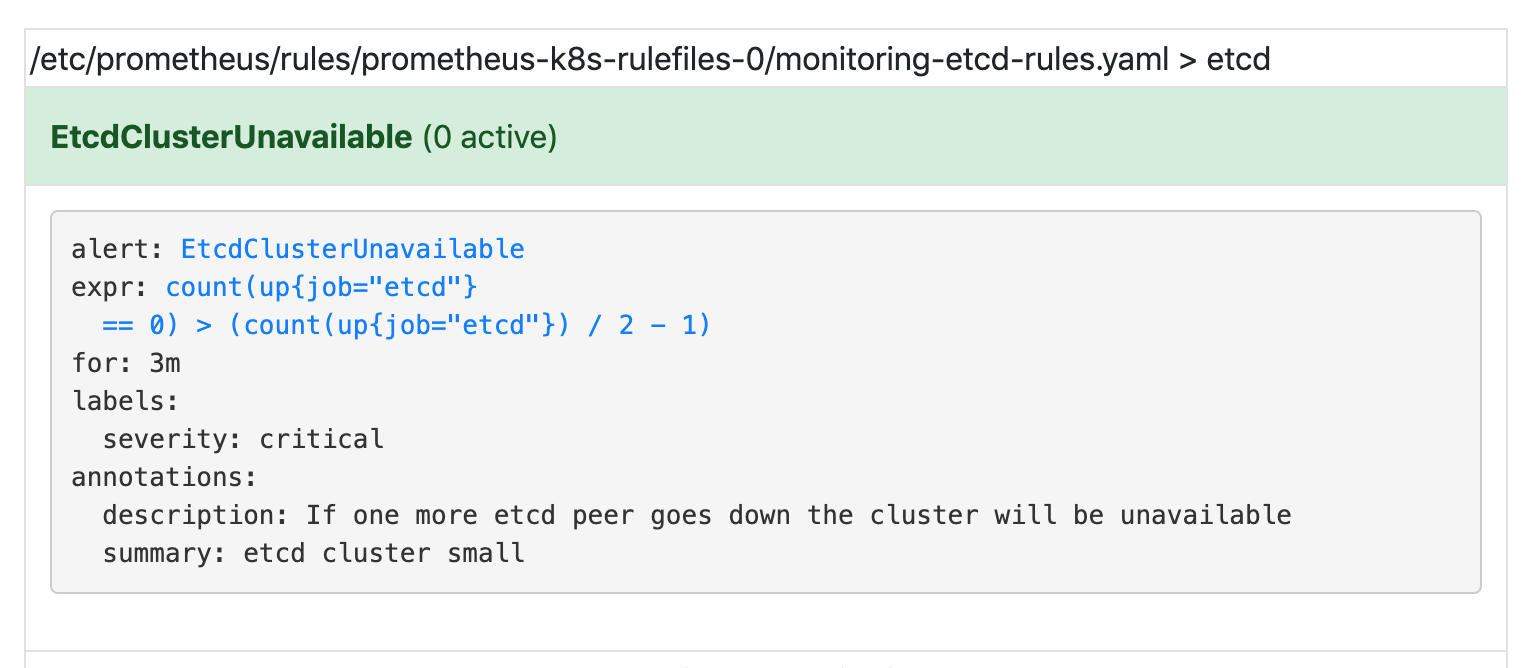
- alert: EtcdClusterUnavailable
annotations:
summary: etcd cluster small
description: If one more etcd peer goes down the cluster will be unavailable
expr: |
count(up{job="etcd"} == 0) > (count(up{job="etcd"}) / 2 - 1)
for: 3m
labels:
severity: critical
创建完成后,隔一会儿再去容器中查看下 rules 文件夹:
☸ ➜ kubectl apply -f https://p8s.io/docs/operator/manifests/prometheus-etcdRules.yaml
prometheusrule.monitoring.coreos.com/etcd-rules created
☸ ➜ kubectl exec -it prometheus-k8s-0 /bin/sh -n monitoring
Defaulting container name to prometheus.
Use 'kubectl describe pod/prometheus-k8s-0 -n monitoring' to see all of the containers in this pod.
/prometheus ☸ ➜ ls /etc/prometheus/rules/prometheus-k8s-rulefiles-0/
monitoring-etcd-rules.yaml            monitoring-prometheus-k8s-rules.yaml
可以看到我们创建的 rule 文件已经被注入到了对应的 rulefiles 文件夹下面了,证明我们上面的设想是正确的。然后再去 Prometheus Dashboard 的 Alert 页面下面就可以查看到上面我们新建的报警规则了: