本节来介绍使用ggfittext包geom_fit_text函数来给ggplot2图像添加文本,喜欢的小伙伴欢迎扫描文末二维码加入我的交流群更多精彩内容为您而准备
安装并加载R包
package.list=c("tidyverse","ggfittext")

for (package in package.list) {
  if (!require(package,character.only=T, quietly=T)) {
    install.packages(package)
    library(package, character.only=T)
  }
}
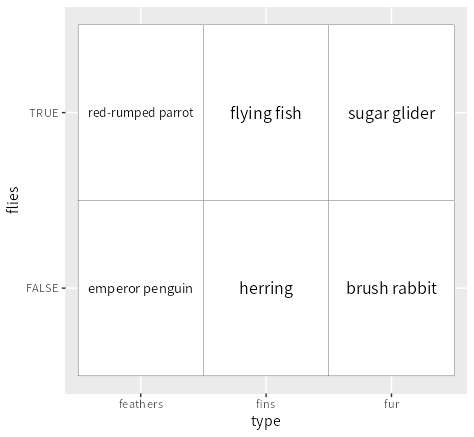
将文本添加的框中
ggplot(animals, aes(x = type, y = flies, label = animal)) +
  geom_tile(fill = "white", colour = "black") +
  geom_fit_text()
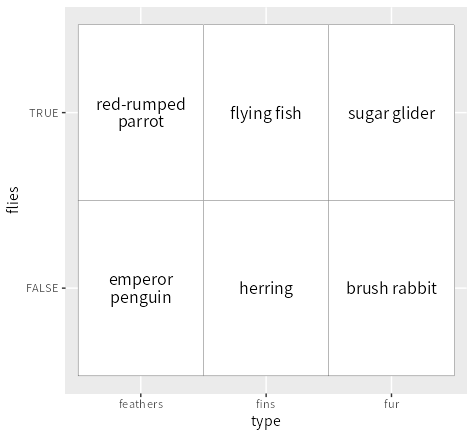
ggplot(animals, aes(x = type, y = flies, label = animal)) +
  geom_tile(fill = "white", colour = "black") +
  geom_fit_text(reflow = TRUE)
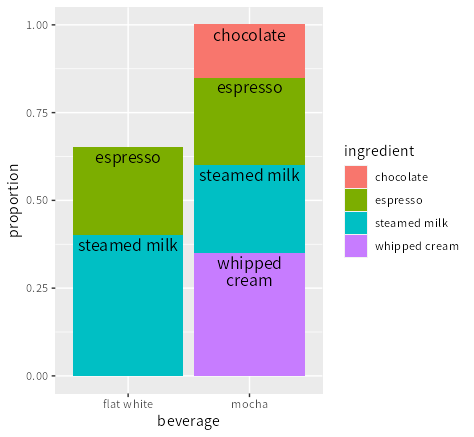
柱状图添加文本
ggplot(altitudes, aes(x = craft, y = altitude, label = altitude)) +
  geom_col() +
  geom_bar_text()

ggplot(beverages, aes(x = beverage,
y = proportion, label = ingredient,fill = ingredient)) +
  geom_col(position = "stack") +
  geom_bar_text(position = "stack", reflow = TRUE)
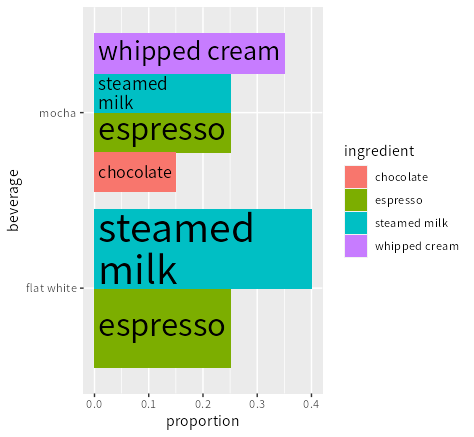
ggplot(beverages, aes(x = beverage,
y = proportion, label = ingredient,fill = ingredient)) +
  geom_col(position = "dodge") +
  geom_bar_text(position = "dodge", grow = TRUE, reflow = TRUE,
                place = "left") +coord_flip()
极坐标图添加文本
p <- ggplot(gold, aes(xmin = xmin,xmax = xmax,
ymin = ymin, ymax = ymax,fill = linenumber, label = line)) +
  coord_polar() +
  geom_rect() +
  scale_fill_gradient(low = "#fee391", high = "#238443")
p + geom_fit_text(min.size = 0, grow = TRUE)
 调整文本方向
p + geom_fit_text(min.size = 0, grow = TRUE, flip = TRUE)


关注下方公众号,获取更多优质资源,如需要加入微信交流群,请在菜单栏处添加作者微信,即可邀您进群
本文分享自微信公众号 - 小明的数据分析笔记本(gh_0c8895f349d3)。
如有侵权,请联系 [email protected] 删除。
本文参与“OSC源创计划”,欢迎正在阅读的你也加入,一起分享。
{{o.name}}
{{m.name}}